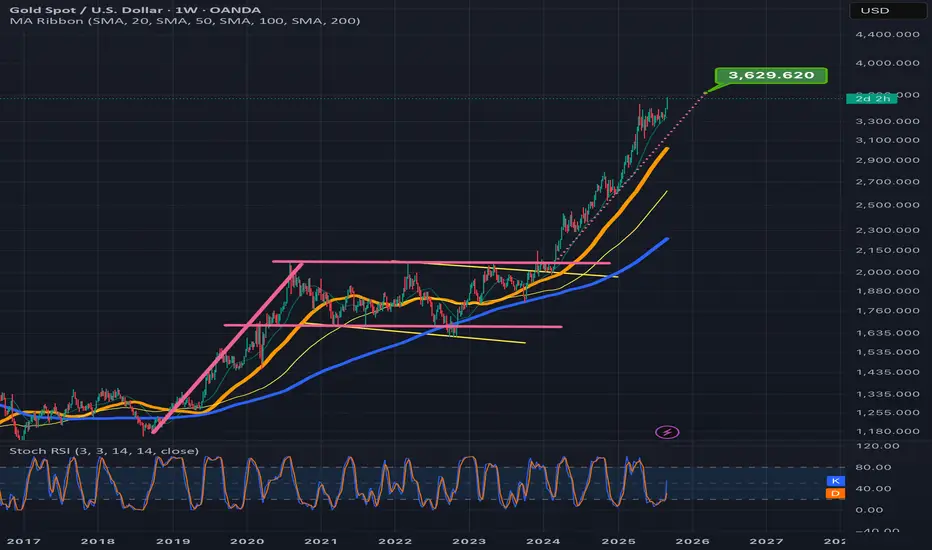
Next bullish pattern target for gold is at $8,195After my smaller timeframe gold chart played out to an exact T with absolute precision, I decided I woud zoom out to try and find the enxt possible pattern and breakout target. I am on the log chart here and we can see how on the long timeframes on log chart, the gold chart is just a series of bullflags. Of which the one with the longest flag pole we have just recently broken up from, when taking a measured move of that flagpole shown here with the tan trendline, and placing it at the breakout point of the flag, we can see there is a measured move target that goes all the way to $8,195. Impressive if this one plays out with anywhere close to the same precision as my last gold chart did. *not financial advice*
Bullish Flag

USDJPY rallies on BOJ's "dovish hike": Is 158.00 next target?USDJPY is surging past 156.00 despite the BOJ raising rates to 0.75%, the highest level since 1995. This classic "buy the rumour, sell the fact" reaction is fuelled by Governor Ueda's cautious guidance, signalling no rush for further hikes. A lack of commitment to a neutral rate path has kept the carry trade alive.
Key drivers
"Dovish hike" Reaction : The BOJ raised rates to 0.75% as priced in, but Governor Ueda emphasized a "data-dependent" approach with "no pre-set path," disappointing hawks hoping for a rapid tightening cycle.
Neutral rate uncertainty : Ueda admitted it's "challenging to pinpoint" the neutral rate and wants to observe the economy's reaction first, implying a pause that leaves the wide yield gap with the US (3.5%+) intact.
Technical breakout : USD/JPY has cleared the 156.00 resistance zone, confirming a bullish flag breakout on the daily chart. RSI resetting near 50 supports further upside potential.
Key targets : Immediate focus is on the swing high at 157.00, followed by the 2025 peak at 157.93 and the 138.2% Fibonacci extension at 158.77.
Trade plan : Bias is bullish above 156.00. Look to buy pullbacks into the 156.00–156.20 support zone, targeting 157.00+; invalidation below 155.00.
Are you buying the BOJ breakout? Share your USD/JPY targets in the comments and follow for more central bank and technical trade setups.
This content is not directed to residents of the EU or UK. Any opinions, news, research, analyses, prices or other information contained on this website is provided as general market commentary and does not constitute investment advice. ThinkMarkets will not accept liability for any loss or damage including, without limitation, to any loss of profit which may arise directly or indirectly from use of or reliance on such information.

EURCHF new bullish expected
OANDA:EURCHF trend based analysis, we are have strong bullish push, currently price in BULLISH FLAG pattern, from here expecting new bullish push
SUP zone: 0.93100
RES zone: 0.93950, 0.94150

XAUUSD: Double Flag Setup, but with a "Warning"Things could get interesting this week.
In my previous analysis, I pointed out a big flag structure, with a smaller flag forming on top of it. But for the bullish scenario to actually happen, that second flag needs to break to the upside with strength…
THE PROBLEM? This retracement is already deeper than I’d personally like to see in a healthy bullish flag. The deeper it pulls back, the more it signals uncertain buyers, and this can create a DOMINO effect. When buyers can’t defend higher levels, it tells you something simple: if buyers hesitate, breakouts don’t sustain, they fake out, or get dragged right back into the range.
So until it breaks cleanly above that mini-flag structure, there’s no real trigger. This is the zone where patience matters. If buyers want to really reclaim back control, we need to see a clean, big breakout of the mini flag, not just a wick, not just a tease. Ideally a break with volume, closed above it.
If that breakout happens, I anticipate price could reach 4,300 with ease. But if it breaks below the lower trendline, the whole scenario gets invalidated, that deep retracement will no longer be a “pullback,” it will be the beginning of a shift.
So for now: wait for clarity. No breakout, no trade.

Lemonade Inc.: Breakout in Motion — Cup, Flag, and No BrakesLemonade Inc. (LMND) is accelerating after a clean breakout from a textbook cup with handle pattern, where the handle formed as a tight bullish flag. The breakout occurred around $32, and since then, price action has been sharp, controlled, and uncorrected — currently trading at $42.42 with buyers clearly in charge.
On the fundamental side, LMND is moving through a recovery phase: operational losses are narrowing, revenue is stabilizing, and the company is aggressively leveraging AI to automate its insurance processes. Expansion into Europe continues, and institutional interest is visibly rising — confirmed by volume building alongside price. Within the insuretech sector, LMND is starting to look like a comeback story rather than a cautionary tale.
Technically, the setup remains strong:
– Golden Cross confirmed (EMA50 crossing EMA200)
– EMA50/100/200 all below price — bullish structure firmly intact
– Volume expanding on up-days — healthy confirmation
– RSI hovering in the 60–65 range — momentum is intact, no signs of exhaustion
Targets remain aligned with the structure:
– tp1 = $64 — measured move from the flag
– tp2 = $94 — full realization of the cup pattern
Tactically, this is no longer a “wait and see” setup — the move is in progress. No correction so far, only continuation. Momentum traders may consider entries into strength. Above $45, the move could accelerate further as more participants recognize the structure.
LMND is showing technical and fundamental alignment — confirmed breakout, improving narrative, and strong trend structure. While the impulse holds, this chart favors continuation, not hesitation.

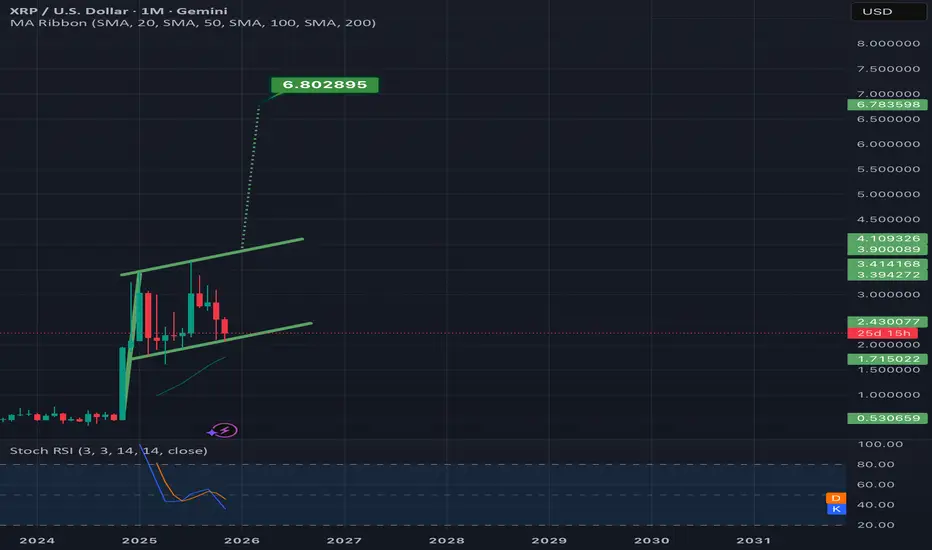
Bullflag on xrp has a target of $6.80 if it validates n DecemberWill be a very good sign if it finds a way to hold this bottom trendline as support.Even if it does hold support a wick below it is still very possible. *not financial advice*
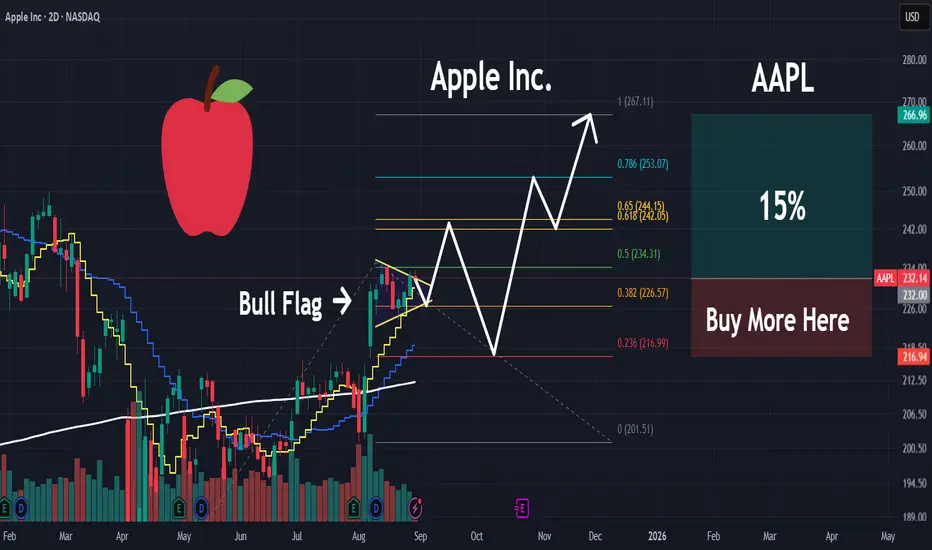
AAPL | Money will Rotate into this MEGA CAP | LONGApple, Inc. engages in the design, manufacture, and sale of smartphones, personal computers, tablets, wearables and accessories, and other varieties of related services. It operates through the following geographical segments: Americas, Europe, Greater China, Japan, and Rest of Asia Pacific. The Americas segment includes North and South America. The Europe segment consists of European countries, as well as India, the Middle East, and Africa. The Greater China segment comprises China, Hong Kong, and Taiwan. The Rest of Asia Pacific segment includes Australia and Asian countries. Its products and services include iPhone, Mac, iPad, AirPods, Apple TV, Apple Watch, Beats products, AppleCare, iCloud, digital content stores, streaming, and licensing services. The company was founded by Steven Paul Jobs, Ronald Gerald Wayne, and Stephen G. Wozniak in April 1976 and is headquartered in Cupertino, CA.
OPEN 1D - Flag Ready for Takeoff?On the daily chart, Opendoor Technologies (OPEN) is forming a clean bullish flag - a consolidation phase following a massive +400% rally since spring 2025. Price action remains tightly contained within the pattern, with strong support from the MA50 and the 6.3–7.4 buy zone, aligning with the 0.618 Fibonacci retracement.
Technically , the setup looks mature: MA50 is trending upward, MA200 sits far below, and volume contraction hints at a breakout ahead. The first target sits at $16.50 (1.618 extension), while the second target lies at $25.60 (2.618 extension) - a potential +200% move from current levels.
Fundamentally, Opendoor is finally emerging from its downturn:
– +37% YoY growth in property transactions;
– operating costs reduced by ~25%;
– positive operating cash flow for the first time in three years;
– partnerships with Zillow and Redfin driving stronger customer acquisition.
With the U.S. housing market showing signs of recovery and potential Fed rate cuts on the horizon, OPEN stands out as a high-upside play in the proptech sector.
Tactical plan: watch for accumulation near 6.3–7.4, add on breakout confirmation. Profit targets: 16.5 → 25.6.
After all, in both trading and real estate - it’s all about timing and location.

USDCHF Bullish Flag Pattern most of bullish flag patterns gets their targets they are called bullish patterns but dont forget to put STOPLOSS .

Got The GUTS For Stocks? Fractyl Health, Inc. Prints A Bull FlagNASDAQ:GUTS has printed a Bull Flag and with Price making a Retracement to the 50% Fibonacci Level @ $1.28, the Consolidation Phase of Price should be coming to and end!
This could mean its time to Buy Stock in Fractyl Health, Inc!
Once able to Breakout of the Descending Channel of the Flag, Price on Fractyl could keep pushing up!!
Currently the Analyst 1 Yr Price Target is set for $6.76, almost a 400% gain!
The company is also making great strides in weight loss study's and obesity gene therapy!

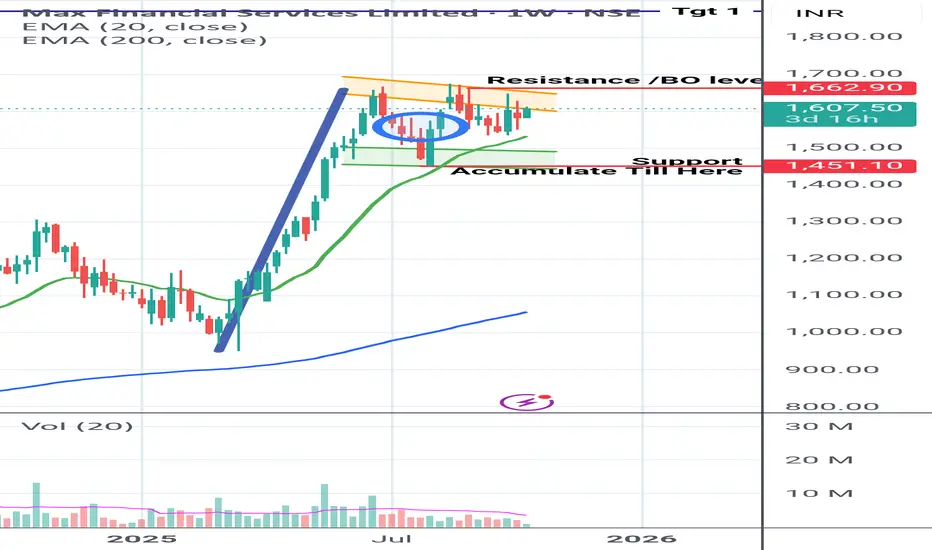
Max Financial going to serve Big# Fresh Pick
Date 13/10/25
MAX FINANCIAL SERVICE
Pattern Observed : Bullish Flag Pattern formation 🐮🇮🇳. Near Breakout stage.
On Confirmation of the breakout, we can see a good rally.
Targets/ Breakout /Support are marked in Chart.
Shared it for Reference purpose based on chart pattern.
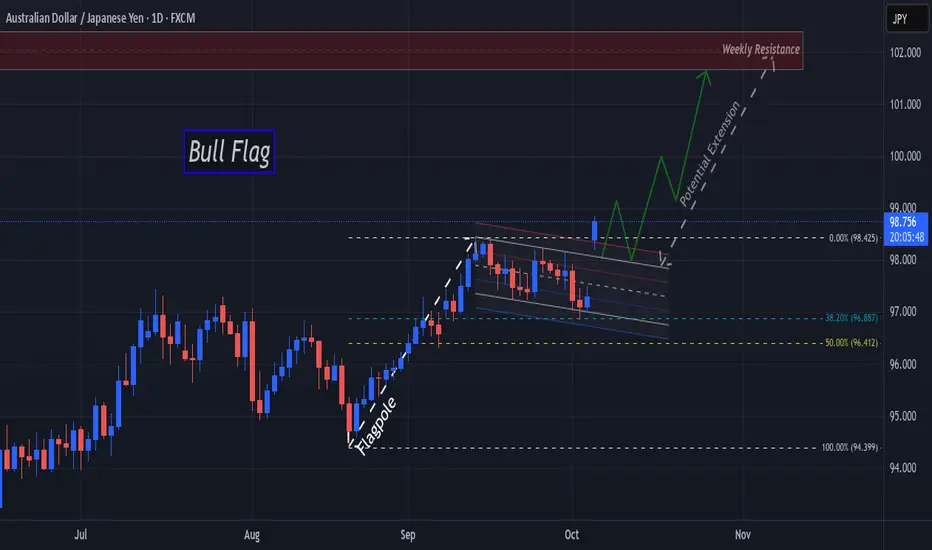
AJ Bulls Raise A Flag As They Gap Up To Start The Week!Price on OANDA:AUDJPY has been consolidating down a Descending Channel for the past 3 weeks and after making a 38.2% Retracement of the 98.425 High, to open this week, Bulls created a huge gap up, breaking out of the Descending Channel!
This Breakout confirms the Continuation Pattern, the Bull Flag!
If Bulls are able to secure a close higher than 98.425 during this Breakout and are successful in a Retest in the 98 - 97.8 range, this could deliver potential Long opportunities as a Bull Flag Breakout and Retest Set-Up!
Once we have a Valid Breakout and Successful Retest, the Price Target for the move will be into the Weekly Resistance that can be found in the 102 range from November Highs of 2024!
XAUUSD’s next target = $4059Because of the bullflag with the long pole it is currently breaking up from *not financial advice*

Descending channel/Bull flag on xrpusd revealedAfter the most recent resistance was found I was able to find the channel xrpusd price action is currently in which also is functioning as a bullflag. My guess is the uptrend will resume in October but we will know soon enough *not financial advice*

MARIPSX MARI :: Day Level
📈 MARI Trading Recommendation
Current Market Price (CMP): PKR 685
💎 Bullish Bias: BUY & HOLD
✅ My clear view: MARI is a strong buy for long-& Mid term investors. Fundamentals are solid, and the recent dividend announcement strengthens the positive outlook.
💹 Long-Term Investors:
Enter at the current price for early entry and hold for very strong returns.
Support Levels for Accumulation (if price dips):
🔹 654 (immediate support; key level after breaking smaller range Jan–Sep 2025)
🔹 643
🔹 620
🔹 610
This allows accumulating MARI at discounted prices while maintaining a bullish long-Mid term view.
📊 Technical Outlook:
Range Bound: Since January 2024, MARI has been trading in a broader range of 590–744.
Resistance: 723–744
Support: 590–612
Smaller Positive Range: 605–654, which has been positively broken.
654 now acts as key support.
⚡ Intraday / Short-Term Traders:
Monitor daily price action carefully. Not recoomended for intraday Trading but can manag as per below:
Rule: Do not hold if the price closes below 654 with a bearish candle on the daily chart.
A break below may lead to pullbacks toward 643–610.
Target TP1: 723 TP2: 744
Pattern: Formation of a bullish flag indicating potential upward movement.
✅ Summary:
Long-Mid term: Buy & hold 💎
Short-term: Watch 654 closely ⚡
Market sentiment favors upward movement, making MARI attractive for both accumulation and swing trading.

A descending channel/bullflag reveals itself on btcusdThe pole looks more obvious on longer timeframe charts but the flag/ channel itself is best illustrated on the 1day time frame. In fact there is a much longer pole than the one shown here on the monthly chart, but I didn’t go with that one because the flag on the monthly is more of a horizontal channel than the descending channel shown here on the 1day chart. *not financial advice*

EURJPY bullish view
OANDA:EURJPY interesting chart, BULLISH FLAG pattern visible, currently after ECB from last week here still will be bullish.
SUP zone: 172.800
RES zone: 1.74000, 1.74300

GBPJPY still bullish expectations
OANDA:GBPJPY price is make bullish push, then we are have BULLISH FLAG created, in this week price is making zig-zag moves in zone, today its make break, which taking for bullish confirmation.
SUP zone: 199.400
RES zone: 200.600, 201.400

Gold chart showing Technical Analysis at its bestTA doesn’t get much more exact than this. Gold beautifully displayed why TA is such a powerful manifestation device. Look how perfectly Gold broke up and then used the dotted measured move line as a staircase to climb its way to the full breakout target. Perfection. Those who’s off at TA as just imaginary or arbitrary lines, have not seen this kind of accuracy play outthe and time again as I have during my time as a technical analyst. Posting this as a prime example for posterity. *not financial advice*
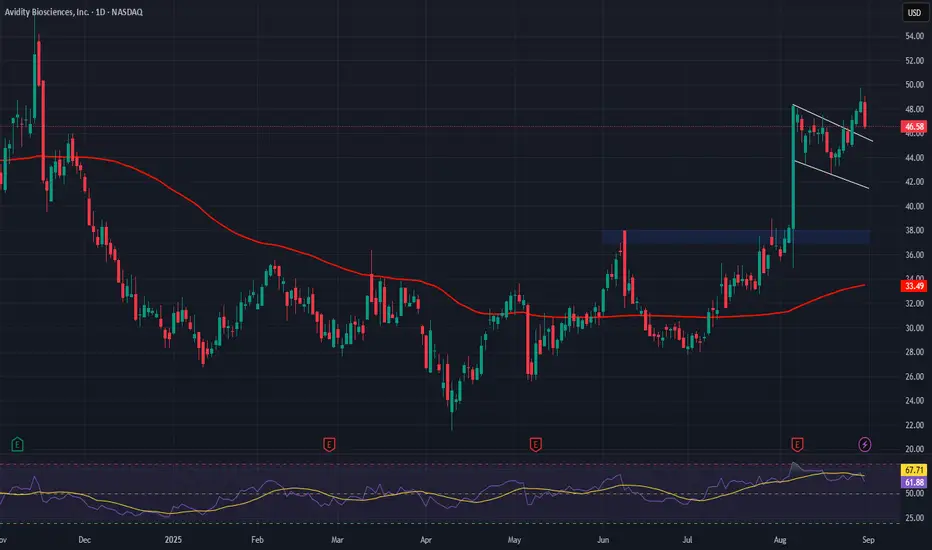
Avidity Biosciences (RNA) AnalysisCompany Overview:
Avidity Biosciences NASDAQ:RNA is pioneering RNA therapeutics with its Antibody Oligonucleotide Conjugates (AOC) platform, aiming at rare genetic diseases where no treatments exist—unlocking high unmet demand.
Financial Snapshot (Q2):
Revenue: $3.85M
Net loss: $157.31M (reflecting heavy early-stage R&D investment)
Valuation: P/S 529.67, P/B 9.27, signaling premium growth pricing by investors.
Technical View:
Stock has formed multiple bull flag patterns.
Breakout potential is strong after recent consolidation phase.
Investment Outlook:
Bullish above: $37.00–$38.00
Upside target: $70.00–$72.00, supported by pipeline innovation + bullish technical setup.
📢 RNA — premium biotech bet with rare-disease focus and breakout momentum.
#RNA #Biotech #Genomics #GrowthStocks #BullFlag #Breakout
KC | Massive Break Out Incoming | LONGKingsoft Cloud Holdings Ltd. provides cloud storage and cloud computation services. It offers cloud platform consisting of cloud infrastructure, cutting-edge cloud products and architected industry-specific solutions across public cloud, enterprise cloud and AIoT cloud services. The firm's products include computing, networking, storage & CDN, database, data analysis and security. It offers medical & healthcare solutions, supply chain finance solutions, e-government solutions, internet of vehicles solutions, media cloud solutions, big data education & training solutions, cloud integrated service and cloud gaming service. The company was founded in 2012 and is headquartered in Beijing, China.

#BTCEUR #1D (Binance) Bull-flag breakout and retestBitcoin looks very good for bullish continuation after regaining 50MA support on daily, against the Euro.
⚡️⚡️ #BTC/EUR ⚡️⚡️
Exchanges: Binance
Signal Type: Regular (Long)
Amount: 12.0%
Entry Targets:
1) 93017.86
Take-Profit Targets:
1) 108422.28
Stop Targets:
1) 85296.36
Published By: @Zblaba
CRYPTOCAP:BTC BINANCE:BTCEUR #Bitcoin #PoW bitcoin.org
Risk/Reward= 1:2.0
Expected Profit= +16.6%
Possible Loss= -8.3%
Estimated Gaintime= 1-2 months

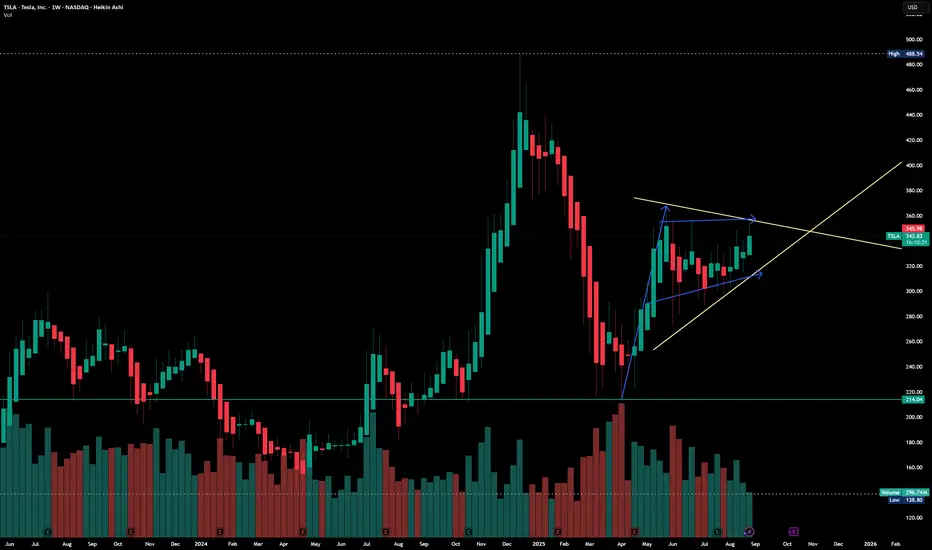
Tesla : A Symmetrical Triangle and Bullish Flag formation Disclaimer : Do your own research before investing. This is just a chart analysis. No recommendation to buy and sell.
Tesla company does not require any Introduction, Market leader in tech innovation.
Charts of Tesla is looking interesting where A Symmetrical Triangle and Bullish Flag formation is getting in place.
Tesla is having support around $300 mark and higher side is $488. will it regain that level again. Not one know about it. However, its getting in consolidation.
Current price of Tesla is $345 and one can look to $370 for near term.