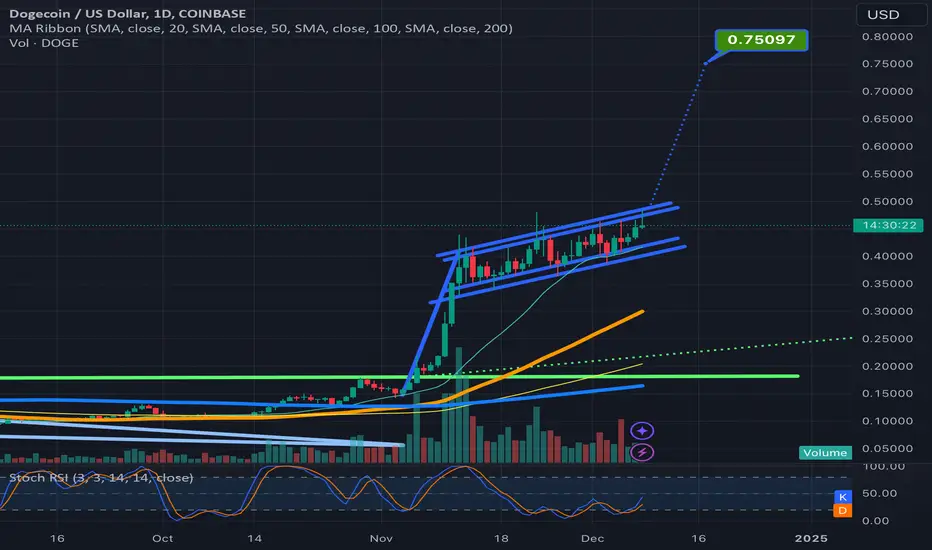
Doge can reach $.75 if it breaks upwards from ascending bullflagUsually an ascending channel like the one that is part of the bullflag on dogecoin’s 1 day chart beaks to the downside, except inside a parabolic phase of the bull market cycle. In the parabolic phase of a bull market cycle you can see several back to back rising wedges and ascending channels break to the upside so since we are really only 1-2 daily chart pattern breakouts into this current parabolic phase for the alt coin market, I think probability favors this ascending channel breaking upwards. If it does we also have the benefit of it being not only a channel but a bullflag as well and the target for such a breakout is around 75 cents. Furthermore if you flip to the weekly channel you would see that there is potential for the pole to be even longer than shown here on the daily timeframe, so I wouldn't be surprised if doge were able to overshoot the 75 cent target even. I noticed that the channel had valid trendlines on both the wicks and the candle bodies on both the bottom and top thats why the trendlines are doubled up, *not financial advice*
Bullish Flag
Bonk can pump 82% if it validated the bullflag bullish breakoutNo guarantee this pattern will break out, it could also extend the consolidation and morph into a completely different pattern, but at the moment it seems the best probability is a breakout upward considering we are only 1 big chart pattern breakout into the current long awaited altcoin market uptrend. *not financial advice* Please bonk responsibly.

PEPE/USDT: READY FOR A 100% RALLY!!🚀 Hey everyone! 👋
If this analysis excites you, hit that 👍 and follow for more high-value trade setups that deliver results! 💹
🔍 Technical Overview:
PEPE is primed for a major rally! Breaking out of a bull flag pattern on the 4-hour chart, it’s signaling an 80-100% upward move. The setup is strong, and the momentum looks unstoppable! 🔥
💸 Entry Range: CMP (Current Market Price) – Add more up to $0.022
🎯 Targets: 80-100% gains
📉 Stop Loss: $0.02
⚙️ Leverage: Use low leverage (max 5x)
💬 What’s your take on PEPE’s breakout potential? Are you seeing the same bullish momentum? Drop your thoughts, analysis, and predictions in the comments below, and let’s ride this wave together for massive profits! 🌊💰

Floki has an impressive chessboard at the momentMultiple overlapping bull patterns that will trigger eachother like a domino effect, It tart with the bull flag which we are already seeing begin to break out here. Fro here to the highest chart target is 111%. On the previous chart I posted on Floki, it had not yet been added to coinbase but we were speculating it would be and now it has. *not financial advice*

Iota’s current bull flag on the 4hr chart. I’m guessing the 4hr 50ma(in orange) will climb upward in the flag and help carry price action upward and out of the flag to trigger the breakout, from where price currently is the total gains on this is almost a 2x *not financial advice*

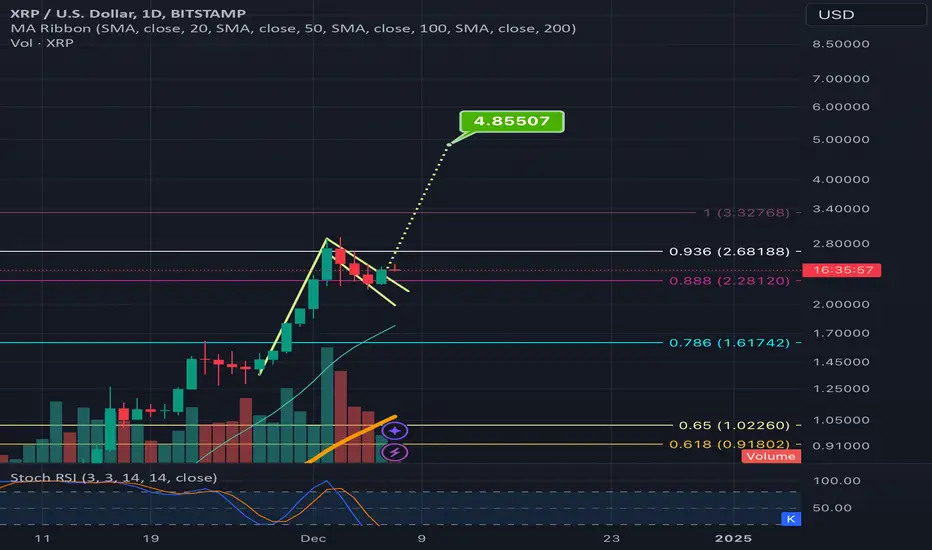
Logarthmic bullflag has an even larger breakout targetBrace yourself and fair warning this post is gonna get slightly more esoteric than some are comfortable with as it delves into numerology, so fair warning. I found it extremely interesting from a numerological standpoint when I saw @chartguy had predicted that this current xrp correction would ultimately find support on the .888 Fibonacci retracement level and as of now it appears it has. The number 38 as well as 888( aka 3 8s) has been coming up like crazy all the time for me this entire year, but then I also noticed it more than a few times specifically in reference to ripple and xrp. For example Ripple now has 38 billion xrp remaining locked in escrow. I found an iage during XRP’s 2016 pump of Brad on CNBC or fox business ot some channel like it and enxt to them they had put a graphic up on screen along side Brad Garlinghouse that said XRP had gone up 38,000% percent. Next fast forwarding back to a little earlierthis year, the last low xrp had put in as a bottom before finally slowly climbing back up to the blast off point was 38 cents. Because I had been seeing all these connections with 38 in regards to xrp and ripple but also in many other elements in my personal life, I bought some more xrp at 38 cents feeling like it would actually mark the most recent bottom and low and behold it did. Also the all time high for xrp on a few different exchanges is $3.80. Like I said above, another way to represent 38 is with 3 8’s aka (888). So on the lion’s gate portal this year 8/8/2024, 2024 numerologically reduces to 8 as well giving us the first time in quite awhile we have had 8/8/8 date like that, I was expecting something noteworthy to occur being that it’s a time that’s known for manifestation and abundance every year but with 3 8s instead of just the usual 8/8 it should be even more so, and sure enough ti was right on this weekend that Judge Torres issued her final judgement in the RIpple vs SEC case after 4 long years of waiting patiently for it to arrive. All this being said, when I then see that XRP corrected down exactly to the .888 Fibonacci level and is holding support there, if it does continue upwards from this level, it will simply be more confirmation and confluence to me that there is something significantly special and interrelated between xrp, and the numbers 38.88,888, 11, and 1111. I won’t go into the 11 significance too much in this idea as I’d prefer to focus on the 8s instead….so I’ll leave the numerology talk there for now and focus instead of the actual TA behind this logarithmic bullflag
Bullflag on bitcoin’s monthly log chart putting up big numbers 200k by May?! The measured move target is over 200k and the trajectory of the ensured move line suggests that it could even potentially reach this target in the first half of 2025. A very exciting notion let’s hope it can and will. I do expect one steep corrections on the way to this target. *not financial advice*

BTCUSD: Bullish Flag Breakout AheadBTCUSDT technical analysis update
At the bottom, Bitcoin formed a falling wedge pattern over 240 days. After breaking out, the price surged by 75%. Following this rise, BTC entered a 220-day consolidation phase, forming a rectangular continuation pattern, which led to a 133% increase after its breakout. Currently, BTC has been forming a flag pattern for the last 220 days, and in the next 10-20 days, we could see a breakout, potentially signaling another strong bullish move.
Regards
Hexa

Descending channel from the 1 month chart timeframeI just posted a version of this channel on the 3 month chart timeframe, however looking at the month time frame I also found some bullish confluence to confirm this potential channel. A deeper correction now that we have retested the top trendline of this potential channel would not surprise me from here. I arbitrarily put the measured move lines for when we could break up from this channel around May 2024, simply because the halvening occurs in mid to late april so it seemed like a reasonable area to expect us to finally overcome this channel. We’re we to break up from the channel in that exact spot, the measured move for the channel breakout on its own looks like it would take us to 80k. If it was more than just a channel and also a valid bull flag the measured move I get for the bul flag appears to be slightly under 100k. On the 3 month chart the bull flag was slightly over 100k but that may also be because I placed the measured move line arbitrarily earlier than may as I have done for this 1 month chart representation. Will be interesting to see how this plays out. The silver lining here is that if this channel is valid and price is about to flip back to the down trend for a few it is simply another opportunity to accumulate for the upcoming liftoff which is likely to occur post halvening. *not financial advice*

The Full Monthly Chart Bullflag on BitcoinUsd PairJust as an addendum to my chart I just posted on the measured move target for just the channel portion of this bullflag, I wanted to include an updated visual for the full flag and its breakout target which is pretty much just ever so slightly below 100k. Will link the previous relevant chart ideas below. *not financial advice*

A close above the top red trendline would be very bullishShown here on the weekly chart is the weekly bullflag bitcoin has been consolidating in ever since correcting from the all time high we hit earlier this year.. For the first time since then, we now have part of a daily candle body above the top eligible top trendline of the flag and may very well close the current daily candle above that trendline for the first time which would be a very bullish development. It will be even more bullish if we can also manage to close a weekly candle above it as well but we still have another 6 days before anything like that can occur. For now a daily candle close above is still good progress which we have about 40 minutes left before the current daily candle closes (not shown here). If we were to break up from the red bullflag at this exact spot on the chart, there is some excellent bullish confluence here as you can see the measured move breakout target from here would be the exact same target as the much larger Purple bull flag we broke upwards from back in February. Both have a target around 99k. So this would indeed be a great spot for such a breakout to occur. We can also see the weekly 50 moving average(in orange) is holding very strong bounce support and should help to prevent the price action from recentering the flag/channel in the coming months as it climbs higher. *not financial advice*

Chanllink pumping right after golden cross like most alts haveFollowing int he footsteps of most alt coins during alt season link is having a giant pump right now shortly after getting its golden cross. It is now well on the way to the $55 breakout target from the bullflag t was n that I posted about in my last Link chart idea. I will post a link to that previous chain link chart idea down below. *not financial advice*

XRP’s 3 hour chart 50ma climbing up through the bullflag A rare look by me at the 3 hour timeframe chart on XRPUSD. I normally don’t try to chart timeframes lower than 1 day because the chart patterns have a much lower success rate of reaching their full breakout targets. However I noticed that the 3 hour charts 50ma (in orange) has held as support since November 5th and is getting close to climbing its way up out of the bullflag here. If price continues to maintain solidified support on that 50ma, then it will validate the breakout up from this bullflag in the near future which will have a breakout target of around $2.00 . Of course being a small time frame, the 3hr 50ma could also easily flip back to resistance in which case we wouldn’t validate the breakout. For now probability favors the breakout upward slightly moreso. *not financial advice*

Constellation about to see Stars! 45%+ UpsideChart #1/ 40: NASDAQ:CEG 🔋
-Need Bull Flag Breakout at $268
-Need H5 Indicator to flip to Green with breakout
-Volume Shelf Launch to ATH's
🎯 $289
📏 $388
⏳ Feb2025
NFA

NEAR/USDT: READY FOR BIG MOVE!!🌟 Hey everyone! 👋
If you’re finding value in this analysis, don’t forget to smash that 👍 and follow for more high-value trade setups! 💹
🔍 Technical Overview:
NEAR Protocol (NEAR) is showcasing strong bullish momentum! 🚀 It has broken out from a bull flag-like structure, with a successful retest confirming the breakout. The 100MA support is holding firm, signaling a potentially massive rally ahead. This could be the perfect time to accumulate some and add more on dips within the given range!
✅ Buy Zone: $6 - $7
🎯 Targets:
Target 1: $10
Target 2: $22
Target 3: $38
Target 4: $48
Target 5: $62
🛡️ Stop Loss (SL): $4.78
💡 Why NEAR Protocol?
NEAR Protocol is a next-gen Layer 1 blockchain designed for scalability, speed, and developer-friendly applications. It’s built on Nightshade sharding technology, enabling super-fast transactions and low costs.
Key fundamentals driving NEAR’s bullish potential:
1️⃣ Growing Ecosystem – NEAR is home to many dApps, DeFi projects, and NFT platforms.
2️⃣ Backed by Big Names – Supported by renowned investors like a16z and Pantera Capital.
3️⃣ Interoperability – Seamless cross-chain communication with Aurora (ETH compatibility).
4️⃣ Mass Adoption – Rapidly expanding user base and developer activity.
With these fundamentals aligning with strong technicals, NEAR is poised for an explosive rally!
💬 What’s your take on NEAR’s price action? Are you seeing the same breakout potential? Drop your thoughts and analysis in the comments below, and let’s profit together on this exciting trade! 🚀

3 consecutive 1day candle closes abve key triangle top trendlineI wanted to post a daily timeframe close up of the top trendline of the macro time frame green triangle that xrp has been consolidating inside since 2018. We now have 3 consecutive daily candle closes above its top trendline and are working on what looks to be the fourth here. You can tell that it appears to be forming another little smaller time frame bullflag here with the last 5-6 candles which it has already done a couple times as well on the 20 or so candles just prior to those. The triangle pattern is most valid on a monthly chart so we should definitely not get too presumptuous that we have flipped this trendline to permasupport until we have closed 1 monthly candle above it and retested it as confirmed support with the follow up monthly candle. However we are making good progress now as we now officially have 1 weekly candle close above this green top trendline as well —>
I will link the monthly version of this chart below so you can click on that idea as well to get the full perspective of this triangle instead of just a zoomed in look at the daily. Target if breakout confirms in this zone is $3.75. *not financial advice*

Symbotic has broken out and is about to SQUEEZE! 145% UpsideSymbotic NASDAQ:SYM has broken out and is about to SQUEEZE! 145% Upside
- Green on the High Five Setup Indicator
- Bull Flag Breakout held this week
- Sitting on a large volume shelf with a free range above the ATH area.
- 17%+ Short Float
- Wr% has created support in the consolidation box.
Look Left Target: $64
Measure Move (MM): $95
NFA

BTC’s logarithmic bullflag targets on the monthly chart Shown here are the two bull flags that have formed since the last bull market top. Since this is on the logarithmic chart, there’s no guarantee that we can hit any of these breakout targets in the current bull market, however the smallest flags breakout target of around 199k has a much higher probability of being reached in the current bull market than the others. That being said, there is still a chance we could hit one of the 2 potential targets for the 2nd bigger flag, and even hit the highest target shown here as well which is a breakout target from a flag from 2 full bull markets ago that hasn’t yet hit its full target. Considering that logarithmic chart patterns from the higher time frames (monthly and higher) usually tend to take 2 bull markets to be reached so that does slightly raise the probability that we could hit that highest target this bull run as it is 2 bull runs after that flags breakout occurred. This probability is bolstered also by the fact that the bull flag prior to that one only took 2 bull rackets to reach its target as well.Whatever the outcome, I feel fairly confident that if not this bull run we should definitely be able to reach the 280k target by the next bull market and also very likely to reach the highest target by ext bull run as well since then it would be 3 full bull markets since that flag confirmed its breakout. Patterns worth keeping an eye on anyways regardless of how long it takes for them to reach their full targets. *not financial advice*

Bitcoin’s entire history is just a series of bullflag fractalsOn the entire bitcoin history index monthly logarithmic chart we can see how Bitcoin is nothing but bullflags. The second bullflag we broke up from took 2 bull runs to hit its full breakout target. The first one however because of how insanely long its pole is, has still yet to hit its full breakout target. It is now the 4th consecutive bull market since it broke out of the first flag though so perhaps it will reach that target this bull market, if not this market I’m confident the 1st flag will finally reach its full target next bull market. The second bull flag in the fractal series was able to hit its full target within 2 bull markets which is typically about the pace the huge macro patterns on the logarithmic chart tend to take. The other Flags since that second flag also are yet to hit their full targets but if the next flag in the series is also able to hit its full breakout target within a 2 bull market timeframe, the flags after it will also have to hit their targets as well on the way yo hitting that 3rd flags breakout target. We can see each flag seems to be getting progressively smaller as the fractal continues so odds are good the time it takes each flag to reach its full breakout target should also be getting progressively smaller as well so that would make sense. Anyways I just wanted to post a new version of the entire bitcoin history’s bullflag fractal so i could easily reference t and follow its progress for the current bull run *not financial advice*

Getting closer and closer to the bullflag targetsTwo of the biggest patterns bitcoin has broken upwards from this year are both bull flags and they both have a bullish confluence measured move breakout target of around $99,999. The first one that’s been forming the longest from we actually broke upwards from all the way back n February or March, and here is what it looks like: it was all the way back then I knew we would eventually reach this target and it’s extremely satisfying to click play and watch price action go directly to the target. You can see the price target for that one shown at the chart on the top of this page at the top of the dotted purple line. The other big bull flag of this year we only just recently broke upwards from in October, and it has also had beautiful priceaction unfold perfectly shown here: Clicking play on this chart also is amazing to watch it seemingly go up and hit the exact target with the dotted red line acting as a magnet. That same dotted red line can be seen on the chart image above on this current chart idea. Even though on both of those charts it looks like we have already hit the exact target, when you zoom n on the daily time frame here you can see that we came within a whisker of hitting the $99999 target but still have only gotten just below it. IN the process recently we have been consolidating in a rising wedge (as indicated by the diagonal pink trendline) and a rising channel (the ascending red trendline + the dotted red trendline). The rising wedge also can qualify as a bullish pennant and when you factor in the pink flagpole to where price has broken above the top trendline of the wedge, the measured move target for a breakout of such a pennant is around $116k. Rising wedges default mode is to break down instead of up, but in a parabolic bull phase many of them can consecutively break upwards, I do believe at the very least price action will finally reach both the dotted red and dotted purple targets. However, since that was the full target for two of the most pivotal bullish chart patterns of the year that may actually be a good time for it to make a solid correction. We also have the psychological resistance of 100k where many people would likely take profit at which could add to the liklihood of a correction in that range. Usually once price gets this close to a psychological level it tends to hit it so it would not surprise me at all if we hit 100k before the correction, there’s also a chance we could hit the little pennants 16k breakout target before the correction too but if we correct right after 100k, right after the 115-116k target zone, or just above that at the next big resistance area around 120-130k which is the top green trendline of this series of channels on the log chart: My belief is the correction will go down to fill the gap that was created in the CME bitcoin futures chart shown here: . I think it could likely retest that zone right around the 1day 50ma (in orange) rises up to meet that zone. My goal is to wait for a pullback back around there or back to the neckline (in yellow) of the big cup and handle we broke up from just recently, I will look for those levels as potential zones to make any additional entries into the market. The cup and handle has been by far the absolute biggest chart pattern of the entire year, however the channel of the red bullflag is also the handle of the cup and handle. Will be interesting to see how much of the above plays out how I anticipate it will. *not financial advice*

Bitcoin - Last stage of the pump! (sell here and wait 50% crash)Bitcoin is in the last stage of the bull run. Buying Bitcoin at 93,000 is not worth it for the long term because you will be able to buy it cheaper in 2025/2026 at the price around 60,000-50,000. The moon boys are back and everyone is very bullish; that is usually a sign of a cycle top. Bitcoin always moves in significant cycles and is highly volatile. New people don't know it, and their finances get completely ruined with each bearish cycle.
Let's look at the technical analysis. Always start with simple trendlines. We can draw a very nice trendline starting from wave (1) -> wave (3). These 2 points are significant swing highs. This gives us a current profit target of 107,000 USD in December 2024. Next, what we want to do is look for the Fibonacci extension levels. As per Elliott Wave analysis, we are in the last wave (5), You want to draw the fibonacci extension from the start of wave (1) to the end of wave (3) and the second point will be the end of wave (4). This also gives us a profit target of 107,000 USD! This is not random; this is pure skill.
95% of retail traders don't use the Fibonacci extension tool, and among the 5% of users, 95% of them don't know how to use the tool properly. I know how to use it properly with the Elliott Wave theory, as I have been trading crypto for almost 10 years.
Enter a short position at 94,500, first profit target 92,480, second 91,062.
Write a comment with your altcoin, and I will make an analysis for you in response. Also, please hit boost and follow for more ideas. Trading is not hard if you have a good coach! This is not a trade setup, as there is no stop-loss or profit target. I share my trades privately. Thank you, and I wish you successful trades!

SOLUSDT | Marketoutlook Summary:
• SOL/USD Movement:
• Trading within a medium-term descending channel .
• Resistance zone: 157.40–162.50 (23.6% Fibonacci & Murrey ). A breakout above could lead to further growth toward 175.00 and 185.80 (July highs).
• Support zone: If the price falls below 147.60 (central Bollinger Band), it could decline toward 131.25 (38.2% Fibonacci & Murrey ) and 125.00 (Murrey ).
• Technical Indicators:
• Bollinger Bands: Horizontal, signaling consolidation.
• Stochastic: Preparing to exit the overbought zone, indicating a potential sell signal.
• MACD: Increasing in the positive zone.
• Trend Outlook:
• With the long-term downtrend intact, further decline in the near future appears more likely.

BULLISH FLAG - 108K/110K NEXTIllustrated is a close-up view of the bullish flag forming.
Expect one more push to the downside to induce sellers and trap them.
$89,000 - $90,000 should hold as key psychological support AS SHOWN IN MY PREVIOUS ANALYSIS.
--
GOOD LUCK!
