SOLANA – Last Line of Defense🚨 CRYPTO:SOLUSD has completed a 3-wave corrective pullback, testing the April trendline and reaching the equal legs support zone at $175–$160. This area is acting as a potential launchpad for a bounce through the rest of the month.
💥 Can SOL break into new highs, or will this bounce form a lower high, signaling a possible trend reversal?
Bullishpattern

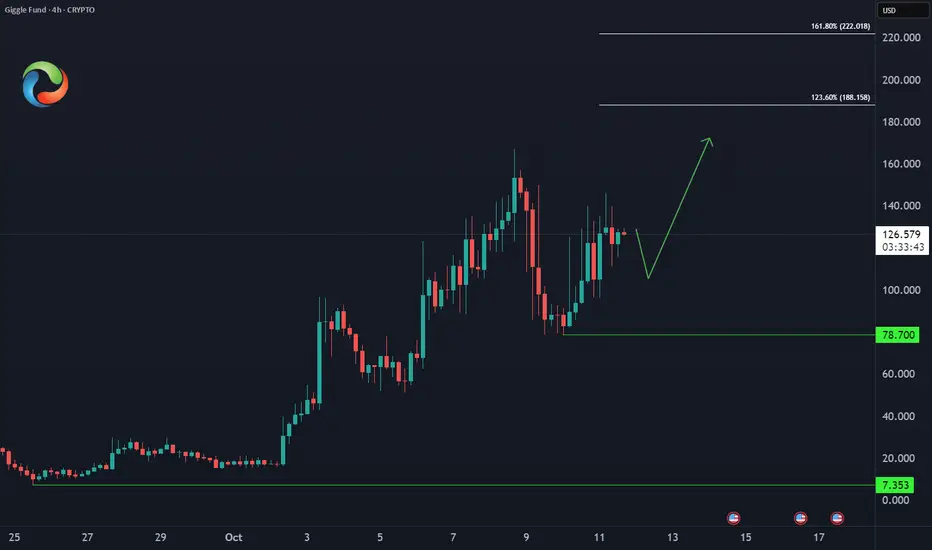
Giggle Fund – Upside Targets📈 As long as BINANCE:GIGGLEUSDT.P holds above yesterday’s low of $78.70, the bullish outlook remains intact. Price is expected to continue pushing higher toward the target zone of $188–$222.
#ElliottWave #Binance
UVIX a lot more love to giveUVIX daily just crossed 50SMA. This is huge and a lot more upside esp. with all the f$ckery taking place. I have been warning on this for a few weeks now and made 20% today. Can easily go up to 30-40. Add SMA9 / Williams % range on 15mins. I have a few more premium, but that should help getting started.

Bitcoin BTC Bullish Setup📈 CRYPTO:BTCUSD reached the equal legs area $118588 - $117260 and it's expected to rally from there looking for new highs next week or bounce in 3 waves at least.
#Elliottwave #Trading

CHR - BULLISH NASDAQ:CHR - bullish setup 📈
Clean pattern breakout & retest.
H4 chart flipped bullish.
I expect to see a 10%+ bull wave from here.

GMDC Breakout Setup: Buy Above 637Entry: Buy above 637 (recent resistance and Fibonacci breakout spot).
Target 1: 673 (Fibonacci 0.382 retracement).
Target 2: 703 (Fibonacci 0.5 retracement).
Target 3: 733 (Fibonacci 0.618 retracement).
Stoploss: 615 (below recent support and trendline).
Volume spike and RSI uptick signal momentum

Perfect Sync: V Reversal Meets Bull Flag
Two clean and classic technical structures:
✅ V-Reversal Formation
✅ Bull Flag – still active and building pressure
After a sharp reversal, the price entered a bullish continuation phase.
Currently moving within the flag structure toward its upper edge.
If we see a breakout to the upside, the move could match the flagpole length, which aligns well with the target from the V-reversal pattern.
📍 Bullish scenario remains valid as long as we stay within structure.
📉 Breakdown below $570 invalidates this setup.
🧠 Important Reminder:
Enter only after a confirmed breakout.
✅ Apply strict risk management
✅ Never risk more than 1% of your capital on a single position.
Everything’s clear. No noise. Just wait for confirmation — let the market come to you.

Corweave multi Billion Dollar Bull Flag deal till 2029 CoreWeave operates AI data centers in the U.S. and Europe, offering access to Nvidia's GPUs, which are highly sought after for training and running large AI models.
The latest order, which requires Nvidia to purchase any unsold capacity through April 13, 2032, builds on an April 2023 agreement.
The amended agreement serves as a backstop for CoreWeave, ensuring that capacity will be leveraged irrespective of the end customer, analysts at Barclays said, adding that the incremental spending by Nvidia is seen as a healthy diversification away from the company's largest customers.
"I see this as a positive for CoreWeave given concerns from investors around the company's ability to fill data center capacity beyond its two largest customers (Microsoft and OpenAI)."
In March, CoreWeave and OpenAI agreed on a five-year contract worth $11.9 billion, under which the New Jersey-based firm provides the ChatGPT maker cloud computing capacity.
The company signed an additional agreement under which OpenAI has committed to pay up to $4 billion through April 2029.

Harmonic Pattern made ...Hello everyone
According to the chart that you can see the price of BTC was completed the harmonic pattern and according to the rules of the classical technical we expect the market after some correction rise up to the PRZ level that we shown and after that we update the analysis.
Be your hero
AA

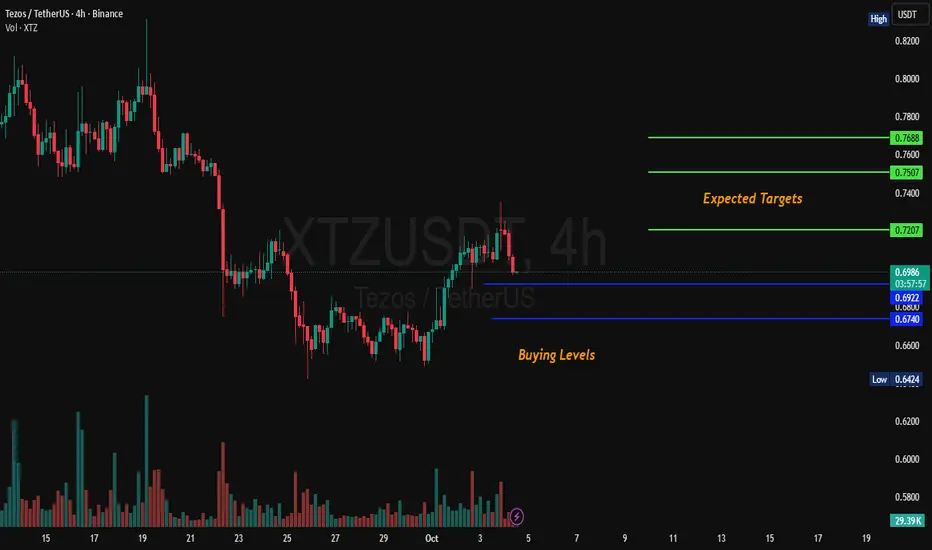
XTZ 4H Analysis XTZ Has started upward momentum. Key buying area are marked as 0.682 & 0.675. Possible targets are also given on the chart. NFA DYOR
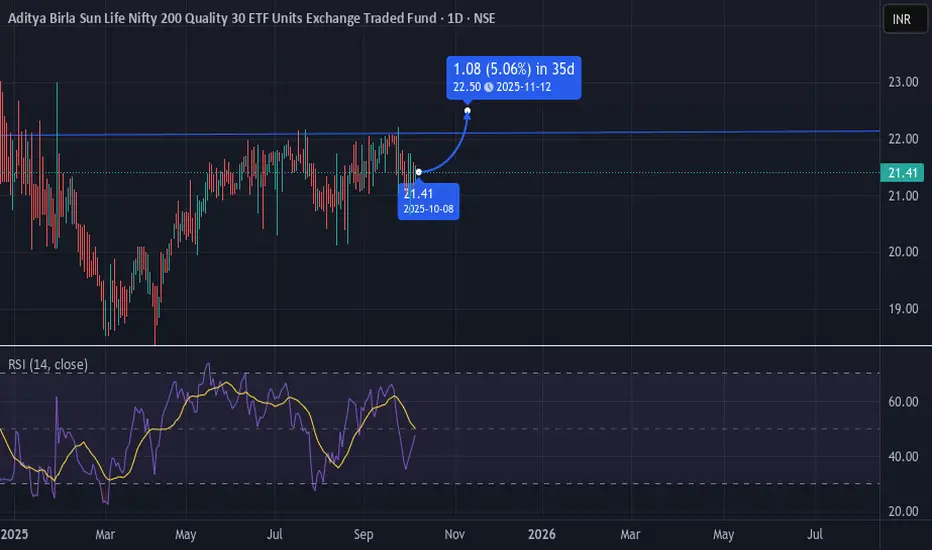
NIFTYQLITY LongNIFTYQLITY near resistance level, if this level breaks good chances of rally up
RSI level looks positive in long term 🟢
MOM30IETF Long positionMOM30IETF near resistance level, if this level breaks good chances of rally up
RSI level looks positive in long term 🟢

ETF ALPHA BullishExpect a short term long position based on RSI levels going strong.
Also tested support level two times.

ETF ALPHAETF BullishMirae Asset Nifty 200 Alpha 30 ETF, represent Nifty 200 Index, as per market condition looks positive. Good for short term.
Long 🟢 position
#etf #trade #India

TRUTH / USDT : Keep a close watch on breakoutTRUTH is approaching trend line resistance with strong potential. A confirmed breakout from this level could trigger a 15–20% bullish move in the short term.
Keep a close watch and always enter only after clear confirmation. Manage risk properly.

#ZECUSDT - Another leg up is aheadWe all saw a massive bullish in zec in previous days out of 260% instant bullish... and now it's in consolidation
it shows a symmetrical triangle pattern in hourly chart with 2 attempts of breakout ... third one must be work
the next station at ( 250 - 280$)
best Regards:
Ceciliones🎯

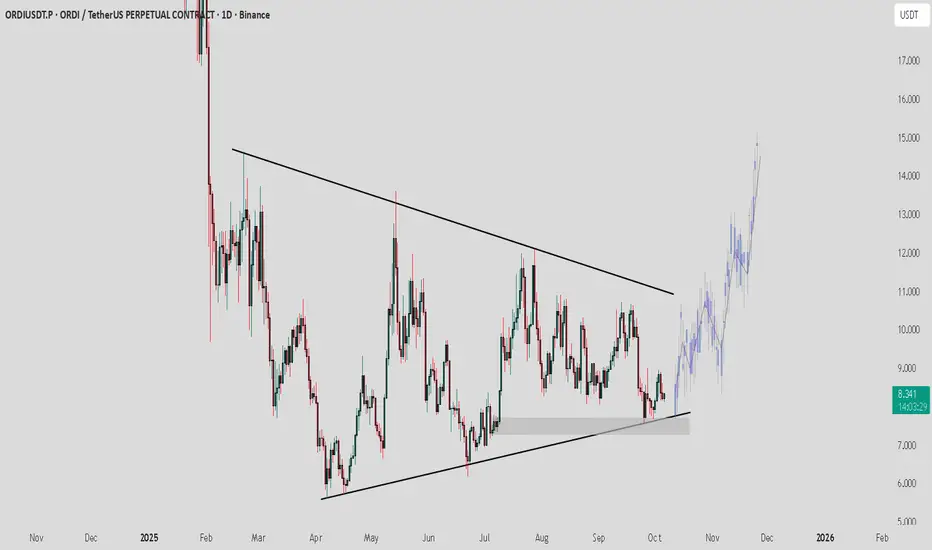
ORDI / USDT : Looking in a good momentum for a rallyORDI / USDT has bounced from strong support and is showing positive momentum. If this strength continues, we could see a bullish move towards $10 – $12 – $15 in the coming days.
Keep a close watch on momentum and manage risk wisely.
NOTE : Breakdown from support will invalidate this setup
REZ / USDT : Approaching Trendline resistance with potentialREZ / USDT is approaching trend line resistance with strong potential. A successful breakout from this level could trigger a bullish rally of 50–60% in the short term.
Keep a close watch and always wait for confirmation before entering. Manage risk wisely.

FET ANALYSIS📊#FET Analysis
✅There is a formation of Descending triangle pattern on daily chart🧐
Pattern signals potential bullish movement incoming after the breakout of the pattern
👀Current Price: $0.600
🚀 Target Price: $0.700
⚡️What to do ?
👀Keep an eye on #FET price action and volume. We can trade according to the chart and make some profits⚡️⚡️
#FET #Cryptocurrency #TechnicalAnalysis #DYOR

CAKE 3D AnalysisHere is an analysis of CAKE on 3 Day time frame. It has broke long term down trendline on 3 Day time frame. We can expect the next targets as expected on chart. NFA DYOR.

CRV / USDT : One strong move will start Massive rallyCRV is breaking out from trend line resistance. A confirmed breakout with strong momentum can open the way for a rally towards $1.00 – $1.15.
Keep a close watch, wait for confirmation, and manage risk wisely.

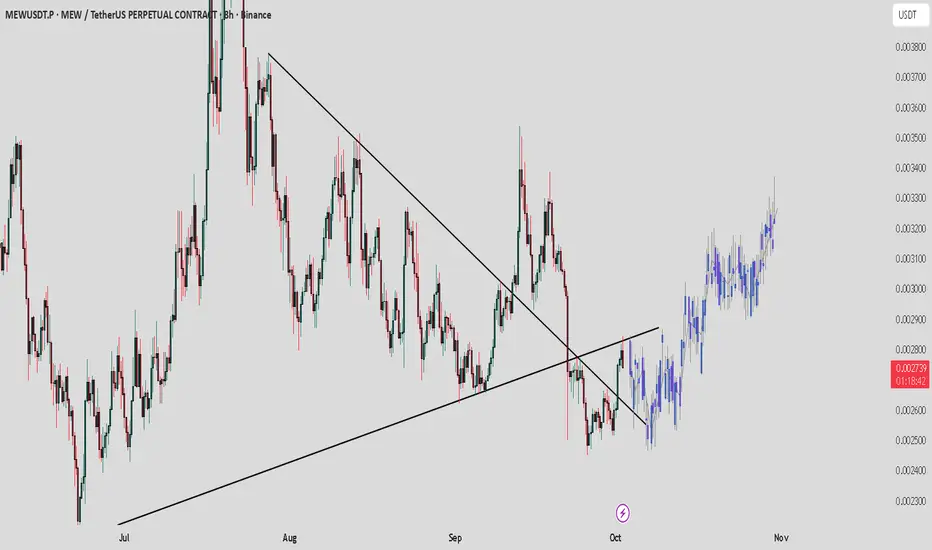
MEW / USDT : Bullish setup , Watching retest for next leg upMEW / USDT Breakout confirmed from the descending trendline. Price is retesting the demand zone, and as long as this support holds, we can expect bullish continuation towards higher levels. Breakdown below the zone will invalidate the setup.
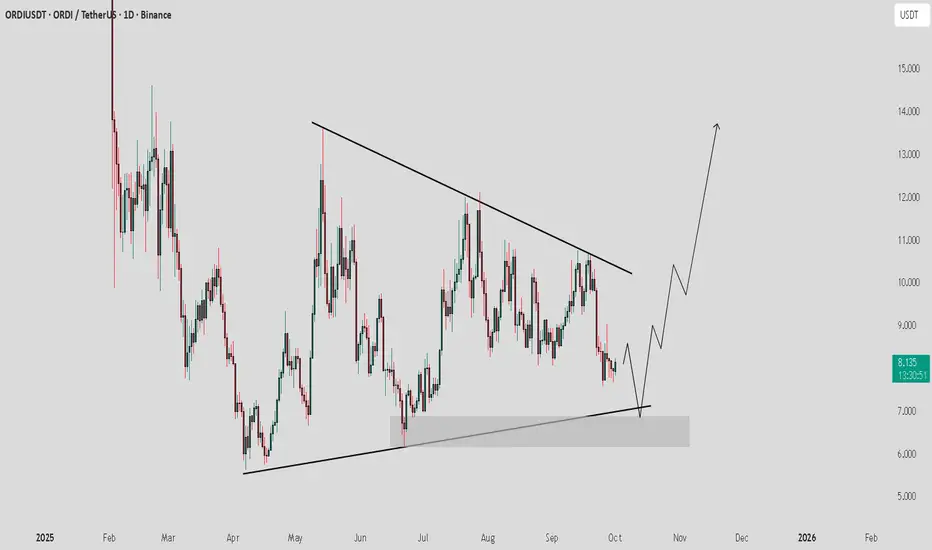
ORDI / USDT : Looking for a price to bounce back from supportORDI is moving towards support for a possible retest. If it holds and we see a bounce, a strong move can follow with breakout targets at $12–$15. The key level to watch is this support – as long as it holds, the setup remains valid. A breakdown below will invalidate the setup.