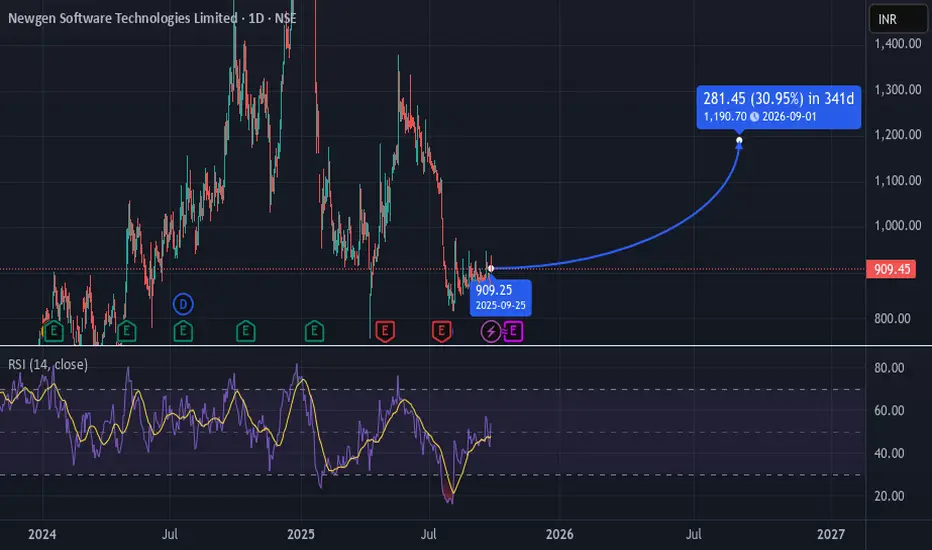
NEWGEN Bullish LongNEWGEN 🟢
EPS for last 3 consecutive years has shown positive growth
Revenue growth is excellent every year
Growth looks promising for next 1 year
Company is almost debt free
Bullishsetup
#MARA NASDAQ:MARA
MARA is poised to go higher potentially towards $50 as the first target and onto 150+ in the next few years if bitcoin continues to break higher highs. Its only a matter of time before the miners start to catch up as the revenues would grow significantly and with green energy initiatives these companies can really go above and beyond in the future.

GOLD (XAU/USD) – 4H: Triangle Breakout Play Toward 3850–3900Hello traders,
I’m watching Gold closely as it appears to be consolidating inside a descending triangle pattern (highlighted in purple), with key support/resistance levels clearly marked.
🔹 Current Setup:
Price is testing the lower boundary of the triangle near $3,700.
We’ve seen multiple rejections at the upper resistance (~$3,760–$3,780), forming lower highs — classic triangle behavior.
The recent dip to point C held strong, suggesting buyers are stepping in at this zone.
🔹 My Thesis:
I believe price will respect the triangle structure and bounce off the lower trendline, then surge upward toward the $3,850–$3,900 range — potentially breaking above the triangle’s upper resistance (red line) with momentum.
🎯 Why This Makes Sense:
✅ Volume & momentum indicators (QQE MOD below) show bullish divergence forming.
✅ Previous swing high at B ($3,780+) acts as psychological resistance — a breakout here could trigger FOMO buying.
✅ The triangle is nearing its apex — meaning a breakout (up or down) is likely soon. I’m betting on the upside given macro backdrop (Fed pause expectations, geopolitical risk).
⚠️ Risk Management:
Stop loss: Below $3,680 (below triangle support).
Target 1: $3,850 (previous consolidation zone)
Target 2: $3,900 (next psychological level + Fibonacci extension)
📌 Watch for: A bullish engulfing candle or RSI crossover above 50 to confirm the reversal.
Let me know what you think — are you long, short, or waiting for confirmation?
#Gold #XAUUSD #TechnicalAnalysis #TradingView #TrianglePattern #Breakout #Forex #Commodities #TradeSetup
✅ Pro Tip: Add your username or handle (@raheel007khan) at the top or bottom to build your brand. You can also add “Follow for more setups” to grow engagement.

Dogecoin DOGE – Extreme Buying Zone in Play🚀 CRYPTO:DOGEUSD has pulled back into the equal legs area at $0.23–$0.22, right inside the uptrend channel from June, and is now forming a higher low, a classic setup for a bullish reaction.
If momentum kicks in here, this could mark the beginning of the next impulsive leg, with potential to break above $0.30.
Eyes on the meme king this zone could be the launchpad.
#ElliottWave #MemeCoins #ALTSEASON

Litecoin LTC – Bounce Setup in Play📊 CRYPTO:LTCUSD has completed a corrective move into the equal legs zone at $102–$97, aligning with the April uptrend channel—a classic Elliott Wave support confluence. This area is primed for a bullish reaction, with buyers likely stepping in to fuel the next leg higher.
🎯 With bullish structure intact, the next upside target within this cycle is projected at $147, marking a potential Wave 5 extension.
#ElliottWave #Altcoins

CADJPYLong Calll
D. Bottom Structure Bouncig from support
Bullish .DIV
Manage risk Book profits timely

SOXL 1D — With a base like this, the ride’s worth itOn the daily chart of SOXL, since early March, a textbook inverse head and shoulders pattern has formed and is now in its activation phase. The left shoulder sits at $16.67, the head at $7.21, and the right shoulder at $15.11. The symmetry is classic, with volume stabilization and a narrowing range — all the elements are in place.
The key moment was the breakout through the descending daily trendline around $19.00. Price didn’t just pierce the level — it held above it, signaling a phase shift. There was an attempt to break through the 0.5 Fibonacci level at $19.60, which led to a pullback — not on heavy selling, but on decreasing volume. This wasn’t a rejection, it was a pause.
This pullback serves as a retest of the breakout zone and the 20-day moving average. The overall structure remains bullish: price stays above all key EMAs and MAs, RSI climbs past 60, and the candlestick structure is stable. Volume rises during up moves and fades during pullbacks — classic signs of reaccumulation.
The measured target from the pattern is $32.00, calculated from the head-to-neckline height projected from the breakout point. As long as price holds above $18.40, the setup remains intact. A break above $19.60 with confirmation would open the door to acceleration.
This isn’t a momentum play — it’s a setup months in the making. The structure is there, the confirmation is there, and most importantly — the price behavior makes sense. With a base like this, the ride ahead looks worth taking.

DOT - Confirmed!DOT Technical Outlook
On the weekly timeframe, DOT has confirmed a breakout from its long-term downtrend, followed by a successful retest. This establishes a solid technical foundation, with confluence now forming between the weekly and daily structures.
On the daily chart, price action has moved decisively above the previous bearish zone, signaling renewed momentum. In the short term, the key resistance levels to monitor are $5, $6, and $8. A sustained breakout above these thresholds would provide confirmation for a broader bullish scenario.
From a technical perspective, the upward trend has been validated. The next catalyst for continuation will likely come from upcoming market developments and potential positive news flow, which could act as triggers to remove remaining resistance barriers.
Overall, the technical setup suggests that DOT is positioned for further upside, with a constructive outlook in the near to medium term.

ONDO Retest Setup – Spot Long Opportunity from SupportText (Description):
ONDO has been extremely bullish over the past few days, breaking out of a key resistance zone and showing strong momentum. Now, price is now retesting the breakout level, which could act as support — a classic continuation setup for a spot long entry.
🔹 Entry Zone: $0.98 – $1.00 (Support Retest)
🔹 Take Profit 1: $1.10 – $1.25
🔹 Take Profit 2: $1.40 – $1.55
🔹 Stop Loss: Below $0.95
🔹 Risk/Reward: Favorable setup based on trend continuation
#ONDO #Crypto #SpotTrade #SupportResistance #BullishSetup #TradingView #CryptoAnalysis #PriceAction

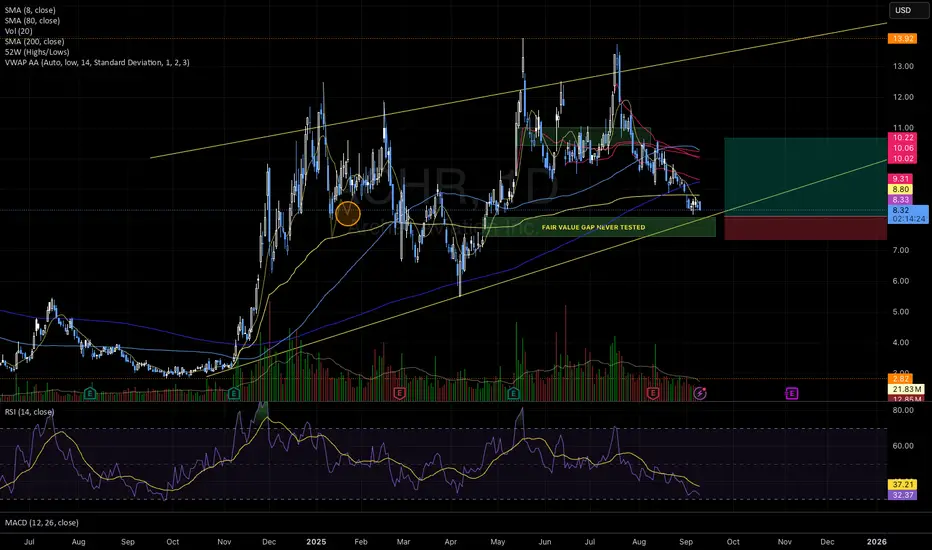
Bullish Setup Forming: Approaching Untested FVG + Oversold RSIACHR is setting up for a potential bounce based on multiple confluences:
Price is heading straight into a fair value gap that was never tested — could be a solid bounce spot;
Daily RSI is oversold (~32), often a sign the move down is stretched;
It’s also right on top of a rising trendline that has held for almost a year;
Volume is drying up, which might mean sellers are losing steam;
🎯 First target: $10.91
🏁 Final target: $12.00
❌ Stop-loss: just under the FVG zone, in case it breaks down.
Watching closely 👀
And remember: respect both your stop loss and position sizing.
Elliott Wave Analysis: Balkrishna Industries LimitedHello friends,
Welcome to RK_Chaarts,
We're analyzing the chart of Balkrishna Industries Limited from the perspective of Elliott Waves.
Here's what we've observed: we've completed Primary Degree Wave ((3)) in Black at the peak of August 2024. Following that, we've witnessed a complete bearish and sideways movement, culminating in the low of April 7, 2025, which marks the end of Primary Degree Wave ((4)) in Black.
We've now initiated Wave ((5)) in Black, which should unfold as five Intermediate Degree subdivisions (1) to (5) in Blue. Furthermore, within Wave (1), we should see 1,2,3,4,& 5 Minor Degree subdivisions in Red. As we can see, we've marked Red Wave 1 as complete, and Red Wave 2 is almost complete.
According to Elliott Wave Theory, Wave 2 has retraced less than 100% of Wave 1, which is a valid point. Our invalidation level will be the low of Wave ((4)) in Black at 2150.
Since April 7, the price has made an impulsive move upwards, forming a high on May 9, 2025. We've labeled this as Minor Degree Wave 1 (in red). Within Wave 1, we've identified a lower degree, Minute Degree (in black), with subdivisions ((i))-((ii))-((iii))-((iv)) & ((v)).
Following Wave 1, a corrective move has unfolded in a 3-3-5 structure, specifically a flat correction. We've labeled this as Wave 2. If the price doesn't break below the low of Wave ((4)) (2150), and instead forms a higher high, it will increase the likelihood that our wave count is correct. However, if the price makes a lower low, it will introduce a doubtful scenario.
We've observed that Primary Degree Wave ((3)) in Black, which we identified at the top, has led to a corrective fall in Wave ((4)) in Black. Within Wave ((4)), we've labeled an Intermediate Degree (W)(X)(Y) correction (in blue) with subdivisions. This can be classified as a Double Three pattern.
Furthermore, within the (W) correction, we've identified another Minor Degree WXY pattern, and within the (X) wave, another WXY pattern. The (Y) wave has an ABC minor pattern. Additionally, we've noticed a slanting resistance trend line, which has been broken with the arrival of Wave 1.
Given the significant decline in price, market sentiments have likely contributed to the unfolding corrective structure. If the price forms a higher high, it will increase the likelihood that our potential Elliott Wave count is correct.
Elliott Wave analysis is always like solving a puzzle, requiring us to unfold the structure and make educated guesses about the emerging pattern. If the price breaks below the Wave ((4)) low 2150, our wave count will likely change. Until the price remains above this invalidation level, we'll continue to follow this wave count. If the price crosses the Wave 1 high, we'll have full confidence in this wave count.
In this study, we've applied Elliott wave theoretical structures to identify a potential scenario. However, markets can be unpredictable and may surprise us at any time, leading to new scenarios emerging.
The information, chart, and study shared in this post are solely for educational purposes. Our goal is to demonstrate how we plot market movements and make informed forecasting about future trends using Elliott Wave theory. If our predictions prove accurate, we can refine our wave counts accordingly. Conversely, if our predictions are incorrect, we will need to adjust our wave counts.
Please note that this analysis is not investment advice, and you should always consult with a financial expert before making any investment decisions.
I am not Sebi registered analyst. My studies are for educational purpose only.
Please Consult your financial advisor before trading or investing.
I am not responsible for any kinds of your profits and your losses.
Most investors treat trading as a hobby because they have a full-time job doing something else.
However, If you treat trading like a business, it will pay you like a business.
If you treat like a hobby, hobbies don't pay, they cost you...!
Hope this post is helpful to community
Thanks
RK💕
Disclaimer and Risk Warning.
The analysis and discussion provided on in.tradingview.com is intended for educational purposes only and should not be relied upon for trading decisions. RK_Chaarts is not an investment adviser and the information provided here should not be taken as professional investment advice. Before buying or selling any investments, securities, or precious metals, it is recommended that you conduct your own due diligence. RK_Chaarts does not share in your profits and will not take responsibility for any losses you may incur. So Please Consult your financial advisor before trading or investing.

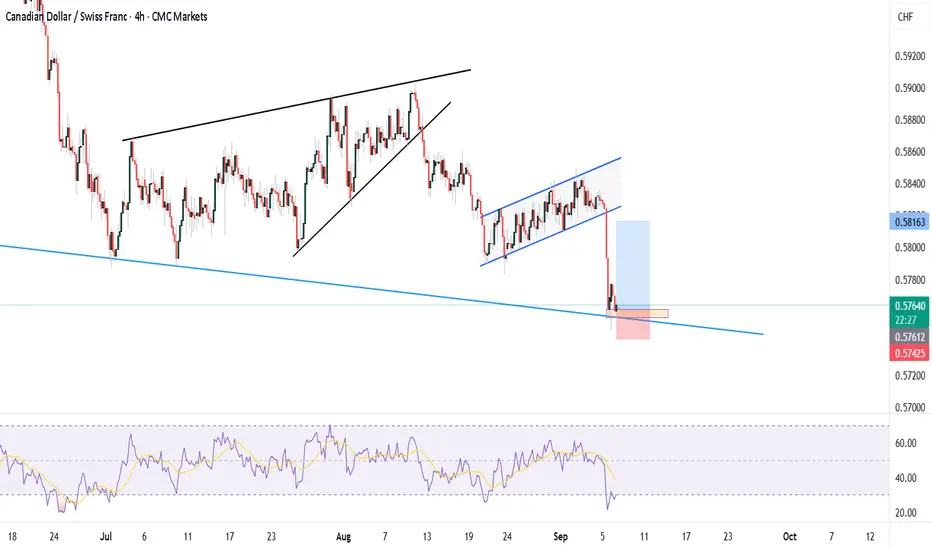
CADCHF BUY TRADE IDEACADCHF Price is currently at the lower trendline after a bearish trend. The RSI level is at 30.09, which represents the oversold level. Based on these conditions, my anticipation is a bullish trend from the current price.
DOT - Loading!!!DOT Technical Analysis & Market Outlook September 2025
In May 2025, DOT’s price decisively broke out of the long-term weekly downtrend, followed by a successful retest in June 2025.
However, despite the anticipation of many investors, the market entered a sideways consolidation phase instead of delivering an explosive breakout.
I have also been patiently waiting for this breakout, though that patience has been increasingly tested. To refine my outlook, I shifted to the daily timeframe in search of confirmation on a smaller scale, closely monitoring for a breakout signal. Yet, the trading session on September 7, 2025, despite notable volatility, failed to produce a decisive breakout.
That said, I am not discouraged. On the daily chart, although the price faced strong rejection on September 7 and the attempt to break higher encountered resistance, the structure still suggests that once this barrier is cleared, a breakout is imminent—likely within just a few sessions.
From a technical standpoint, the bullish trend is clear. What remains is the alignment between the daily and weekly structures to ignite a strong move. Historically, such technical confirmations are often catalyzed by major news or events. After reviewing both the fundamental catalysts and potential risks, I outline three primary scenarios for DOT in the near term:
🔮 DOT Price Scenarios (Q4 2025)
🚀 Bullish Scenario (30%)
JAM Upgrade launched successfully with no major technical issues.
Polkadot Hub + Asset Hub attract leading dApps (DeFi, NFT, Gaming).
Bitcoin maintains its post-halving uptrend.
Institutional capital flows in via the Polkadot Capital Group (PCG).
Projected Price: $33 – $52 (Moon case)
⚖️ Neutral Scenario (45%)
Roadmap delivered on time, but no standout dApps emerge.
Altcoin market rises modestly, yet capital remains concentrated in BTC & ETH.
DeFi and DOT staking adoption grows, but fails to trigger mass adoption.
Projected Price: $8 – $12 – $22
🐻 Bearish Scenario (25%)
JAM or Elastic Scaling delayed or faces critical bugs.
Liquidity exits altcoins; BTC dominance rises sharply.
Regulatory pressure (DOT potentially classified as a security).
End-of-cycle profit-taking pressure from investors.
Projected Price: $4 – $6
📌 Conclusion
Regardless of the scenario, it is increasingly clear that DOT has already established its bottom. The key question now is not if but when the breakout will arrive—an event that could align with the “Moon scenario.”
I hope this analysis provides valuable insights and supports your investment decisions.

NCCi Observed these Levels based on Price Action and Demand & Supply which is my own Concept "PENDAM CONCEPTS"... Please don't take any trades based on this chart/post... Because this chart is for educational purpose only not for Buy or Sell Recommendation... Thank Q

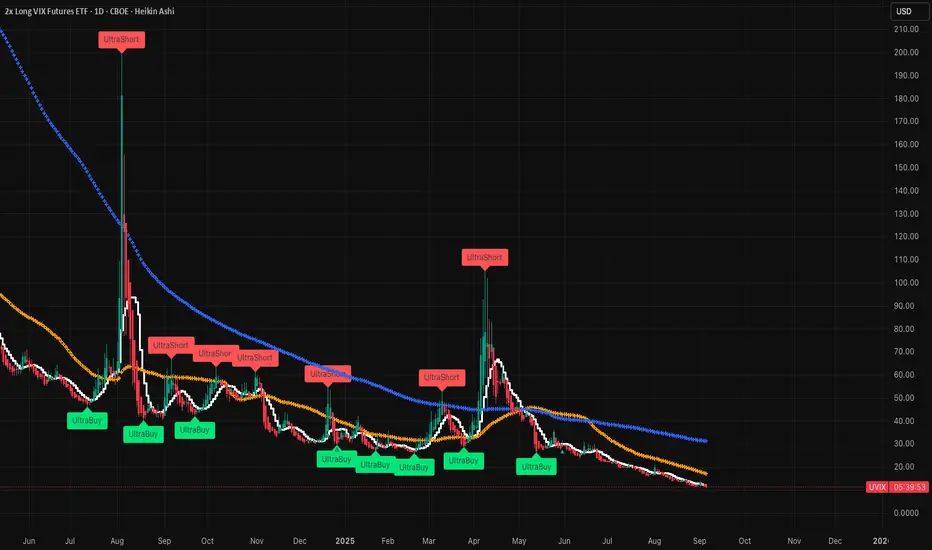
Potentially a nice upside to VIXHorrible jobs report and no clear sign that things will get better make it a great recipe for the VIX (UVIX) to spike. The glimmer of light from cutting interest rates likely won't make a dent in the economy. It's too little TOO LATE! A massive correction needs to happen and PE / CAPE ratios show that the stock market is the most expensive it has every been. I've seen many people get wiped out, always read the signs....
SYRUP ANALYSIS🔮 #SYRUP Analysis - Update 🚀🚀
💲 We can see that there is a formation of Falling Wedge Wedge Pattern in #SYRUP and we can see a bullish movement after a good breakout. Before that we would see a little retest and and then a bullish movement.
💸Current Price -- $0.4800
📈Target Price -- $0.5900
⁉️ What to do?
- We have marked crucial levels in the chart . We can trade according to the chart and make some profits. 🚀💸
#SYRUP #Cryptocurrency #Breakout #DYOR

ANYONE – Zigzag Correction in PlayCRYPTO:ANYONEUSD is unfolding a classic 3-swing Zigzag structure from the recent peak, now entering the equal legs zone at $0.51–$0.43.
This Fibonacci-based support area is where buyers typically step in, setting the stage for a reaction higher either a corrective bounce or the start of a new bullish leg.

NEAR – Double Correction Setup Near Protocol CRYPTO:NEARUSD is currently pulling back from its July peak, unfolding within an #ElliottWave Double Three (WXY) structure.
Price is now approaching the equal legs zone at $2.26–$2.07, a key area where a bounce is expected this month.

EURAUD BUYEURAUD just swept liquidity and tapped into the H4 FVG zone, giving us a potential long bias.
After confirming the higher-timeframe setup, we zoomed into H1 where a clear CHoCH appeared.
Now I’ll be looking for a long entry if price retraces lower into my area of interest.
Let’s see how this plays out—stay tuned! 🚀

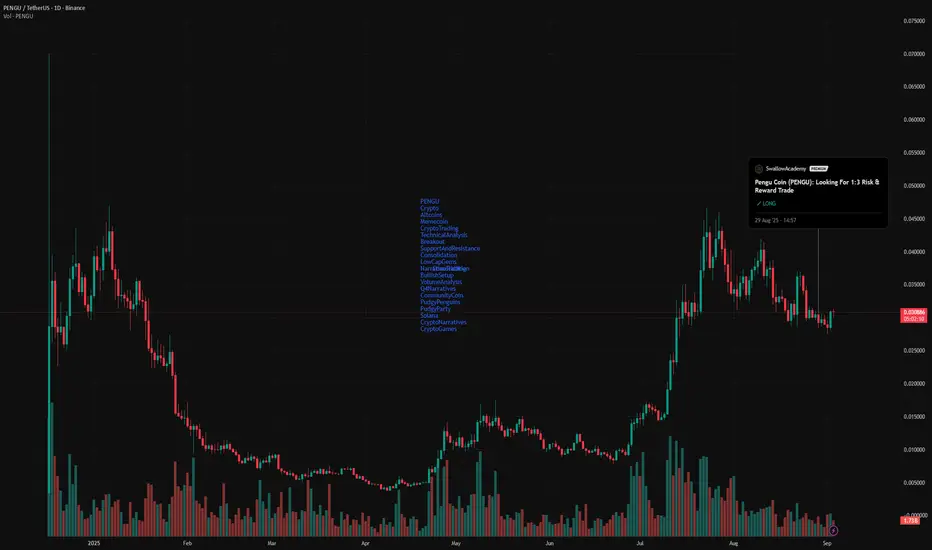
Is $PENGU about to send?TL;DR
Pengu is holding up strong around $0.030 after a big run-up. It’s been consolidating here for a bit, and it’s starting to look like we might be gearing up for the next leg. Plus, the community is super active, and there’s a lot going on behind the scenes.
So what’s Happening?
Price is chilling around ~$0.030
Strong support holding at $0.029 and I've seen multiple bounces there
Had a big run-up to $0.07+, followed by a healthy cooldown
Currently in a classic consolidation phase
Volume looks solid buyers stepping in under $0.030 every time
Why Are People Still Bullish?
Pudgy Penguins just sponsored a NASCAR team. Actual race cars with penguins on them.
The Pudgy Party mobile game is blowing up. On-chain interactions, tournaments, great reviews, and people are actually playing.
X (Twitter) is full of believers stacking more at these levels. The meme game is strong, but so is the real use case stuff.
Some guy even said this in a post:
“In a few months we’ll laugh at these prices.” He might be right.
If you're thinking of jumping in, here’s a simple setup, but always do your own research first:
Buy Zone: $0.030–$0.031
Take Profit: First target at $0.036, second target around $0.045
Stop Loss: ~$0.028
Good risk/reward if you think the sideways chop is ending soon.
Final Thoughts:
Pengu has meme energy, but it also has a growing ecosystem. Between the mobile game, the merch, the community, and real brand exposure.
You don’t have to ape, but if you're watching this one… stay close. This penguin could be heating up!
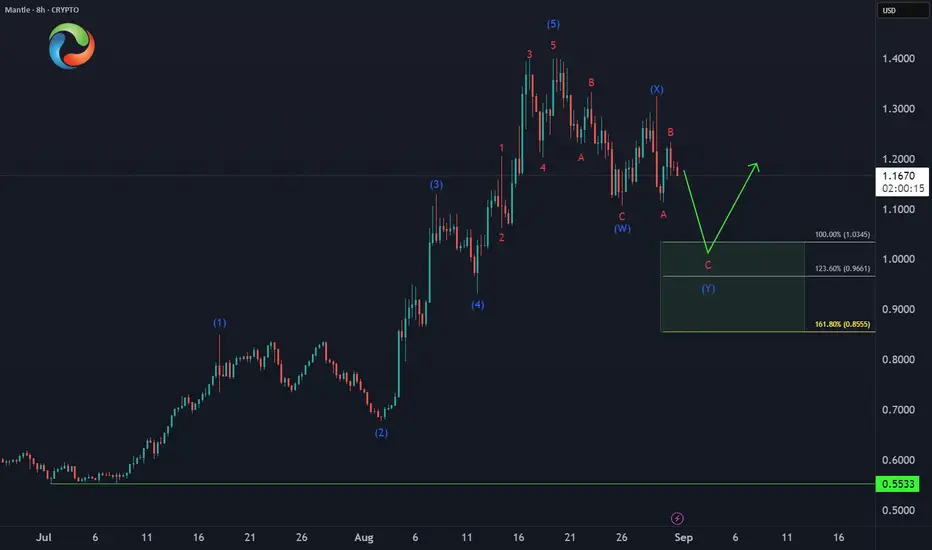
MANTLE Next Buying Opportunity Setting Up📊 CRYPTO:MNTUSD is unfolding a double three correction, and if price reaches the equal legs zone at $1.03–$0.85, it could offer a high-probability entry for the next bullish leg.
XRP Next Extreme Area to Watch📉 CRYPTO:XRPUSD correction from the July peak is unfolding as a double three structure, with price still likely to test the $2.5–$2.2 zone before bulls return.
This area aligns with key Fibonacci symmetry and prior support, making it a potential launchpad for the next leg higher.
Let the structure complete then watch for confirmation.

Indecision and Potential StallingHi Traders!
GBPUSD is telling me indecision right now. When mapping out my trading plan I'm seeing price recently made a higher low on the weekly, dipped into a Daily Order Block, and currently testing the 1.36000 neckline. However, unless GBPUSD closes above 1.35200, retests with continuation, this looks like consolidation. Alerts set, and waiting for some more confirmation right now.
Key levels:
Bullish breakout- Close above 1.35200.
Bearish caution- Break below 1.34600/1.34500.
*DISCLAIMER: I am not a financial advisor. The ideas and trades I take on my page are for educational and entertainment purposes only. I'm just showing you guys how I trade. Remember, trading of any kind involves risk. Your investments are solely your responsibility and not mine.*
