Bullsetup

eurusd leaving range trading for long-term bullsas we can see eurusd is trading higher after 126 days.
only IF today's candle closes above 1.20(because of strong resistance) we can go long after small pullback.
we had nice breakout of the range.
recommending long. (BUY LOW!)
euro going to the last high (red resistance)

USDCAD 120pips LONGwe can see that the price pulled back
for a moment now it is time for long.
20-day moving average *support*
the price near support and stoch rsi
signaling bottom.
so let's see what we can get.
Happy trading !

Nasdaq going up through 50-day moving averageChart looks like Nasdaq has had a hard dip but now recovering. I would prefer a little bit more up before confirming that BULLs are back. Also new 2.2 trillion aid package seems to be on the way,
this will serve as a new catalyst.
If NASDAQ ticks up a bit more it would be a good buy signal.


GBPJPY LONGLooking for continuation long, GBP pairs have been on fire this last week. I have two positions in prof, just added a final position on this. The trend does appear to remain bullish, I believe it will smash through the last daily high, especially if the JPY GDP is reported at the contracted rate that is expected.
🙂 good luck

AUDNZD LONGLooking for continuation long, price looks like it’s ready to break out of the flag. Bullish bias on all time frames.
Good luck 🙂

CADJPY LONGPin bar on 4H. Bullish bias on most time frames. Price has fallen to the daily key level, similar to where we entered this pair last time. This should be a good entry !!
Good luck 🙂

LTC S0 far from ATH!Litecoin is simply so far from its all time high, there was a TD Buy confirmation on the Daily this week, just wanted to give some perspective with this chart and keep it simple- if it does truly rally- the rate of return potential is extremely high.
-Megalodon (Rahim)
BINANCE:LTCUSDT BINANCE:LTCBTC COINBASE:LTCUSD

AUDJPY LONGPrice has fallen back to the daily trend line. I can see a bullish bias forming on the 4H + bullish divergence on 1H.
Goodluck :)

Wow, my trading buddy found us another potential cup&handle NASDAQ:PENN
We have a potential massively bullish play here. If it can close above $38 soon then we could see a massive run! I'm anxiously waiting to see if it will confirm. If it takes too long then it won't be valid.

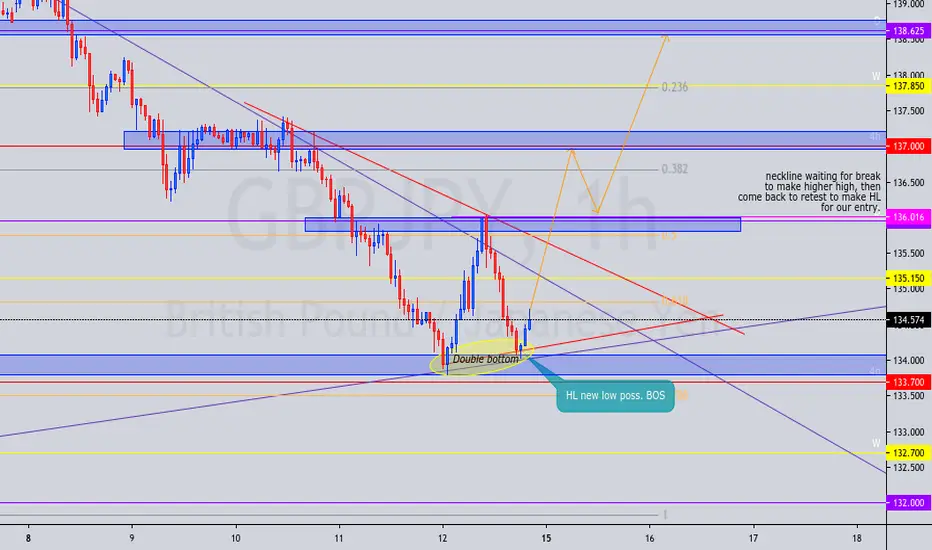
BEARS incoming to create a HL for us to BUY for 75+ pips.#TellMeWhatYouSee What do yall see tell me if we have different opinions.

GBPJPY analysis BULLS COMING TO TOWN!This is what I am looking to see happen this coming week in the market.

Long $Psec , just dipped ! good buy nowWhat is the support and resistance for Prospect Capital (PSEC) stock price?
PSEC support price is $5.03 and resistance is $5.39 (based on 1 day standard deviation move). This means that using the most recent 20 day stock volatility and applying a one standard deviation move around the stock's closing price, stastically there is a 67% probability that PSEC stock will trade within this expected range on the day.
RSI indicating a buy signal as well!
prediction: 5.50 near end of the week.
hopefuly stock can break resistance.
I will buy some stocks now at 5.08cent and hope it goes to 5.50!

#Analisa USDCAD Naik#Analisa USDCAD Naik
Selengkapnya bisa dilihat pada chart
Jangan lupa untuk share ke rekan traders yang lain untuk saling berbagi analisa dan pandangan terhadap pasar.
Tradevelling
Trading jalan, kita jalan jalan
Disclaimer tanggung jawab di serahkan kepada masing masing individu
_____________________________________________________________________

AEM, BULLISH/BEARISH SCENARIO/ POSSIBLE SCENARIOIf you like this idea please show support with a like. I do not advise taking any of my trades, because of the risk. I am not a financial advisor and i am not responsible for any of your losses / profits. This analysis is purely for entertainment purposes and represents an idea what could possibly happen with the direction of the stock.
If you have any kind of questions please ask, i would love to answer you all.
If you want to learn more message me.

#Analisa GBPCAD Naik#Analisa GBPCAD Naik
Selengkapnya bisa dilihat pada chart
Jangan lupa untuk share ke rekan traders yang lain untuk saling berbagi analisa dan pandangan terhadap pasar.
Tradevelling
Trading jalan, kita jalan jalan
Disclaimer tanggung jawab di serahkan kepada masing masing individu
_____________________________________________________________________

EURUSD Possible Short Term Rebound/Retracement UpwardRemembered this chart from my older idea? No much changes from the technical point of view but things do change around beyond technical and I just want to tell my good folks that I am a guy who go with the follow. Kinda like trend following trader you can take but I don't mean the overall reversal of trend on this major pair but just the personality I got during trading. It will be a foolish word to just say overall trend reversal as things need time to fully confirm the actual fact and it's not right time to say a pure reversal or not but I can say for now bearish have been weakening and we can see a slight retracement around 38.20% Fibonacci retracement level at least. If better who knows 50% can also be possible but the price will need to break the weekly pivot point level plus breakout beyond the falling trendline (red). Thanks for reading my idea and I hope you enjoyed and if you think it added some value in your trading don't forget to support me by hitting a thumbs up button! (LIKE)

#Analisa EURCAD Naik#Analisa EURCAD Naik
Selengkapnya bisa dilihat pada chart
Jangan lupa untuk share ke rekan traders yang lain untuk saling berbagi analisa dan pandangan terhadap pasar.
Tradevelling
Trading jalan, kita jalan jalan
Disclaimer tanggung jawab di serahkan kepada masing masing individu
_____________________________________________________________________

#Analisa GBPUSD Naik#Analisa GBPUSD Naik
Selengkapnya bisa dilihat pada chart
Jangan lupa untuk share ke rekan traders yang lain untuk saling berbagi analisa dan pandangan terhadap pasar.
Tradevelling
Trading jalan, kita jalan jalan
Disclaimer tanggung jawab di serahkan kepada masing masing individu
_____________________________________________________________________

#Analisa EURUSD Naik#Analisa EURUSD Naik
Selengkapnya bisa dilihat pada chart
Jangan lupa untuk share ke rekan traders yang lain untuk saling berbagi analisa dan pandangan terhadap pasar.
Tradevelling
Trading jalan, kita jalan jalan
Disclaimer tanggung jawab di serahkan kepada masing masing individu
_____________________________________________________________________

#Analisa GBPCAD Naik#Analisa GBPCAD Naik
Selengkapnya bisa dilihat pada chart
Jangan lupa untuk share ke rekan traders yang lain untuk saling berbagi analisa dan pandangan terhadap pasar.
Tradevelling
Trading jalan, kita jalan jalan
Disclaimer tanggung jawab di serahkan kepada masing masing individu
_____________________________________________________________________
