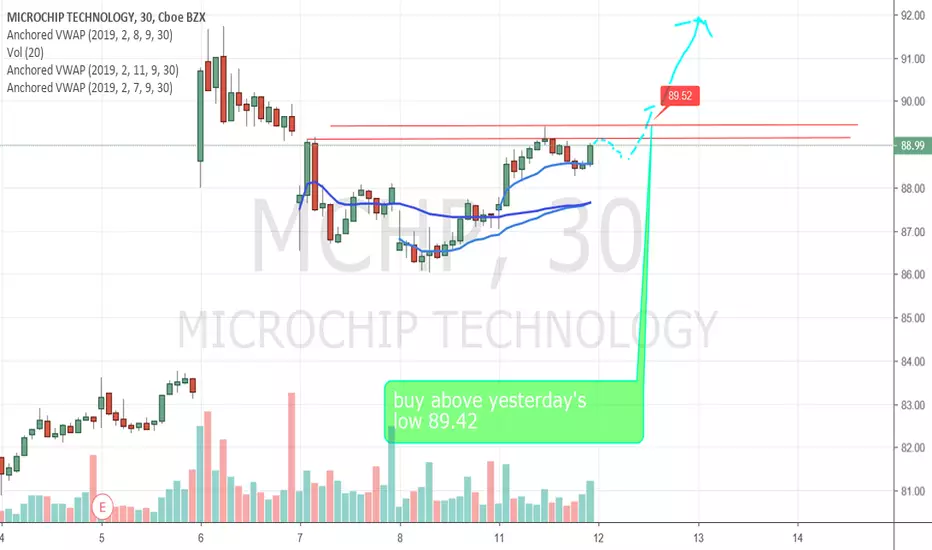
***nice long setup***buy above yesterday's low 89.42
Please like, comment and follow if you like my ideas. THANK YOU!!!
Please note that this information is not a recommendation to buy or sell. It is to be used for educational purposes only.
Bullsetup

XRP/USD Founder Criticism After 16 days of lower lows, XRP prices are steadying, gaining in the last day and just 1.4 percent down from last week’s close. Though this is overly positive for investors –because it confirms our previous XRP/USD trade plan, we need to see spike in participation.
From candlestick arrangement we shall recommend bulls once there is a clear break and close above 40 cents—our minor resistance line and buy trigger line. It’s easy to see why. Notice that after 17 days of draw down that saw prices did from 60 cents to spot prices, XRP prices risk dropping below 30 cents and 25 cents erasing gains of Sep 2018 and binning our forecast.
But, in the last three weeks, there has been rejection of lower lows causing bulls to slow down thanks to the long lower wick hinting of increasing demand in lower time frames.
Of note in this time frame is Nov 25 pin bar. After a week of strong bears, prices did find support and since then XRP/USD has been oscillating within its high low.
For bears to dominate then we need to see clean breakouts below Nov 2018 lows. Then and only then shall we recommend shorts with first targets at Sep 2018 lows and later 15 cents or lower.
Conversely, injection of bulls that ignites a rally above 40 cents shall trigger aggressive traders into action. When that prints, then bulls should buy on dips with first targets at 60 cents.

CHFJPY Long Trade - Final Push to 118.55Price has been respecting its 4 hour bullish trend line.
We have had two selling off phases which have resulted in another leg higher.
Providing this trend line is not broken, we can look to trade this pair to the key level of 118.55 which was the last turning point on the Daily Chart.
This is a case of follow the trend.
1% risk and 4% return.

NLST has bottomed! Netlist has finally bottomed and the bulls are back. As you can see, the down trend is losing its momentum, strong support at .10 and .40, and we have a triangle formation which all points to an upward break out.
I'm excited to see how next week plays out!

VERGE (XVG)TIME FOR A CHANGE? Bears in control but for how long?VERGE ( XVG ) has been in deep fall for the last months, huge drop on the price and the general Cryptos market situation doesn't really help, but there might be some rumours of improvement on the price, here's a possible quick trade idea, using the 4 hours charts and the daily combined we have notice some signals..
We see a supporting ascending line starting on the 14th august that could indicate a top bottom , it did take advantage on the oversold situation on the day and recover to a price to a 278 satoshi on the 2nd sept, at the time of writing the price is been 3 days red (214satoshi), that could create support and bring the price to recover back to the 278 satoshi area, is also possible the continuation on the RSI oscillators to bring again the volume up and aim to targets on the 350 satoshi in the next weeks, the great picture on the long run might be different, expect some resistances and possible drops if the conditions changes in the next days.
If the support line will be broke, expect a huge drop, we recommend to look to this level and set your stop loss accordingly.
Hope this will inspire some new ideas, don't forget to hit the like/follow button if you feel like this post was helpful, that's the best way to support us and our work.
Happy trading days
C-Monkeys

Catching the PIPs in the bars FX:GBPUSD Description
GBP/USD shows great support with DeMarker (DeMarker used as replacement for RSI and Slow Stoch)
MACD and MACZVWAP indicator shows high possible movement in the upwards and bounce to downwards
Catch a 80-100 pips above ema bb the tp within the opening bell
High Possible of Stop-hunts within for bears
Wait for Fractals and etc. for your position confirmation
Move with the trend setting your stop-loss within ema bb or ATR t/l
Only for high time-frames not for short time frames scalps
Setup your price alerts and alarm to catch the bullish and bearish trend !
Good luck players and happy hunting !

ETH wants to get rid of the bears.According to the daily candles, the bull's appetite may rise. need to rise :)

Bitcoin! It's Time for U-turn!After bears have taken the place for the last month it's a good time for a bounce back to 10000 and 11000.
The bottom support is so strong, that anytime it can bounce back to 7700 and up.
Good luck everyone!

Why I Think BitCoin Will Rally!So it's been awhile since I put out my last video, but i've been super freakin busy. But that being said, I've still been following the bitcoin market and it actually did what I thought it would do.
Now, it didn't give us the 2618 trade setup that I was looking for, but it did rally. And now... I think it's setting up for another move up.

EURUSD bullish set upWe can expect eurusd to retest the low then move up from there. We have a 3 key profit zones. Cheers to those who hop on !

EURUSD LONG (After sharks take all the SL)Here are my opinion on current situation, this bearish trend, that we observe now is manipulated be bears! For sure we gonna see one more atack (BEAR), before major trend down (BEAR).
The reason is liquidity which stays untouched at the moment =)

BTCUSDCould this be a strong bull?
If you zoomed into the left chart they are all similar to the current pattern of this bar. 1-2-3 & 4
A combination of green, pink, red, white, and aqua.
if this pattern close as it is. this is a valid indicator. and must continue going up until we see green-red combination for a pause.

Long Term Outlook on BitCoinWell we have a few different indications showing that we might have some potential upside in the future for Bitcoin. After violating the downward trend line, putting in a couple different Stochastic Bull setups, we know also have a potential bullish 2618 setting up at a major decision point here on Bitcoin. In this video, I walk you through all of it.
Check out my free training's at:
www.bctradingsystems.com

Bitcoin Traders Rejoice! Potential Move Higher In Near Future!So in my last Bitcoin video, I talked about why I wanted to short Bitcoin.... Well this time, I am going to show you why I think 12,000 might be in the near future.


GTOETHPossible entries. will only get in trade if price works itself to one of the target entry areas. I need price to get low enough and for all my other indicators to align
Entry 1- 61.8FIB @ 0.0051075
Entry 2- 78.6 FIB @ 0.0004413
Entry3- 88.6 FIB @ 0.00039810
Take Profit Targets
Target 1- 0.0007051
Target2- 0.00086214
Target3- 0.00086214

Bitcoin wrestling with the bears! Will we see a breakout?Alright. So I'm about to become very bullish on this market after what I believe has been a long and healthy correction.
We have already seen a breakout from the EMA 50, there is a clear bullish divergence on the MACD and the bulls are trying to push Bitcoin (BTC) past the neckline of the inverse head and shoulders pattern. IF(!) this happens, we have made it past a huge chunk of resistance and are likely to see a rise to the next major resistance at the EMA 200 and the last top of at around 10300 USD. If we break past this resistance we may even see a rise to the full potential of the head and shoulders pattern and the top of January 28th at around 12000 USD.
Never trade a pattern until it breaks out, and remember to set a stop loss to minimise losses in case the breakout looses momentum. Also IF the breakout happens, keep an eye on the trading volume, as higher volume is an indicator of a stronger breakout. If the volume is too low, we might fall back down even after the breakout happens.
And as always. Trade at your own risk!
Do you think we will see a breakout, or are we getting stomped by bears?

BTC final wave till correction complete...Based on the chart, and fractals observed thru out this correction - and using a ratio analysis of both price action and time....i believe there is a high probability to see BTC reach a lower low.
Based on the chart pattern and elliot wave count, i think the "e wave" is where we are within this cycle down, and that means correction is nearly complete. But it will not be done until the bottom is tested once more, maybe only momentarily touching down as low as $7800 on or around Feb 1 - 2nd. Or just about another 5 days or so.
Then the bulls will be back to lead the charge onwards and upwards to new higher highs.
history has this way of repeating itself, and after "major" corrections, or sell offs centered on FUD - we see the market come alive and buy like there is no tomorrow.
Look for Volume to decrease as this last wave finishes. After all the sellers exit the market, we will need to see a trend reversal where BTC is once again in a dominant MCAP by percentage vs the ALT coins. So increased volume is to be expected as the PRICE begins to impulse up. AS PRICE moves = Volume will also follow.


DGB: Quick Short TradeUnlike most people. I like trading consolidation phase the most. It is more stable and targets are easier to manage. I see a good potential in digibyte. My original analysis of DGBBTC going to 410 sat is no long there. The structure has changed and it seems we are forming a side way bull flag for now. What are your thoughts?
Trade with care.

