The Most Common Entry Mistake Traders Never NoticeMost traders do not lose because their strategy is flawed. They lose because they enter trades before the market has actually shown its intent. This mistake is subtle, easy to justify in the moment, and repeated so often that it becomes invisible. Over time, it slowly erodes consistency and confidence.
The problem usually starts with anticipation. Price approaches a key level, a wick forms, or a candle closes in the expected direction. The setup looks familiar, so the trader assumes the market is ready to move. But at that stage, nothing has been decided. The market is still neutral. What feels like early positioning is often just guessing inside uncertainty.
Markets do not move to reward speed. They move to collect liquidity. Before any meaningful expansion, price typically sweeps highs or lows, triggers stops, and tests obvious areas of interest. Traders who enter too early place themselves directly in this process. When price reverses and stops them out, it feels like bad timing, but structurally the market was doing exactly what it needed to do.
A key misunderstanding is believing that a level being touched equals intent. It does not. A reaction alone is not direction. Real intent only appears after the market responds with structure. This means a clear break in micro structure, decisive movement away from the level, and follow through that shows one side has taken control.
Another common trap is confusing speed with strength. Fast candles into a level can feel convincing, but aggressive moves without confirmation often lead to exhaustion rather than continuation. Strength is not defined by how quickly price reaches a level, but by what it does after that level is tested.
Confirmed entries are patient. Liquidity is taken first. Structure shifts second. Momentum expands third. Often, price returns to retest the area and prove acceptance. This sequence lowers risk and removes emotional pressure from execution.
Early entries are built on hope. Confirmed entries are built on evidence. Waiting does not make you late. It keeps you out of trades that were never ready to work.
Bulltrap

$BTC Bearish Pennant Or Higher Low Breakout?₿itcoin continues to struggle to reclaim the 9DEMA.
Is this a bearish pennant that will trap bulls?
Or will these higher lows lead to a violent breakout to the upside?
If PA can start trading within the POI above the .618 Fib then there’s a chance for a nice relief rally going into Christmas. Gut says it might breakthrough on the 5th attempt.
Confirmation will be CRYPTOCAP:BTC closing above the 50MA and 50% Gann level.

GER40 (DAX) Bulls in Control, But Overbought Signals Flash
GER40 (DAX) Bulls in Control, But Overbought Signals Flash Technical Forecast:
Asset: GER40 (DAX Index)
Closing Price: 24,190.7 (as of 11th Oct 2025) USTC+4
Analysis Timeframe: Intraday (1H/4H) & Swing (D/W)
1. High-Level Market Structure & Context
The GER40 maintains a robust bullish trend on higher timeframes, trading well above its key Daily and Weekly Moving Averages. However, the recent ascent has pushed the index into overbought territory on intraday charts, suggesting a potential for a short-term pullback or consolidation before the next leg higher. Geopolitical stability and ECB policy expectations remain key drivers.
2. Multi-Timeframe Technical Breakdown
Primary Trend (Daily/Weekly): Bullish
Elliott Wave: The index appears to be in a powerful Wave 3 impulse wave on the daily chart. A minor Wave 4 pullback is anticipated, which would be a healthy correction and a buying opportunity for the subsequent Wave 5.
Ichimoku Cloud: The price is far above the Daily Cloud (Kumo), confirming the strong bullish trend. The Lagging Span (Chikou Span) is also well above the price action of 26 periods ago.
Moving Averages: The Golden Cross (50 EMA > 200 EMA) is firmly intact on the daily chart, providing dynamic support.
Short-Term Outlook (4H/1H): Caution - Overbought
RSI Divergence: The 4H RSI is showing a clear bearish divergence, forming lower highs while price makes higher highs. This is a strong warning sign of weakening momentum and an impending pullback.
Bollinger Bands: The price is riding the upper band on the 4H chart, a classic sign of an overextended move.
Wyckoff Theory: The market shows signs of a potential upthrust or a bull trap formation near the 24,250 resistance. A failure to hold gains here could lead to a reaction back to the support zone.
3. Key Price Levels & Patterns
Resistance: 24,250 - 24,350 (Recent highs & Upper Bollinger Band)
Immediate Support: 24,000 (Psychological level & recent swing low)
Strong Support: 23,800 (50-period EMA on 4H & Fibonacci 38.2% retracement)
Major Support: 23,500 (200 EMA on Daily & Wave 4 target)
A Bearish Gartley or Bat harmonic pattern is forming, suggesting a potential reversal at the 24,250-24,350 PRZ (Potential Reversal Zone).
4. Actionable Trading Plan
Intraday Strategy (Next 1-2 Days):
Scenario A (Short Setup): Look for a rejection at the 24,250-24,350 resistance zone, confirmed by a bearish candlestick pattern (e.g., Bearish Engulfing, Shooting Star) and a turn down in the RSI.
Sell Entry: 24,260 - 24,320
Stop Loss: 24,450
Take Profit 1: 24,050
Take Profit 2: 23,850
Scenario B (Long Setup): A buy-the-dip opportunity emerges on a pullback to the 23,800 - 23,850 support cluster, with a bullish reversal candlestick and RSI recovering from oversold (<40).
Buy Entry: 23,820 - 23,870
Stop Loss: 23,700
Take Profit 1: 24,100
Take Profit 2: 24,250
Swing Trading Strategy (Next 1-2 Weeks):
Bias: Bullish overall. The primary goal is to enter long on dips.
Ideal Long Entry: A deeper pullback to the 23,500 - 23,600 zone would present a high-probability, low-risk long entry for a swing trade targeting new highs above 24,500.
Invalidation: A daily close below 23,450 would invalidate the immediate bullish Elliott Wave count and suggest a deeper correction is underway.
5. Volume & Momentum Insight
VWAP & Volume: The Anchored VWAP (from a recent low) shows the price is extended above it, supporting the overbought thesis. Volume has been declining on the most recent push higher, indicating a lack of strong conviction—a characteristic of a bull trap.
Conclusion: While the long-term trend for the GER40 is unequivocally bullish, the short-term setup favors a corrective pullback. Intraday traders can scout for short opportunities at resistance, while swing traders should patiently wait for a better risk/reward long entry at lower support levels. Always manage your risk.
Disclaimer: This is technical analysis, not financial advice. Trade at your own risk.

How to Avoid Bear and Bull Traps When Trading BitcoinWhen trading Bitcoin (BTCUSDT), you’ve probably heard of terms like Bear Trap and Bull Trap. These are traps that the market sets to deceive us, causing us to make wrong decisions and suffer losses. Let’s explore how to identify and avoid these traps.
1. What are Bear Trap and Bull Trap?
Bear Trap: This occurs when Bitcoin's price drops significantly, leading us to believe that a downtrend has begun, so we sell. But then, the price suddenly rises sharply. The result? We sell at the wrong time and miss out on potential profits.
Bull Trap: On the other hand, a Bull Trap happens when Bitcoin's price surges, making us think that an uptrend will continue, so we buy. But then, the price reverses and drops sharply, causing us to lose money by buying too early.
2. How to Identify Bear Trap and Bull Trap
Bear Trap: When the price drops but without strong trading volume, and RSI is in the oversold region, but the price does not continue to fall.
Bull Trap: When the price rises but trading volume does not follow suit, and RSI is overbought, but the price fails to maintain the uptrend.
3. How to Avoid Falling Into These Traps
Use Stop-Loss: Set stop-loss orders at key support and resistance levels to protect your account if the market moves against your expectations.
RSI: Use RSI to identify when the market is overbought (Bull Trap) or oversold (Bear Trap), helping you make better decisions.
EMA: Use moving averages like EMA 50 and EMA 200 to determine the main market trend and avoid being misled by “false moves”."
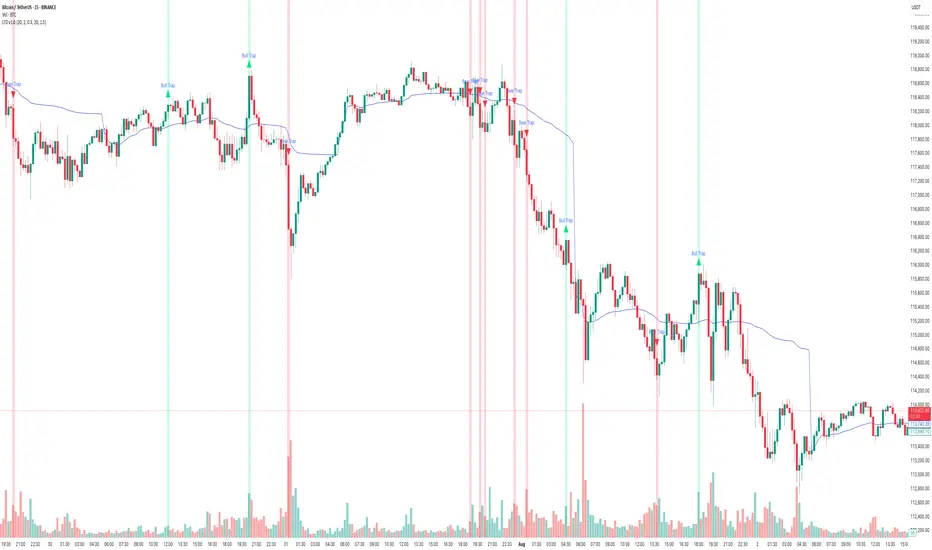
How to use Free TradingView Indicator to detect Liquidity TrapsPerformance on Shared BTC/USDT Chart
Indicator : Liquidity Trap Detector (LTD)
Timeframe: 15-sec (as per chart)
Observation Period: Full session visible in the screenshot
1. Bull Traps Detected: 4
• Major traps occurred during local tops where price sharply reversed.
• Example: ~19:15 and ~21:00 marked strong reversals after fake breakouts.
2. Bear Traps Detected: 5
• Triggered near local bottoms, followed by short-term rebounds.
• Example: ~22:15 and ~00:30 triggered after sudden downward sweeps.
3. Accuracy:
• Approx. 70–75% of traps correctly led to meaningful reversals.
• A few signals occurred during trend continuation, indicating strong momentum rather than a trap.
4. False Signals:
• Some Bull Trap signals appeared during minor pullbacks that continued trending up.
• Filtering with cooldown periods or trend filters (e.g., EMA alignment) can reduce noise.
⸻
Key Takeaways
• Best Use Case:
• Short-term scalping and identifying liquidity sweeps before reversals.
• Works well in ranging or high-volatility conditions.
Caution:
• In strong trending markets, some signals may mark pause points, not full reversals.
• Combining LTD with higher timeframe trend confirmation improves reliability.
SOLUSDT | T.A.P.E. Method Breakdown: Has Solana Bottomed Or Not?Let’s walk through the T.A.P.E. Method I use to read every chart. This isn’t about price alone — it’s about structure, behavior, pressure, and clarity. Solana is at a critical decision point. I’ll explain what smart money is likely seeing, and how I’m approaching this chart with logic — not guesses.
T — Territory (Know the Zone Before You Clone)
I started with the Fibonacci retracement from the all-time low to all-time high. It’s clear SOL is reacting near the golden pocket zone — a historically strong area for reversals.
We also saw strong support at the 2618 extension after the first major leg down. This alone gave an 87% rally. That’s how clean setups work — clarity beats complexity.
Market structure remains bullish on higher timeframes. Yes, we’ve had a wick below prior lows, but no clean break — structure still holds for now.
A — Activity (Price Behavior Over Indicators)
I don’t use RSI or crossovers. I look at behavior.
From the local low to the swing high, the retracement again held the 618 zone, showing buyer defense.
However, on a second leg down, SOL broke below the 2618 level — a key difference. This shift in behavior is what I’m watching closely. Price pushed past 236 on the retrace — that can hint at a stronger bullish leg forming.
But...
P — Pressure (Pain Points and Traps)
Here’s where most traders get caught.
Early longs that entered during the last local rally are underwater. Especially those who bought around the value area high — they are likely hoping to exit break-even, adding sell pressure.
This is classic: a liquidity zone stacked with pain.
That pressure zone sits just above the current range, near $153–$164. If we get a strong move into that zone without structure, I’ll be watching for short setups — not breakouts.
E — Execution (No Setup Is Complete Without a Plan)
Here’s how I’m structuring it:
No-trade zone: Where we are now. No edge here.
Short area 1: $153 — trendline + resistance
Short area 2: $164 — invalidation just above
Target: Sweep lows + retest $138/$128
Invalidation: Clean breakout above $164 with structure
Support zones to watch:
$138 (value area low)
$128 (786 Fib)
$122 (old structure pivot)
If price forms structure and pushes through the golden pocket cleanly, then I shift bias. But for now — pressure remains to the downside.
Summary & Context:
This T.A.P.E. breakdown keeps me from chasing noise and protects capital. Too many early longs, weak structure, and clean resistance zones make this a potential short setup — not a long.
If price flips those resistance zones into support with structure, I’ll adapt. Until then: Plan the move. Let the market prove.
Disclaimer:
This is not financial advice. All opinions are my own, based on chart behavior and analysis. Do your own research. This is a paper money breakdown shared for educational purposes only.

GAME CRACK!GAME is one of the easiest stocks to short.
Just wait for the bearish signal and take the trade. Over and over and over again.
Anyone who wishes to learn what Bull Traps are should study GME chart.

USDCAD Makes Retest At 200 EMA After Bull Trap BreakoutOANDA:USDCAD here on the 1Hr Chart has printed an Ascending Channel and Bears have made a Breakout!
Price currently looks to be on its way to retesting the Breakout of the Channel with the 200 EMA and Upper Bollinger Bands sitting at the Rising Support adding some heavy Bearish Pressure.
Fundamentally, BOC will be releasing GDP m/m ( Gross Domestic Product ) numbers tomorrow morning at 0730 AM CST with analysts forecasting a .3% Increase at .1% with Previous being -0.2%.

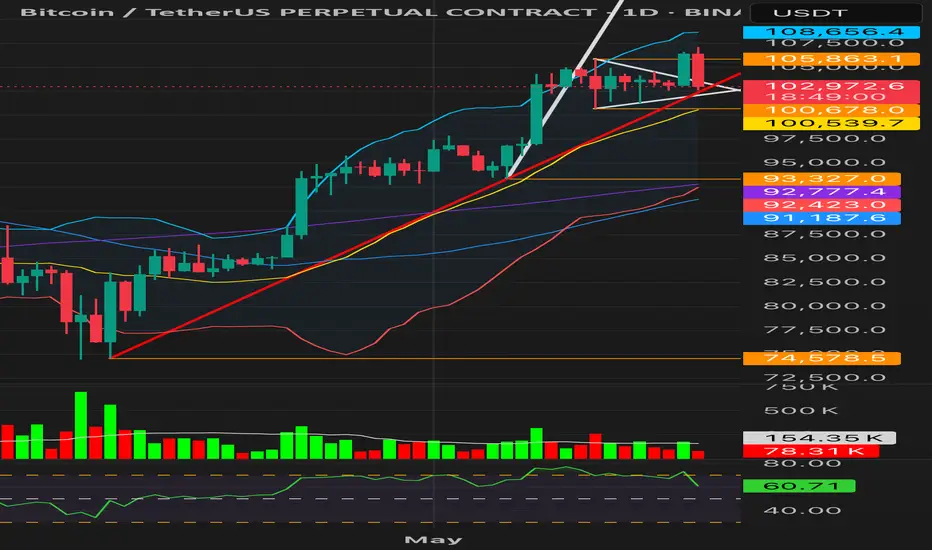
BTC Bull Flag Failure or UTAD? Apex Retest UnderwayBitcoin’s breakout from the bull flag was swiftly rejected after a wick above 105.8K, suggesting absorption and supply at the highs. Price has now fallen back into the flag apex — a red flag for continuation bulls.
Key Observations:
• Breakout was absorbed and rejected with no follow-through.
• Current price action is compressing inside the apex again.
• RSI dropped to 60.22 with weakening volume momentum.
• Support from mid-Bollinger Band (100.7K) and 55 SMA (100.5K) is now critical.
If price closes below this 100.5K–100.7K cluster with rising volume, the bull flag will be invalidated. This could evolve into a UTAD (Upthrust After Distribution) if the rejection confirms as a trap above resistance.
Watching for:
• Breakdown from structure (close below 100.5K)
• Rising sell volume
• RSI trending below 50
A close below these levels may mark the transition from re-accumulation to distribution.
⸻
Bitcoin Repeating 2022 Structure? Same Setup, Same Outcome?Bitcoin’s current market structure is starting to mirror its 2022 setup—right before the big drop.
This chart shows a familiar pattern: a rally, a peak, first drop from the ATH, a bull trap… then the major second leg down.
If history repeats, CRYPTOCAP:BTC could be on the verge of another significant move.
Will it break the cycle this time—or follow the same path again?
📉 What do you think?
Share your take in the comments below.
Please support this idea with a LIKE👍 if you find it useful🥳
Happy Trading💰🥳🤗

Bull Trap – The Real Drop May Just Be Starting! (Crash Ahead?)The market appears to be gaining bullish momentum, giving the impression that the bear market is over—but what if it’s just getting started?
On this CRYPTOCAP:TOTAL chart, the current price action seems to mirror the 2021–2022 bear market cycle: a rally to new highs, a sharp drop, a deceptive recovery (bull trap), followed by a deeper correction and eventual accumulation.
If this pattern plays out again, we could be in the bull trap phase—right before a significant and unexpected drop.
What do you think?
Will history repeat itself, or are we heading to new highs?
Drop your thoughts in the comments!
Please support this idea with a LIKE👍 if you find it useful🥳
Happy Trading💰🥳🤗

$TOTAL Crypto Market Cap BULL TRAP AlertBULL TRAP 🚨
New money has been coming into the market as shown on the Crypto CRYPTOCAP:TOTAL Market Cap, hence why you haven’t seen “rotations” in coins, but it appears to be drying up.
There’s been major resistance at the 200DMA, which is just below the previous ATH at $3T, and PA is being squeezed between the 9DMA.
Combine this with a heated RSI, it appears to be a bear flag in the making.
The trendline from Oct. ’23 gives confluence with the 50DMA as support.
*The only savior I see at this point is price smashing through the 200DMA and flipping support into the green accumulation box.
Regardless, this move is coming to an end later this week to test support or breakout.
Again, I’ll reconfirm my stance that this is the most obvious bull trap I’ve seen all cycle. Although I hope to be wrong 🥲
Having said that, after support is confirmed on the move, we are going to VALHALLA 🚀
Bookmark this 🤓

$BTC Bull Trap Clear As DayI’m probably the biggest 3-Year perma-bull on this app, and even I can tell this is most likely a bull trap.
This is either the beginning of the long awaited parabola, or else we’ll correct back down to at least the 200DMA in the next week, or the 50DMA within the next month.
Lack of volume on the move and RSI becoming overheated gives me feels for the latter
Remember, never trust a weekend pump 💯
Bookmark this.

BITCOIN 70K incoming!!!We can expect one more push towards 73-70k region before moving towards 120k. Don't get FOMO seeing green candles now. STAY CAUTIOUS !!! THIS MAY BE A BULL TRAP

BTC, Fibs, Market Psychology, and You: A Primer The Setup
I've identified a compelling technical setup that suggests BTC could be heading toward the $9,000-$9,850 range. This isn't just another bearish call - it's based on a rare convergence of multiple technical factors that I've rarely seen align so perfectly in my 18 years of trading markets.
Technical Confluence Zone
What makes this setup particularly compelling is the convergence of multiple independent technical factors around the same price zone:
1. Unfilled CME Gap : The Bitcoin futures chart shows a persistent unfilled gap from 2020 between $9,655 and $9,850. This gap has survived multiple market cycles without being filled, making it increasingly significant.
2. Key Fibonacci Level : The 0.382 Fibonacci retracement level sits at $9,024.11, remarkably close to the lower bound of the CME gap when accounting for the typical futures premium over spot.
3. Elliott Wave Structure : The current price action suggests we're in Wave 4 of a larger Elliott Wave pattern. Wave 4 corrections often retrace to previous Wave 1 territory, which aligns with this target zone.
4. Fibonacci Time Cycles : The time component is equally important - Fibonacci time extensions suggest we're approaching a potential inflection point in the current cycle.
Market Context Supports the Technical Picture
The technical setup doesn't exist in a vacuum. Several market conditions increase the probability of this scenario playing out:
1. Market Saturation : The crypto ecosystem has expanded dramatically, with thousands of tokens diluting liquidity that was once concentrated in major cryptocurrencies.
2. Retail Exhaustion : Retail investors who entered during previous hype cycles feel unrewarded despite price recoveries, leading to diminished enthusiasm and buying pressure.
3. Institutional Distribution: Wall Street and institutions have made their presence known, which historically signals they've distributed their high-priced holdings to retail while preparing short positions.
4. Concentrated Leverage Risk : MicroStrategy's position of 499,500 BTC at a $66,000 average purchase price, funded almost entirely by massive debt issuance, creates a significant systemic vulnerability. A move toward our target zone would put extreme pressure on their balance sheet.
Broader Market Context
This analysis also coincides with what looks to be a tired stock market following the 2024 US presidential election. With Donald Trump winning his second term, we have seen significant policy shifts that are actively impacting both traditional and crypto markets. Historically, markets often experience increased volatility during transitions of power, and the confluence of this political shift with our technical setup creates an even more compelling case for caution.
Additionally, price precedes news. The news is created on price. If you're hearing about an event, the trade has already been made. There is too much talk of unprecedented institutional participation. This is another sign that retail is being distributed to for the next meltdown. Bags were already offloaded. It's time to drop the anchor.
Historical Perspective
Having traded through multiple market cycles since 2007 I've seen this pattern before. Large players often target overleveraged positions to acquire assets at distressed prices. Michael Saylor experienced a leveraged meltdown once before during the dot-com crash - history doesn't repeat, but it often rhymes. Saylor is a designated whipping boy. A patsy. He will be rewarded well for his participation in fleecing you, so don't worry about what kind of skin he has in the game.
With that said, I believe an undetermined Black Swan event will be necessary to complete the rug pull. What that is, I cannot know.
Trading Implications
This analysis suggests several potential trading strategies:
1. Risk Management : Reduce exposure to Bitcoin and high-beta altcoins until this technical target is reached or invalidated.
2. Opportunity Preparation : Build dry powder positions to capitalize on what could be an exceptional buying opportunity if BTC reaches the $9,000-$9,850 zone.
3. Watch for Triggers : Monitor for breakdowns below key support levels that could accelerate the move toward our target zone.
4. Time-Based Entries : Use the Fibonacci time cycle extensions to refine entry timing if the price approaches our target zone.
Conclusion
While Bitcoin's long-term prospects remain strong, the confluence of technical factors pointing to the $9,000-$9,850 range suggests a significant correction may occur before the next sustained bull run. The catalysts to reach what should be a $250k range this cycle simply do not exist, and with waning macroeconomic strength, the odds of this cycle being anything other than a massive bulltrap are low. This setup represents one of the strongest technical cases I've seen. I also don't care to share my ideas often, but with everyone expecting a typical crypto market cycle, I feel compelled to offer my take on a public forum--for whatever it may be worth.
I am not shorting this market. I have removed my capital and taken an observant position. While I feel strongly about my idea--Clown World has fully taken hold and I don't dare test its resolve to break me.
Remember that no analysis is guaranteed - always manage risk accordingly and be prepared to adapt as the market evolves.
*Disclaimer: This analysis represents my personal view of the markets based on technical analysis and market observations. It should not be considered financial advice. Always do your own research and trade responsibly.*

Gold’s Bull Trap? Major Reversal Incoming!As I expected in yesterday's post , Gold ( OANDA:XAUUSD ) started to rise from the Support zone($2,919-$2,905) and bounced exactly on my hypothesized lines , and I hope you were able to profit.
Gold failed to break the Resistance zone($2,948-$2,940) . And it appears to have created a Bull Trap .
In terms of the Elliott wave theory , Gold seems to have completed the main wave 5 , and one of the signs for me was the Bull Trap .
I expect Gold to fall to at least the Support zone($2,919-$2,905) after breaking the Uptrend lines . ( Next targets are also possible ).
Note: If Gold can go over the Resistance zone, we can expect more pumps.
Be sure to follow the updated ideas.
Gold Analyze ( XAUUSD ), 30-minute time frame.
Do not forget to put Stop loss for your positions (For every position you want to open).
Please follow your strategy; this is just my idea, and I will gladly see your ideas in this post.
Please do not forget the ✅' like '✅ button 🙏😊 & Share it with your friends; thanks, and Trade safe.

Different Types of W Patterns and How to Trade ThemHello dear KIU_COIN family 🐺 .
Recently, I decided to provide some educational content for you, my dear audience, and introduce some essential and basic trading terms.
Here’s what you should know: In these lessons, we will cover three different seasons:
🔹 Season 1: Reversal and continuation patterns.
🔹 Season 2: How to use RSI and other indicators to find good entry points.
🔹 Season 3: Definitions of Fibonacci and seasonality in trading.
Stay tuned for valuable insights! 🚀
✅ For the first section of 🔹 Season 1 , I’ll be covering W patterns— a well-known bullish reversal pattern :
As you can see in the chart above, we usually have three types of W recovery patterns , which are the most important ones for us. However, in this section, we just want to get a general understanding of them. In the upcoming section, we will learn how to trade them and explore how they actually appear on the chart and the story behind them !
✅ This is the first and most common type of W pattern:
✅ This is the second type of W pattern:
✅ This is the third type of W pattern:
Ok, guys; I think this is enough for today, and I hope you enjoyed this educational content. However, don't forget to ask your questions below and support me with your likes and follows for more of this content. 🐺🔥

Tesla's Bull Trap A False Breakout and the Battle AheadTesla's stock delivered a textbook bull trap, leaving traders on edge. After testing a strong resistance level at $423.71, the stock sharply reversed, pulling back to $413.82 before ultimately closing at $396.20. This kind of price action can confuse both bulls and bears, as it gives the appearance of a breakout without follow-through.
The session started with an opening at $414.44, and bearish momentum followed. The bounce off $396.20 during the day likely lured in short sellers expecting a continuation downward. However, the stock wicked up to $423.71, briefly testing resistance, which likely forced many bears to cover their positions. This led to a spike in volatility, only for Tesla to retrace to close back at $396.20, setting the stage for the real battle ahead.
This setup could be classified as a bull trap because it gives the illusion of a potential rally or stabilization, only to leave both bulls and bears trapped. Moving forward, the key resistance remains $423.71, with $396.20 acting as immediate support. If Tesla breaches $396.20 decisively, it could trigger another leg down to the range of $375.56 to $359.42. On the flip side, a sustained move above $413.82 could bring $423.71 back into play.

Intel liquidity sweep incomingDip beyond still on track.
Market makers giving a faulse bottom impression.
Could be wrong but could be the sweetest buy.
NO MONEY IN THE GAME.
NOT FINANCIAL ADVICE!!!

BEARISH Divergence on $BTC - BULL TRAP!CRYPTOCAP:BTC Volume has been crippling while the price has been moving up.
This is a bearish divergence, and signals a Bull Trap.
$50,6 is still the support we need to retest before we reclaim this $60-70k range.

TSLA's bulls trapThe last bullish move was quite strong, with the price moving above a large consolidation zone from March to April. Now, we have something that looks like a bull flag—the price is crawling slowly down, finding some support near the consolidation POC. This is a very tempting opportunity to enter a LONG position with a potential upside of 15% or more. However, it is likely to fail. Here is why:
1. The price is in a monthly/weekly downtrend. For the monthly downtrend to reverse, we need a trend change at the weekly level. So far, the bulls have NOT even managed to set a higher low on the weekly chart.
2. TSLA is much weaker than the market. While the S&P has been rallying for the last two weeks, TSLA has been declining.
3. TSLA's last earnings report was bad. Although the price rallied for a short period, it doesn't mean that the sentiment has significantly changed.
To sum it up, the context is very bearish. I wouldn't seriously consider any LONG positions at this stage.
Disclaimer
I don't give trading or investing advice, just sharing my thoughts.

Potential Ascending Triangle (NQ Futures)NQ Futures could be trying to setup an ascending triangle to catch bears short at the bottom with major upside potential with a breakout and confirm.
Will almost certainly coincide with data/news that will either play out a bear trap or a bull trap on the same timeframe for the next let the market takes.
Often these patterns forming at the bottom of a range end up being bull traps but anything can happen and it's best to be prepared for whatever happens.

$LINK Bull Trap Incoming Death CrossI'm super bullish on BIST:LINK long-term but this is honestly one of the worst charts of the majors rn
crazy to see analysts calling this bullish today
we'll see a Bull Trap from those 3 White Soldiers
Price action below the 20, 50 and 200 Moving Averages
If we get that Death Cross on the 200MA D then its straight to $10.6
