Stop Dreamig, Start Trading!I’ve talked quite a lot about the illusions in crypto. I’ve made fun of the arrival of altcoin season, and even about 3 weeks ago I wrote an article saying that if I want, I can see any chart bullish, even if I flip it upside down 🙂
It’s Sunday, I’m scrolling aimlessly on the internet and I keep seeing the same thing again, something that repeats like the voice of an alcoholic saying he’ll quit drinking again starting Monday.
Altcoin season is coming again.
These prices will never be found again.
BTC has hit the bottom again — a bottom that was also at 100k where it was the opportunity of a lifetime, at 90k it was an unbelievable bargain.
Again.
Again, and...
Again...
The idea is simple: I also had a 75k target, it went to 60k… I didn’t know. The one who said 60k didn’t know either. And nobody knows if it goes to 50, to 30, or to 250k by the end of the year.
That’s basically the idea.
No grand conclusions.
Just reality.
A Simple Advice
If I were to give one clear and simple piece of advice:
- Stop dreaming, start trading.
- Start learning technical analysis
- Start using money management
Not because TA predicts the future like a crystal ball, but because it gives structure.
Not because money management is exciting, but because it keeps you alive.
A Funny Story From Last Night (But Also Not Funny)
Funny story from last night — and I swear it’s real.
Last night I was out with a friend in the Old Town in Bucharest. We were celebrating… well, celebrating his sports betting ticket that hit with odds of 486. In crypto language: a 486x.
He does this every weekend — places a few tickets, about 100 RON each (around 20 EUR). Most lose, one hits once in a while, this one hit BIG.🙂
What’s truly funny is the contrast.
The same friend bought a crypto coin at the top in 2021. Since then, he’s been DCA-ing into what is objectively a garbage coin. Yesterday I even asked him about it and he told me he’s about 60k in the hole.
60k...for a guy that is not rich at all...
The irony writes itself.
Investing vs. Calling It Investing
The reality is he believes he’s an investor.
But he doesn’t know how to draw a trendline.
I’m more than convinced the first time he ever looked at his coin’s chart was when I tried to analyze it for him about two years ago.
He bought because of an influencer’s story.
Now he keeps DCA-ing endlessly, with the desperate hope that one day he’ll recover.
That’s not investing.
That’s anchoring to a mistake.
And psychologically, it’s not that different from betting slips — just slower and dressed in nicer words.
The Lesson Hidden in Plain Sight
There’s actually a lesson in the contrast:
With sports betting, he knows it’s gambling.
With crypto, he believes it’s investing.
But behavior matters more than labels.
If decisions are based on:
- influencers
- hope
- blind DCA
- refusal to reassess
Then the difference between gambling and investing/trading becomes very thin, if any.
The Market Owes Nobody a Recovery
Markets don’t care where you bought.
They don’t owe you a comeback.
They don’t reward loyalty.
Sometimes a bad asset stays bad forever.
Sometimes a narrative never returns.
Sometimes the “cycle comeback” is just a story people tell to cope.
Harsh? Maybe.
But expensive lessons are usually the honest ones.
The Real Shift
At some point, every trader faces a choice:
Treat the market like a place for dreams
or
Treat it like a place for decisions.
Dreams feel better.
Decisions work better.
Final Thought
You don’t need to predict bottoms.
You don’t need 100x stories.
You don’t need altcoin seasons to save you.
You need structure.
You need risk control.
You need honesty with yourself.
Stop dreaming.
Start trading.
Have a nice Sunday!
Mihai Iacob
What traders are saying

Bitcoin Back Above $70,000. Here Are Key Levels to Watch NowA trip to $60,000 and back before coffee.
Bitcoin BITSTAMP:BTCUSD spent the end of last week doing what it does best: reminding traders that fire-breathing dragons aren’t in fairytales only.
After a sharp drop to $60,033 on Thursday torched thousands of long positions, the world’s largest cryptocurrency bounced hard. By Friday, it had clawed its way back above $70,000. Still, that dip was the orange coin’s lowest level since October 2024 and roughly 52% below last year’s record of $126,000 .
By Monday morning, Bitcoin looked almost calm. It hovered around $70,700, barely changed on the day. The contrast with last week’s price action felt dramatic. Bitcoin rarely travels in straight lines, and this was another reminder.
🤔 Buy the Dip or Declare It Gone?
As always, opinions split fast. Some traders rushed to declare Bitcoin’s demise (for the 463th time – there’s a website for that ). Others quietly loaded up, calling the move a classic paper-hands shakeout.
Markets, by nature, lean optimistic. The real question is whether optimism has enough fuel to pull Bitcoin out of its recent slump and into a renewed upside phase. The bounce has been impressive, an 18% upswing, but conviction remains fragile.
🌪️ Volatility Is a Feature, Not a Bug
Extreme volatility comes with the territory. Bitcoin’s slide from a $126,000 peak in October arrived despite a crypto-friendly White House and accelerating institutional adoption.
For some investors, that raised uncomfortable questions about Bitcoin’s role during periods of geopolitical stress.
Digital gold? Perhaps. Perfect hedge? That debate remains open.
🧊 The Market Finds Its Feet, Carefully
The broader crypto market has stabilized, though nerves remain close to the surface and Bitcoin still commands the lion’s share, according to the dominance chart . Traders describe the tone as cautious rather than confident. Or every analyst’s favorite expression: cautious optimism.
One level stands out on everyone’s chart. The $60,000 threshold has emerged as the primary near-term support. It marked the floor of last week’s selloff and remains the line bulls prefer not to revisit anytime soon.
On the upside, $75,000 carries symbolic weight. A sustained break above that zone would strengthen the case that the worst of the bear phase has passed and that buyers are regaining control.
📈 Institutions Quietly Step Back In
While price action grabbed headlines, flows told a quieter story. US Bitcoin exchange-traded funds recorded $221 million in inflows on February 6, suggesting that some investors viewed the selloff as an opportunity rather than a warning sign.
Institutional participation tends to move slowly and deliberately. These flows do not guarantee higher prices, but they add some confidence during moments of stress. For a market built on confidence, that matters.
🧮 The Levels That Matter Now
If Bitcoin is serious about $70,000, attention turns to a handful of technical levels that traders are watching closely.
But before that, let’s talk about the 200-week moving average near $58,000, a level Bitcoin respected during the recent dip. Holding above it keeps the longer-term structure intact.
Next sits the $73,000 to $75,000 zone, an area packed with prior support and resistance. Clearing it convincingly would signal momentum shifting back toward the bulls.
Beyond that, the path opens toward $81,000, a level that could act as the next magnet if sentiment continues to improve.
Again, that is if the OG coin manages to reel itself out of the sub-$70,000 area. The bounce from $60,000 reminded traders that sharp selloffs often attract bargain hunters and dip scoopers.
Off to you : So where do you stand right now? Are you holding your Bitcoin, exploring alternatives, or watching from the sidelines? Share how you are navigating this market in the comments.

BITCOIN POSSIBLE MOVEMENT ( MUST READ IT )Hello Traders hope everyone is good 👍🏻
Here's my first idea on BITCOIN and what do you think about my BTC analysis? Please share in comment section and follow me for more updates on BITCOIN
Price is moving with clear market structure, confirming a valid BOS (Break of Structure) and strong institutional reaction from marked zones.
Liquidity has been swept, and price is now reacting at high-probability levels.
📈 Market Bias: Structure-based & confirmation-driven
🎯 Key Levels: Institutional supply & demand zones
🧭 Focus: Liquidity → Structure → Confirmation
⏳ Rule: No confirmation = No trade
📍Resistance & Target
Resistance Area: 72500 / 73000
1 TARGET 66000
2 TARGET 63500
📌 Execution Insight:
Trades are planned around key levels, not random entries.
Patience and discipline define the edge.
⚠️ Volatility Note:
Fake moves are common near key zones — wait for candle close and protect risk.
---
🧠 Risk Disclaimer
This analysis is for educational purposes only.
Always follow proper risk & money management.
---
🤝 Support & Engagement
If this analysis adds value,
boost ❤️, comment your view 💬 & follow 📌 for more structure-based insights.
#BITCOIN #Btc #Forex #PriceAction #TrendlineBreakout #SafeHaven #TradingView #SupportTarget #IntradayTrading #SHAY_ANALYTICS

Elise | BTCUSD · 30M – Liquidity Reaction StructureBITSTAMP:BTCUSD
After taking external liquidity above 71,000 earlier, BTC shifted bearish and compressed into HTF demand. The recent sweep below 66,000 triggered a strong reaction, suggesting short-term upside toward internal resistance. Upside remains corrective unless structure breaks above 69,000–70,000.
Key Scenarios
✅ Bullish Case 🚀 →
🎯 68,500
🎯 69,200
🎯 70,600
❌ Bearish Case 📉 →
Lose 65,800 support
🎯 64,800
🎯 63,900
Current Levels to Watch
Resistance 🔴: 68,500 & 70,600
Support 🟢: 65,800 – 66,100
⚠️ Disclaimer: For educational purposes only. Not financial advice.

BTC Liquidity Probe and then Liquidity Harvest laterIn the above chart, I am trying to show that the selling pressure that drove price sharply to $60,000 was engineered by market makers to test the depth of liquidity and grab some liquidity in the process. The fact that after buy orders were triggered at the support zone of $60,000 but there was no immediate follow through but a choppy and sideways price action suggests that 'they' have unfinished business below $60k. The price action we are seeing is the next step of their manipulation, it's designed to induce more buyers who will be sacrificed soon with panic selling. We need to understand that Bitcoin is getting scarce and market makers must build inventory and liquidity and this is how they are engineering it step by step.
The second liquidity sweep where the real liquidity sits around $48k to $54k is where clustered stop loss orders will be triggered along with panic sellers and margin liquidations. This is the target area for their intermediate accumulation, from about this level will there be a healthy bounce to about $80k.
Guys this is the liquidity atlas map I am looking at currently.
I hope this weekends analysis is helpful to your own due diligence.
Thank you as always for reading and listening to my publications.
Cheers my fellow traders.

Bitcoin: Is the WXYXZ Correction Setting Up Wave C?Bitcoin: Is the WXYXZ Correction Setting Up Wave C?
During the last 5 days BTC declined by nearly 5% from 72250 to 65170
Looks like the B wave has more a corrective movement and is expanding as WXYXZ pattern. If the price manages to move above the previous X near 68300 it will add the chances that our analysis is correct. Until that moment is a bit tricky
Given that the first A wave was impulsive this is adding some extra value that we could be on the C impulsive wave soon as shown in the chart
Key targets:
70800; 72970; 76600; 78970
You may find more details in the chart.
Thank you and good luck! 🍀
❤️ If this analysis helps your trading day, please support it with a like or comment ❤️

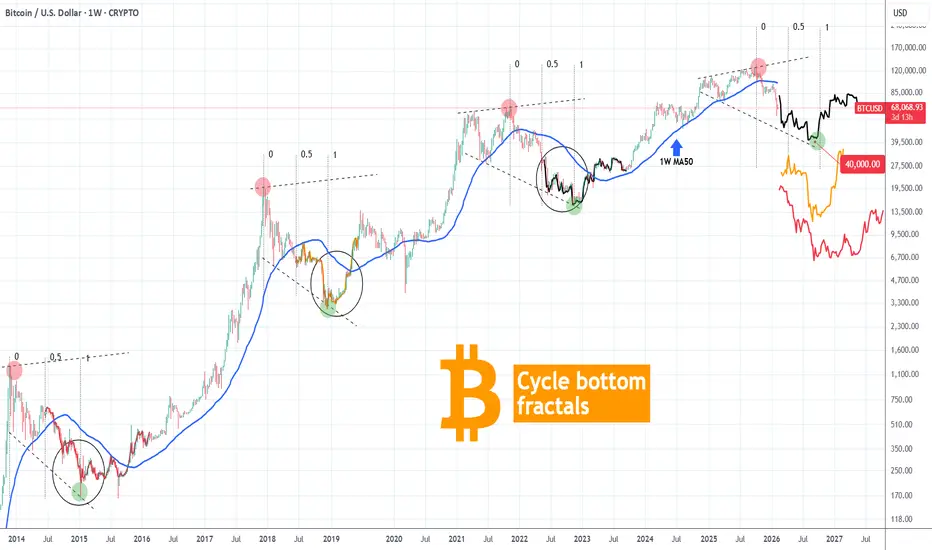
BITCOIN Cycle bottom fractals map the rest of 2026 towards $40k.Bitcoin (BTCUSD) continues to be under heavy pressure despite having the 1W MA200 holding the crash last week. Having long lost its 1W MA50 (blue trend-line), which confirmed the Bear Cycle, we are now approaching its 2nd Phase, which is the bottoming process.
This doesn't mean that the bottom is here but more like that the market is entering a Phase where it will gradually attempt to lead us to the bottom of the 4-year Cycle, which based on it should be around September - October 2026.
Having a look at the past three Bear Cycles and drawing their Phase 2 fractals after the 0.5 Fibonacci level, that led to their bottom, we can see that the structure is quite familiar. Not identical, but similar. All principles are the same and there is a high correlation with the 2022 Bear Cycle in particular.
Even though we haven't yet technically reached the middle (0.5 Fib) of this Bear Cycle, according to that fractal, BTC should start making a series of Lower Lows gradually, that can potentially lead to as low as $40000. That could be the Bear Cycle bottom.
So do you think that's a strong probability for the remainder of 2026? Feel free to let us know in the comments section below!
---
** Please LIKE 👍, FOLLOW ✅, SHARE 🙌 and COMMENT ✍ if you enjoy this idea! Also share your ideas and charts in the comments section below! This is best way to keep it relevant, support us, keep the content here free and allow the idea to reach as many people as possible. **
---
💸💸💸💸💸💸
👇 👇 👇 👇 👇 👇
BITCOIN Is $50000 inevitable??Bitcoin (BTCUSD) is again on the downturn after almost reaching its 1W MA200 (orange trend-line) just last week. One would thought that long-term buyers would make their presence clear on this historically supportive level but so far their absence is more than emphatic. If this continues, the market eyes the next critical Support level, the 1W MA350 (red trend-line), which is where the previous 2022 Bear Cycle bottomed.
In fact, we identify a quite similar pattern on BTC's last three major correction events (2022 Bear Cycle and late 2019 - early 2020 on COVID flash crash). As you can see a Double Top rejection followed by a Higher Lows trend-line bearish break-out has been the common pattern on all (including the current correction). The previous two both broke below the 1W MA200 and their respective 1.618 Fibonacci extension levels, with the 2022 fractal bottoming just above the 1.786 Fib ext while the 2020 below it. In both cases, the 1W MA350 held.
As a result, if buyers continue to be absent and BTC is getting heavily sold after every short-term rally, we can expect the market to target $50000, which isn't just the next psychological level but also just above the current 1.786 Fib and will still be above the 1W MA350 (based on its current trajectory).
So do you think a $50k test is inevitable at this point? Feel free to let us know in the comments section below!
---
** Please LIKE 👍, FOLLOW ✅, SHARE 🙌 and COMMENT ✍ if you enjoy this idea! Also share your ideas and charts in the comments section below! This is best way to keep it relevant, support us, keep the content here free and allow the idea to reach as many people as possible. **
---
💸💸💸💸💸💸
👇 👇 👇 👇 👇 👇

This Is the Bitcoin Situation for the Next 3 YearsThis is the Bitcoin Situation for the Next 3 Years
Since last August I warned that the $108,000 level could not be lost in Bitcoin or else we entered a bearish cycle and it was going to be hard.
I am not a guru nor do I have a crystal ball.
But I try to get informed and I dedicate a lot of time to understanding what a Halving is. I understand mining costs. I understand staking. I understand leverage.
But above all we need to understand how all this leads us to CYCLES.
This chart is very powerful for understanding Bitcoin.
Each line is a cycle since its Halving. This event happens every 4 years.
The first cycle (the blue one) made the high somewhat earlier but the following cycles have made their highs at the same moment. All the lows have happened one year after reaching this high.
This last cycle (the strong yellow one) looks smaller and this is not a coincidence. Notice that each cycle is smaller than the previous one.
And this makes sense.
Bitcoin cycles are INFLATIONARY AND LOGARITHMIC.
Inflationary and logarithmic?
This is vital. Let me translate it for you.
Bitcoin should follow inflation because it is a finite asset like gold or real estate in certain areas.
Easy but logarithmic ?
This is something you can't IGNORE anymore.
🤔 Bitcoin cycles go up less every time.
One reason is that the more an asset capitalizes the more it costs to keep it going up. Money in the world is finite and therefore when something capitalizes billions it starts to be complicated to make it grow in a faster rate than inflation.
But you must also know that in the Halvings the rewards to miners are reduced.
At the beginning this meant a beastly reduction of many BTCs which drove the price very high. But now the reward is barely reduced by 3 or 1 BTC so the price cannot rise at the same pace.
If we pay attention to previous cycles Bitcoin will keep falling in 2026 until the end of the year before starting a recovery. This is the most likely scenario right now.
So much for Bitcoin theory so let us go to the practical part.
🚀 Where will this low happen?
I do not know and nobody knows but we have clues.
In each of the cycles we have seen the price retreat from highs.
And a lot.
The first cycle down 85%
The second down 80%
The third down 75%
And now?
Maybe 70%? It could be. It is just an approximation .
This last drop to $60,000 is already a great milestone as the price has corrected 50% but in previous cycles we see that the best is still to come. It can fall another 50% down to $30k or $40k to meet the levels close to 70% correction which would seem plausible based on previous behavior.
In terms of price it seems there is a gap to fill and in terms of time it is even better.
Correction time of first cycle is 12 months
Correction time of second cycle is 12 months
Correction time of third cycle is 12 months
If this fourth cycle lasts the same as the previous ones we will be talking about seeing the moment of maximum pain in October 2026.
That is the moment where we will all say that BTC is going to 0.
Who knows.
But, if we start accumulating in the $60k zone and save some money for the $30-40k area, we could easily average a $50k position during 2026.
After three years we should be at the next cycle peak which following a logarithmic progression could be somewhat higher than these last $120k (current cycle peak).
Let us assume $150k. (Which is a number I get from the serie of previous rallies, but there is too much math for today)
We are talking about selling the investment for triple the price in 3 years. That is a return that is not bad at all.
The risk is total. I go without a Stop Loss. It is aspirational investment and in no case is it capital protection.
And while we wait for the price to reach the right zone to keep buying, you could also make a quick trade to catch the next 10% rally.
👇 WANT MORE?
🚀 Hit the rocket, read my profile and follow so we can find each other again.

Selena | BTCUSD · 30M – Ascending Channel | Range Expansion BITSTAMP:BTCUSD BINANCE:BTCUSD
After a strong impulsive move from the sell-side liquidity sweep near the lows, BTC formed a controlled range between demand and supply. Current price action shows compression inside the range, suggesting an upcoming expansion either through a bullish continuation or a deeper liquidity grab before the next move.
Key Scenarios
✅ Bullish Case 🚀 →
• Hold above channel support + demand
• 🎯 Target 1: 72,800
• 🎯 Target 2: 74,500
❌ Bearish Case 📉 →
• Breakdown below 67,800 range low
• 🎯 Downside Target 1: 64,000
• 🎯 Downside Target 2: 60,000
Current Levels to Watch
Resistance 🔴: 71,800 – 73,200
Support 🟢: 68,200 → 67,800
⚠️ Disclaimer: This analysis is for educational purposes only. It is not financial advice.

BITCOIN always leads stocks when Bear Cycles happen. This time??Bitcoin (BTCUSD) completed a more than -50% drop last week from its October 2025 All Time High (ATH) while stocks stayed close to their ATH. This chart shows that while BTC is obviously on a Bear Cycle, the S&P500 (SPX) illustrated by the blue trend-line, is still on Bull Cycle territory.
So why this huge divergence between BTC and stocks. Well looking at it historically, this is not uncommon. During the 2022 Bear Cycle, Bitcoin had to crash by more than -40% before the stock market started its own correction, while in 2018 Bitcoin again crashed by more than -50% before the SPX started a Bear Cycle.
This is very logical from a long-term investing standpoint as investors seek first to liquidate the massive profits on riskier assets like Bitcoin, add some remaining capital on stocks and then when the stock market shows signs of a long-term correction, withdraw their funds from there as well. This is usually when the USD takes off as they convert stocks to dollars and choose to weather out the storm primarily in cash (others might choose precious metals).
In any event, this analysis shows that since Bitcoin is already down by more than -50% from its historic High, we might be seeing a Bear Cycle starting on the S&P500 as well.
Do you agree with that? Feel free to let us know in the comments section below!
---
** Please LIKE 👍, FOLLOW ✅, SHARE 🙌 and COMMENT ✍ if you enjoy this idea! Also share your ideas and charts in the comments section below! This is best way to keep it relevant, support us, keep the content here free and allow the idea to reach as many people as possible. **
---
💸💸💸💸💸💸
👇 👇 👇 👇 👇 👇

Weekly Review of Your TradesA weekly review is not a recap of wins and losses. It is a diagnostic process. The goal is to identify patterns in behavior, execution, and decision-making that are invisible during live trading. Without this review, mistakes repeat quietly and improvements stay accidental.
The review begins with context. Each trade should be grouped by market environment: trending, ranging, or transitioning. Volatility conditions and session timing matter. A losing trade taken during thin liquidity or volatility expansion carries a different lesson than one taken during a clean trend. Results mean very little without environment classification.
Next comes execution sequencing. Review whether trades followed the intended order of events. Liquidity interaction, structural shift, displacement, and retest should be evaluated in that sequence. When trades fail, the question is not whether the idea was wrong, but which step was skipped or rushed. Most performance leaks come from entering before permission is established.
Risk behavior deserves its own section. Compare planned risk to actual exposure. Check whether position size increased after wins or clustered during the same session. Identify correlation between trades that relied on the same narrative. Many drawdowns are not caused by bad ideas but by stacking exposure when conditions deteriorate.
Entry and exit behavior often reveals more than setups. Early exits during valid moves point to discomfort with unrealized profit. Late exits on losers point to avoidance of taking losses. These patterns repeat until they are measured. The chart alone rarely explains them.
Quantify execution quality separately from outcome. Track how many trades met all setup criteria, how many were partial alignments, and how many were impulse decisions. A profitable week with poor execution is a warning sign. An unprofitable week with disciplined execution is often progress.
The final step is adjustment. One or two focused changes are enough. Narrow session windows, reduce exposure during specific environments, or tighten rules around confirmation. A weekly review should simplify trading, not complicate it.
Consistency is built between trades, not during them. The weekly review is where structure replaces emotion and where improvement becomes intentional rather than accidental.

Elise | BTCUSD · 30M – Liquidity Sweep → Corrective BounceBITSTAMP:BTCUSD
Bitcoin dropped aggressively from the upper range, clearing liquidity and reacting sharply from the lower demand zone. The current bounce is driven by liquidity grab and short-covering, suggesting a corrective move toward the mid-range resistance. Unless price breaks and holds above the key resistance, this remains a pullback within a broader range.
Key Scenarios
✅ Bullish Case (Corrective Move) 🚀 → 🎯 Target: 69,400 – 69,600
❌ Bearish Case 📉 → Rejection from resistance may send price back toward 66,700 → 65,000 liquidity zone
Current Levels to Watch
Resistance 🔴: 69,400 – 69,600
Support 🟢: 66,500 – 66,700
⚠️ Disclaimer: For educational purposes only. Not financial advice.

Eliana | BTCUSD · 15M – Range at Resistance | Decision ZoneCOINBASE:BTCUSD BITSTAMP:BTCUSD
After a strong bullish impulse from the 60k liquidity sweep, BTC formed a distribution range near 71.5k resistance. This behavior indicates smart money indecision: either a liquidity grab above range for continuation or a breakdown toward deeper supports if trendline fails.
Key Scenarios
✅ Bullish Case 🚀 →
• Clean breakout and acceptance above range resistance
• 🎯 Target 1: 72,200
• 🎯 Target 2: 73,000
❌ Bearish Case 📉 →
• Rejection from resistance + trendline breakdown
• 🎯 Downside Target 1: 67,800
• 🎯 Downside Target 2: 65,000
• 🎯 Downside Target 3: 60,250
Current Levels to Watch
Resistance 🔴: 71,400 – 71,600
Support 🟢: 70,000 → 67,800
⚠️ Disclaimer: This analysis is for educational purposes only. It is not financial advice.

Is Bitcoin Really Rising — or Just an Exit Rally?If we set emotions aside and look at the market through a pure trend-following lens , BTCUSD is currently in a state of “a rebound within a broader downtrend” rather than a genuine recovery. The recent price bounces are largely driven by short-covering after panic selling, not by a clear return of strong institutional capital. With market sentiment still cautious, every rally risks turning into an opportunity for distribution.
From a structural perspective, Bitcoin has completely broken its previous bullish base and has entered a clearly defined descending channel on H4. Price remains trapped below the Ichimoku cloud, signaling that the dominant trend has not changed. The bounce from the lows has only produced a lower high, confirming that buyers currently lack the strength to regain control.
The 71,000–71,300 zone stands out as a critical price ceiling. This area is a confluence of the descending trendline and key technical resistance , where selling pressure is highly likely to emerge. If Bitcoin reaches this zone but fails to secure a decisive candle close above it , the probability strongly favors a renewed move to the downside.
In that scenario, the 62,800–63,000 region becomes a logical target for the next bearish leg —aligned with both technical structure and the risk-averse sentiment still dominating the crypto market. At this stage, fighting the trend by trying to catch a bottom carries significant risk , while selling into rallies remains the more disciplined strategy given the current market picture.

BITCOIN Could that be the shortest Bear Cycle ever???Bitcoin (BTCUSD) reached (almost) its 1W MA200 (orange trend-line) last week fastest than any other Bear Cycle before. At the same time, its 1W LMACD hit the same symmetrical level (blue) it did every time BTC completed the 1st Stage of the Cycle. Especially in the case of the (previous) 2022 Bear Cycle, it was around the same time the price came close to the 1W MA200 as well.
As this chart shows, the 4-year Cycle bottom occurs around when the 1W LMACD makes a Bullish Cross after its hits -0.21. We are still far from that. But what past Bear Cycles show is that when the 1W LMACD has hit the current level, Bitcoin takes at best the same amount of time to bottom as it did from the start of the Bear Cycle to the moment the LMACD hit the current level (blue Support). That was particularly the case during the previous (2022) Bear Cycle (was 27 weeks from High to LMACD contact, and another 27 weeks until the Cycle bottomed). The two Bear Cycles before it, bottomed in less time.
As a result, given that last week completed 17 weeks from the Cycle Top up until the LMACD contact, the Cycle could bottom in the next 17 weeks (based on that model). This suggests the first week of June 2026, while the 4-year Cycle suggests mid-September. So what do you think is more likely to happen? Could that be BTC's shortest Bear Cycle ever?
Feel free to let us know in the comments section below!
---
** Please LIKE 👍, FOLLOW ✅, SHARE 🙌 and COMMENT ✍ if you enjoy this idea! Also share your ideas and charts in the comments section below! This is best way to keep it relevant, support us, keep the content here free and allow the idea to reach as many people as possible. **
---
💸💸💸💸💸💸
👇 👇 👇 👇 👇 👇

Elise |BTCUSD · 30M – Corrective Pullback → Bullish ContinuationBITSTAMP:BTCUSD
Bitcoin completed a deep sell-off and swept liquidity below previous lows, trapping late sellers. Price then recovered impulsively and formed a corrective rising channel. After rejecting channel highs, BTC pulled back into demand, where buyers are reacting again. As long as this support holds, the structure favors a continuation move toward higher resistance levels.
Key Scenarios
✅ Bullish Case 🚀 → 🎯 Target: 74,500 – 75,000
❌ Bearish Case 📉 → Failure to hold the 66,800 support opens the door for another downside continuation.
Current Levels to Watch
Resistance 🔴: 74,500 – 75,000
Support 🟢: 66,800 – 67,200
⚠️ Disclaimer: This analysis is for educational and informational purposes only. It is not financial advice. Please conduct your own research before trading.

BTC/USDT | Bull or Bear ? (READ THE CAPTION)By analyzing the #Bitcoin chart on the weekly timeframe, we can see that price continued its bullish expansion and successfully rallied up to the $71,300 level. After this strong move, Bitcoin is currently trading around the $68,500 area, which can be considered a healthy corrective phase within the broader uptrend.
All previous assumptions of the analysis remain valid. As long as price holds above the key $66,000 demand zone, the bullish structure stays intact, and we can expect further upside once consolidation is completed. The recent pullback does not invalidate the bullish scenario and instead supports a continuation-based setup.
This chart will continue to be updated step by step as price reacts to key levels.
Please support me with your likes and comments to motivate me to share more analysis with you and share your opinion about the possible trend of this chart with me !
Best Regards , Arman Shaban

Elise | BTCUSD · 30M – Bearish Structure With PullbackBITSTAMP:BTCUSD
Bitcoin broke structure to the downside and printed a fresh lower low near 66.5K. The current bounce appears corrective, not structural reversal. Unless price reclaims and holds above 68.6K, continuation toward the lower demand zone remains the higher-probability scenario.
Key Scenarios
❌ Bearish Continuation 📉 → 🎯 Target 1: 66,200 → 🎯 Target 2: 65,600
✅ Bullish Reclaim 🚀 → Break & close above 68,600 shifts short-term bias toward 69,800–70,000
Current Levels to Watch
Resistance 🔴: 68,400 – 68,600
Support 🟢: 65,400 – 65,800
⚠️ Disclaimer: For educational purposes only. Not financial advice.

BULLISH SCENARIO - BITCOINHello traders ,
The Bitcoin price is currently trading within a descending channel structure.
Let’s consider the bullish scenario :
If the market breaks and closes above the resistance trendline, this would signal a potential shift in momentum and open the door for a bullish move.
🎯 Target: 72,850.00
As always, wait for a confirmed breakout before considering entry.

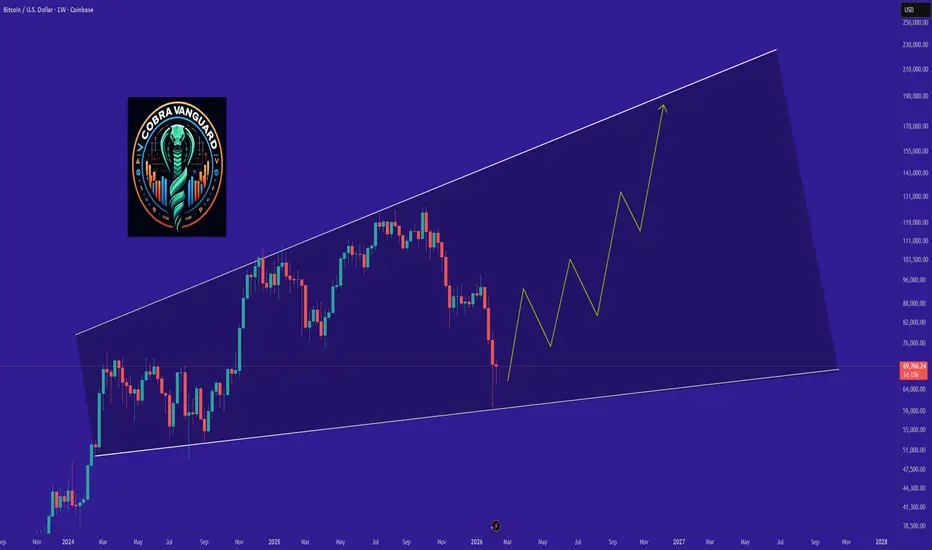
BTCUSDPrice has reached the bottom of the wedge, and now it’s time for it to move toward the top of the wedge. This move could take several months to complete.
How Prop Firm Rules Quietly Shape Your Trading BehaviorProp firm rules are usually framed as simple risk controls. Daily drawdowns, maximum loss limits, and consistency requirements appear straightforward on paper. In practice, they do much more than protect capital. They subtly reshape how traders think, feel, and behave in the market.
Every decision inside a funded account is made under the awareness of a hard stop. Losses are not just part of the distribution. They are existential. This creates a constant background pressure that influences execution. Traders hesitate to take valid setups after an early loss, even when conditions are favorable. Others rush into trades to recover equity before the day ends. These reactions are often misdiagnosed as psychological weakness, when they are actually rational responses to the structure.
Daily loss limits are a clear example. They encourage caution, but they also compress decision-making into shorter time windows. Traders may avoid higher-quality setups later in the session because they no longer have room for normal variance. The result is fewer trades taken from fear, or lower-quality trades taken out of urgency.
Trailing drawdown rules add another layer. As equity rises, so does the level at which failure occurs. This encourages early profit-taking and discourages holding positions through normal pullbacks. Traders begin to optimize for equity protection rather than trade quality. Over time, this conditions behavior that may not translate well outside the prop environment.
Consistency rules also influence strategy selection. Traders gravitate toward lower volatility approaches, smaller targets, and frequent trades to smooth equity curves. These choices are logical within the ruleset, but they are responses to constraints rather than pure edge.
Understanding this dynamic is critical. Prop firm performance is not only about strategy and discipline. It is about adapting to an incentive structure. Traders who recognize how rules shape their behavior can adjust expectations, execution, and self-assessment more accurately. The problem is rarely the trader. It is often the environment quietly steering their decisions.

Elise | BTCUSD · 30M – Range Support ReactionBITSTAMP:BTCUSD
After the sharp sell-off and liquidity sweep, BTC rebounded strongly and entered a consolidation phase. The market is now retracing from the range high back into support. This behavior suggests a healthy correction rather than trend failure. As long as price holds above the demand zone, continuation toward range highs remains favored.
Key Scenarios
✅ Bullish Case 🚀 → 🎯 Target: 71,500 – 72,000
❌ Bearish Case 📉 → A strong breakdown and acceptance below 64,600 – 64,400 would invalidate the bullish setup and expose deeper downside.
Current Levels to Watch
Resistance 🔴: 71,500 – 72,000
Support 🟢: 64,600 – 64,400
⚠️ Disclaimer: For educational purposes only. Not financial advice.
