Gold - XAUUSD - Double Butterfly Harmonic PatternsOn 4 hr time frame, two Butterfly harmonic patterns have been drawn. Both are more than 90% compliant to standard values.
Now if price goes up crossing first minor resistance at 4595~4505 region then it is most likely to test 4630~4650. RSI also suggesting upward momentum.
If price is dropped from this resistance then we might see a very deep retracement up to 3940~3920; which I personally do not find acceptable on fundamental's grounds.
Butterfly

USDJPY Butterfly Flight on Christmas DaysUSDJPY is projected to drop from 157.3, targeting TP 1-3, as indicated by the confirmed Butterfly harmonic pattern signaling bearish momentum.

Elloit wave ETH 1/5/2026Initially, I thought that the wave count from wave(i) to wave(ii) might be wave C, completing the correction in the scinario that wave 4 is not end yet. However, upon reconsideration, the recent downward pressure can also be counted as an impulsive wave i, and it appears too steep to be a corrective move.
Another supporting factor is that the price action following this downward move is clearly corrective, forming a very complex wave structure. The Deep Crab harmonic pattern suggests a reversal zone around 3,180–3,190, which aligns closely with the recent reversal point. This wave count also indicates that wave 4 is nearing completion.
The projected target for wave (v) is around 2,400, supported by butterfly harmonic projections and coinciding with a strong support zone.
The invalidation level for this scenario is a break above 3,330 since wave (ii) should not break above 0.8 retace ment of wae (i).In that case ,ETH wave 4 will not finish yet but the reversal should be soon reaveled


Elloit wave ETH 12/18/2025My outlook on ETH remains bullish, but it differs from my previous analysis. Initially, I thought the red wave b was an impulsive wave C or wave 1, signaling the start of a new downward trend. However, upon closer examination, the wave structure appears too irregular to be an impulse wave.
After the recent downside pressure passed, ETH’s price action has turned notably bullish. Price first tested a strong resistance level and then formed a triangle pattern, which I interpret as wave b. This wave b retraced nearly 80% of wave a, increasing the probability that wave c could form an expanded flat correction.
If this scenario plays out, the target for wave 2 would be around 3,900–4,000, which also coincides with a strong resistance zone. This target is further supported by a Butterfly harmonic pattern and aligns closely with the 0.618 Fibonacci retracement of the major wave 1.
That said, it is important to note that there is still a possibility that ETH has already completed its correction and may continue to move downward. This scenario should be monitored closely.

State Street Corporation (STT) – Short Setup Technical AnalysisState Street Corporation (STT) – Short Setup Technical Analysis
State Street Corporation is currently trading well outside the 3rd Anchored VWAP band, indicating a pronounced overextension away from fair value and a high probability of mean reversion. Price acceptance at these levels is typically unstable, particularly in the absence of accelerating volume.
This extension coincides with the completion of a bearish Butterfly harmonic pattern, a structure that frequently marks terminal moves and exhaustion within an advance. The Butterfly completion zone defines a technically relevant area where upside continuation becomes increasingly asymmetric.
From a tactical standpoint, the setup favors a short positioning on rejection, rather than trend continuation. Any failure to maintain acceptance above the upper VWAP band would confirm loss of bullish control and increase the likelihood of a rotation back toward the Anchored VWAP and prior value area.
Bias: Short on rejection outside the 3rd VWAP band
Target: Mean reversion toward Anchored VWAP
Invalidation: Sustained acceptance above the Butterfly completion zone
Context: Bearish Butterfly completion + VWAP overextension = high-probability short setup

DXY Butterfly & December NewsIn this video, we focus on forecasting the future trend of the Dollar Index just hours before the release of key economic data, including:
- Core Retail Sales m/m
- Non-Farm Employment Change
- Retail Sales m/m
- Unemployment Rate
Our analysis is based on candlestick formation patterns combined with harmonic patterns.
The ideal Butterfly pattern notably indicates an upward trend in the Dollar Index toward the Order Block Zone.

GOLD SHORT SELL VIEW
Hello Traders, here is the full analysis for this pair,
let me know in the comment section below if you have any questions,
the entry will be taken only if all rules of the strategies will be
satisfied. I suggest you keep this pair on your watch list and see if
the rules of your strategy are satisfied.
Dear Traders,
If you like this idea, do not forget to support it with a like and follow.
PLZ! LIKE COMMAND AND SUBSCRIBE

EURUSD - we got what we wantedFurther to my previous idea on EURUSD - the price has (most likely) respected the Resistance and started to complete the Butterfly Pattern.
So now, hand off the computer and wait. Or perhaps go out for some Black Friday Shopping! We have just earned some $ for it :)
Just my humble opinion

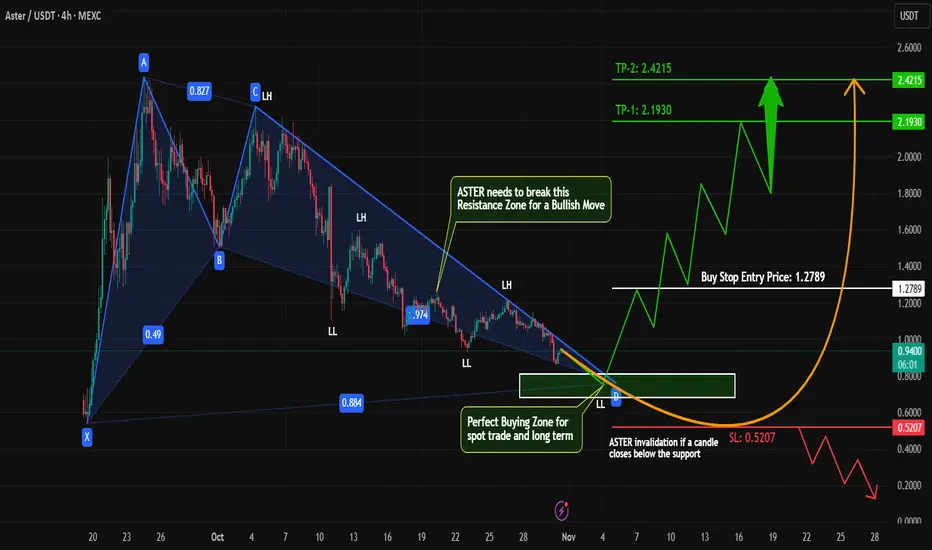
ASTER – Strong Long-Term Investment Setup | Harmonic Pattern#ASTER is one of the strongest and most promising new projects in the market right now. The price action is setting up beautifully for a potential long-term bullish move.
Technical Outlook (4H Timeframe):
#ASTER is currently forming a bullish harmonic pattern, and the final leg of this structure is about to complete soon — around the current market price (CMP) or within the 0.8115 – 0.7000 zone.
Trade Plan:
→ Buy Zone: 0.8115 – 0.7000
→ Enter 50% position in this zone.
→ Remaining 50% after a confirmed break above resistance at 1.2150 – 1.2800.
Alternative Scenario:
If #ASTER doesn’t retrace to the 0.8115–0.7000 zone and instead breaks the 1.2150–1.2800 resistance, we’ll place a buy stop order above that level to catch the breakout move.
Why #ASTER?
Fundamentally strong new project
Technical showing high probability bullish setup
Perfect long-term accumulation levels forming
Always use proper risk management — this is key to long-term success.
What’s your view on #ASTER? Do you think it’ll bounce from the harmonic completion zone or break out early? Drop your thoughts below!
#ASTER #CryptoAnalysis #HarmonicPattern #TradingSetup #LongTermInvestment #Altcoins #CryptoTrading #BullishSetup #TechnicalAnalysis
Btc abcdSo this is like seeing into the future. Impossible you and I will agree. Harmonics should never be traded till they complete, or so they say.
Anyways the chart shows an incomplete AB=CD. A pitchfork.
Just an idea please don't take as gospel.

Corn butterfly Been bullish on corn 🌽 for a good while. This is long term harmonic pattern that made me that way. The bottom which recently occurred was marked by three distinct doji type candles. Really believe commodity supercycle is very close. Oil, corn , metals obviously 🙄.

$103,000 Support is Your Next Long Entry!The chart shows a Bearish Harmonic Pattern (D point completed near $107,000), indicating the recent bullish momentum needs a rest.
We anticipate a short-term pullback following the completion of this pattern.
The target for this drop is the key support area (green box) around $103,000 - $103,500.
OBV also shows Bearish Divergence (price up, indicator down), which strongly supports the idea of a temporary pullback.
Wait for the price to hit the $103,000 support zone.
Look to enter a LONG trade from the $103,000 - $103,500 area for the next major leg up. This is the main opportunity!
Good Luck!

BTC HARMONICSBtc 1M fractal close. 102400 ish.
Two harmonics one up one down.
See how price reacts see which is victorious.
112500 upper target if we go up.

GBPJPY BEARISH SETUPGBP/JPY moving higher within a corrective leg; prime resistance is located at 201.96
The rally was sold in the dip was bought resulting in GBP/JPY closing the day little net changed. We've seen mild upside momentum overnight.
With the single currencies expected to move in the same direction, I would expect continued volatile price action.
From a technical perspective, we are currently at the equilibrium zone. Further upside barriers are seen at 201.93 and 201.96.
Conclusion: there is scope to build a Butterfly formation. This would suggest that intraday rallies are sold. 201.96 is prime resistance.

EURUSD - performing the correctionFurther to my previous idea on EURUSD. The price respected the Buttfly Pattern and started the correction. Nor the price got to the First Resistance, where I expect a correction, then it will continue to the Main Resistance at 1.16300. There I expect the price to return to downtrend and continue to 1.12500.
Just my humble opinion

USDCAD - At ResistanceUSDCAD is just approaching a Resistance Cluster and completing the Butterfly Harmonic Pattern at 1.4146-1.4166. This is in line with the situation on EURUSD, GBPUSD and USDJPY.
I expect the price to perform a correction down to 1.3914 and then revert to uptrend.
Just my humble opinion

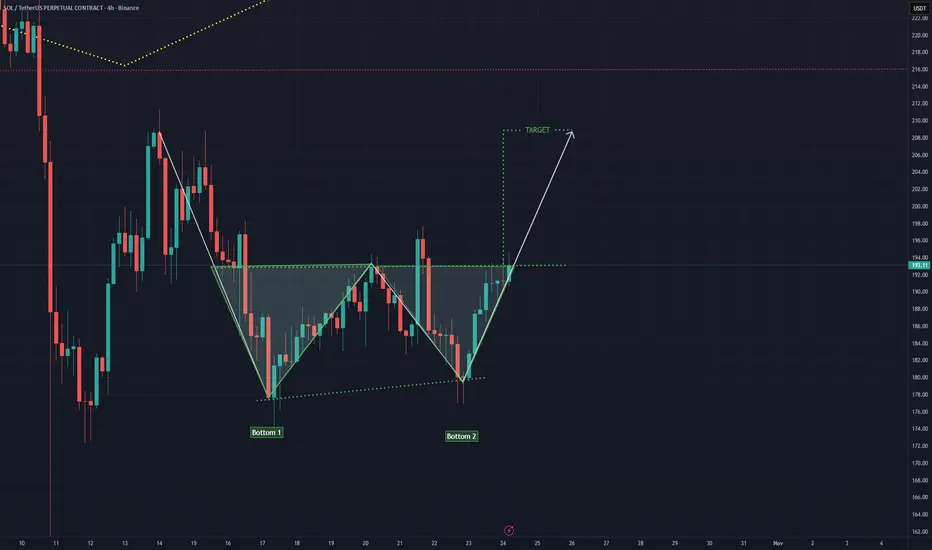
SOL 4H CRYPTOCAP:SOL 4H Chart
Solana forming a clear Double Bottom pattern signaling a potential trend reversal after the recent pullback.
Price is testing the neckline resistance, and a breakout above could confirm bullish continuation toward the projected target zone.
If confirmed, this setup suggests strong bullish momentum building for $SOL.
#SOL #Solana #Crypto #PriceAction #TradingView
DXY MAX BUTTERFLYThe pattern is as title says a max butterfly. The xd ratio should be between 1.272 and 1.618. Risky short taken, maybe some relief on the shitcoins. 97.5 is obvious target.

EURUSD Forecast: Structure Break + Butterfly Pattern OpportunityHey guys, in today’s video I want to start here on the EURUSD and walk you through my 4-step analysis process I call IPDE, which stands for Identify, Predict, Decide, Execute.
We’re going to start by identifying that price recently violated a key level of structure, and from there, make the prediction that we could see price continue lower. Personally, when I’m looking to catch potential extensions, I like to wait for a pullback, and our previous structure level looks like a great area to watch for one.
And for those of you who trade advanced patterns, we’ve also got a nice Butterfly Pattern setting up that could provide an opportunity for longs.
If you have any questions or comments, please leave them below & I wish you a great upcoming week in the markets
Akil

EURUSD - intraday - Butterfly PatternFurther to the previous idea on EUR, what I can see is a completing Butterfly Pattern with D-point at 1.15 (what corresponds with the W1 perspective)
I expect a correction from that point, potentially up to 1.16-1.16250 and then continuation of the downtrend.
Just my humble opinion

Gold Bullish Butterfly Forming – Reversal Ahead?As I expected in the previous idea , Gold started declining from the Resistance zone($4,192 – $4,137) and has now reached the Support zone($4,004 – $3,895) — full target achieved .
At the moment, Gold is moving within that Support zone($4,004 – $3,895) and Potential Reversal Zone(PRZ) .
Looking at the 1-hour time frame , we can spot a Bullish Butterfly Harmonic Pattern forming, which is likely to complete right in that PRZ .
I expect that in the coming hours, once Gold enters the PRZ , it could rise at least up to around $4,057(First Target) .
Second Target: $4,132
Stop Loss(SL): $3,889(Worst)
Please respect each other's ideas and express them politely if you agree or disagree.
Gold Analyze (XAUUSD), 1-hour time frame.
Be sure to follow the updated ideas.
Do not forget to put a Stop loss for your positions (For every position you want to open).
Please follow your strategy; this is just my idea, and I will gladly see your ideas in this post.
Please do not forget the ✅ ' like ' ✅ button 🙏😊 & Share it with your friends; thanks, and Trade safe.

$BTCUSD Harmonic Butterfly Completion at $118K+This harmonic butterfly pattern can take us to $118K+, also reaching the next line on the fork. Shorts will probably pile in at that level together with profit-taking from longs should drive prices down. Not sure how deep it'll be.
