GBPUSD: Buy With the Uptrend_Prioritize Pullbacks Toward 1.3350In the current environment, GBPUSD holds a clear advantage as USD weakness follows a dovish tone and expectations of U.S. rate cuts , allowing counterpart currencies like GBP to maintain higher price levels. On the UK side, the market still carries concerns about potential BoE easing ahead; however, in the short term, USD weakness remains the dominant driver , especially in the absence of any unexpected negative UK data .
From a technical perspective, the structure appears clean and constructive : price is moving within an ascending channel and continues to print higher highs and higher lows. The 1.3350 area is marked as immediate support—a key pivot zone to look for buy-on-pullback opportunities . On the upside, 1.3430 stands as near-term resistance, where the market may pause or take profit before attempting a broader breakout.
The preferred scenario is to BUY on pullbacks : wait for price to retrace toward 1.3350 and observe price action (bearish rejection, trendline/channel hold). If this level holds, GBPUSD has a solid basis to retest 1.3430 in the near term. Conversely, a clear break below 1.3350 would signal a loss of bullish momentum, warranting greater caution on new long positions.
In summary , the fundamental backdrop favors buyers and the technical picture confirms the uptrend. The key now is not to chase price, but to stay patient, wait for a quality pullback, and let the market reward disciplined execution.
Buy!!

CCL Carnival Corporation Options Ahead of EarningsIf you haven`t bought CCL before the rally:
Now analyzing the options chain and the chart patterns of CCL Carnival Corporation prior to the earnings report this week,
I would consider purchasing the 30usd strike price Calls with
an expiration date of 2026-3-20,
for a premium of approximately $1.53.
If these options prove to be profitable prior to the earnings release, I would sell at least half of them.

USDCAD Is Bullish! Buy!
Here is our detailed technical review for USDCAD.
Time Frame: 1D
Current Trend: Bullish
Sentiment: Oversold (based on 7-period RSI)
Forecast: Bullish
The market is trading around a solid horizontal structure 1.377.
The above observations make me that the market will inevitably achieve 1.395 level.
P.S
We determine oversold/overbought condition with RSI indicator.
When it drops below 30 - the market is considered to be oversold.
When it bounces above 70 - the market is considered to be overbought.
Like and subscribe and comment my ideas if you enjoy them!

NG1! BULLS ARE GAINING STRENGTH|LONG
NG1! SIGNAL
Trade Direction: long
Entry Level: 4.099
Target Level: 4.647
Stop Loss: 3.733
RISK PROFILE
Risk level: medium
Suggested risk: 1%
Timeframe: 6h
Disclosure: I am part of Trade Nation's Influencer program and receive a monthly fee for using their TradingView charts in my analysis.
✅LIKE AND COMMENT MY IDEAS✅

USD/CHF BUYERS WILL DOMINATE THE MARKET|LONG
Hello, Friends!
The BB lower band is nearby so USD-CHF is in the oversold territory. Thus, despite the downtrend on the 1W timeframe I think that we will see a bullish reaction from the support line below and a move up towards the target at around 0.801.
Disclosure: I am part of Trade Nation's Influencer program and receive a monthly fee for using their TradingView charts in my analysis.
✅LIKE AND COMMENT MY IDEAS✅

NZDUSD: Dollar Weakness Meets Trend Support!!Hey Traders,
In today’s trading session, we are monitoring NZDUSD for a potential buying opportunity around the 0.57800 zone.
Technical structure:
NZDUSD remains in a well-defined uptrend and is currently undergoing a healthy corrective phase, pulling back toward the 0.57800 area — a key zone of confluence where trend support and prior demand overlap. This level represents a high-interest area for trend continuation if buyers step back in.
Macro backdrop:
On the fundamental side, the US Dollar continues to face headwinds. Recent data points to a cooling US labor market, increasing sensitivity around upcoming releases. With the Fed already having delivered a rate cut, any further signs of economic softening increase the probability of additional policy easing, keeping the USD vulnerable on rallies.
This broader bearish USD environment strengthens the bullish case for NZDUSD, particularly when aligned with a supportive technical structure.
What to watch:
Price reaction around 0.57800 will be key — sustained demand here could open the door for a continuation toward recent highs.
Trade safe,
Joe

AUDJPY Is Very Bullish! Long!
Please, check our technical outlook for AUDJPY.
Time Frame: 1h
Current Trend: Bullish
Sentiment: Oversold (based on 7-period RSI)
Forecast: Bullish
The market is on a crucial zone of demand 102.249.
The oversold market condition in a combination with key structure gives us a relatively strong bullish signal with goal 102.716 level.
P.S
Please, note that an oversold/overbought condition can last for a long time, and therefore being oversold/overbought doesn't mean a price rally will come soon, or at all.
Like and subscribe and comment my ideas if you enjoy them!

GOLD Is Bullish! Buy!
Take a look at our analysis for GOLD.
Time Frame: 4h
Current Trend: Bullish
Sentiment: Oversold (based on 7-period RSI)
Forecast: Bullish
The market is approaching a significant support area 4,188.16.
The underlined horizontal cluster clearly indicates a highly probable bullish movement with target 4,233.29 level.
P.S
Overbought describes a period of time where there has been a significant and consistent upward move in price over a period of time without much pullback.
Like and subscribe and comment my ideas if you enjoy them!

BITCOIN Is Very Bullish! Long!
Take a look at our analysis for BITCOIN.
Time Frame: 1h
Current Trend: Bullish
Sentiment: Oversold (based on 7-period RSI)
Forecast: Bullish
The market is testing a major horizontal structure 90,218.38.
Taking into consideration the structure & trend analysis, I believe that the market will reach 91,478.05 level soon.
P.S
Overbought describes a period of time where there has been a significant and consistent upward move in price over a period of time without much pullback.
Like and subscribe and comment my ideas if you enjoy them!

USOIL BULLISH BIAS RIGHT NOW| LONG
USOIL SIGNAL
Trade Direction: long
Entry Level: 57.53
Target Level: 59.96
Stop Loss: 55.93
RISK PROFILE
Risk level: medium
Suggested risk: 1%
Timeframe: 1D
Disclosure: I am part of Trade Nation's Influencer program and receive a monthly fee for using their TradingView charts in my analysis.
✅LIKE AND COMMENT MY IDEAS✅

Clean vs Trap Pullbacks — Don’t Get FooledIn trading, a pullback can be an opportunity…
but it is also one of the most common traps that causes traders to lose money.
Some pullbacks allow you to enter with low risk, clean RR, and follow the trend smoothly.
Others look perfectly reasonable… until the market reverses and wipes out your stop loss.
So how do you tell a clean pullback from a trap pullback?
1. Clean Pullback – A Pause Before Continuation
A clean pullback is a healthy correction within a strong, intact trend.
Think of it as the market catching its breath before the next push.
Key characteristics of a clean pullback:
◆ The main trend remains clear
Higher highs – higher lows (uptrend)
Lower lows – lower highs (downtrend)
◆ The retracement is weaker than the impulse move
Smaller candles, shorter bodies, long wicks
No structural break
◆ Volume decreases during the pullback
Selling (or buying) pressure is not aggressive
The market is simply “resting”
◆ Price pulls back into a logical area
Previous support/resistance
Structural zones
Common Fibonacci levels (38.2 – 50 – 61.8)
👉 A clean pullback does not damage the trend’s integrity — it only tests it.
2. “Trap” Pullback – Looks Like a Retracement, Acts Like a Reversal
Trap pullbacks usually appear after a trend has extended too far or when momentum starts to fade.
They make traders think:
“It’s just a normal pullback…”
But in reality, smart money is already distributing.
Signs of a trap pullback:
◆ Trend strength is clearly weakening
New highs fail to exceed previous highs
Previous lows start getting broken
◆ The retracement is strong and aggressive
Large-bodied candles closing deep
Price moves confidently against the trend
◆ Volume increases during the pullback
This is no longer a technical retracement
Real money is changing direction
◆ Market structure breaks
Key highs/lows are violated
Break → retest → continuation in the opposite direction
👉 Trap pullbacks exploit a trend trader’s overconfidence.
3. A Common Mistake: “Price Pulls Back = Enter Trade”
Many traders don’t lose because of bad analysis,
but because they enter too early.
Familiar thoughts:
“It pulled back to support — buy.”
“The trend is still bullish.”
“That candle is just a retracement.”
But the market doesn’t care what you think.
It only cares about where the money is flowing.
4. How to Avoid Trap Pullbacks – Survival Rules
If you remember these three rules, you’ll avoid most pullback traps:
◆ Never enter just because price pulls back
Wait for confirmation:
rejection candles
small break & retest
clear reaction at structure
◆ Always check market structure first
Is the structure intact or broken
Are key highs/lows still respected?
◆ Compare impulse vs retracement
Strong impulse – weak pullback → trend is alive
Strong pullback – weak impulse → reversal risk
XAUUSD: Bullish Momentum StrengthensGold is entering a highly promising bullish phase as the market shifts strongly to the buy-side following the Fed’s decision to cut interest rates. The emerging risk-on sentiment aligns perfectly with a technical setup that is paving the way for a potential breakout — creating an exceptionally attractive environment for traders in the coming days.
1. Fundamental Drivers Supporting Gold’s Uptrend
• The Fed cut rates by 25 bps, something the market had been waiting for weeks. This immediately pushed the USD down to its lowest level in eight weeks.
• With a weaker USD, gold becomes cheaper for global buyers → strong inflows into XAUUSD.
• President Donald Trump continues to support low interest rates, a long-term policy signal that reinforces expectations that gold still has room to rise.
• Markets are now watching the December 16 NFP report, but given the current backdrop, this data will likely bring short-term volatility rather than change the broader bullish trend.
=> The macro landscape is clearing the path for gold to continue rising in the mid-term.
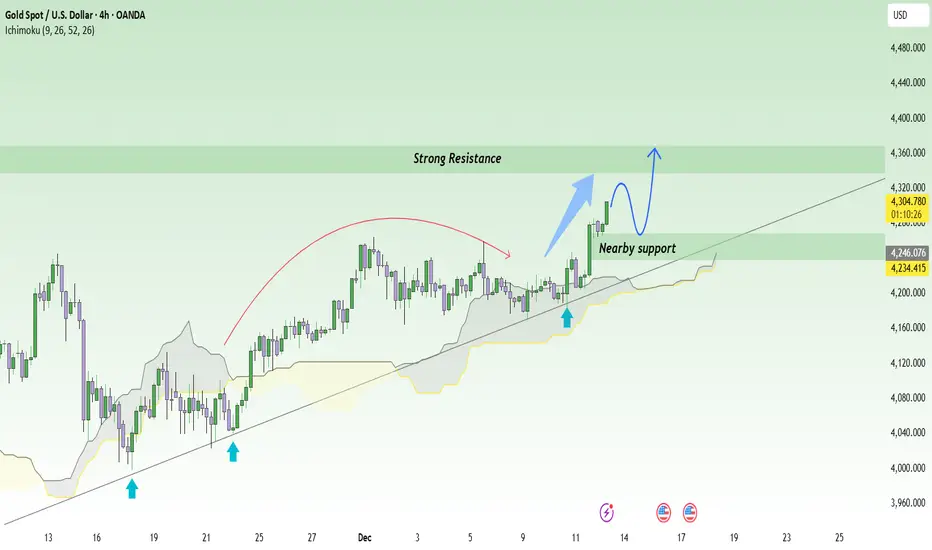
2. Technicals: Gold Holds Its Uptrend and Is Approaching Strong Resistance
Looking at the chart:
• XAUUSD is maintaining its position above the ascending trendline established since mid-November.
• Each time price touched the trendline, it bounced sharply — showing that buyers remain active.
• The nearby support at 4,270 is acting as a strong dynamic floor.
• Price is now approaching a major resistance zone at 4,360 – 4,370. With the current momentum, the likelihood of a slight pullback followed by a breakout is very high.
• If the breakout succeeds, the next target sits around 4,400 – 4,420.
=> A clean uptrend structure, nearby support, and strong momentum — buyers are fully in control.
3. Suggested Trading Setup
Prioritize buying with the trend.
Wait for a potential retest at 4,270 – 4,290 for an optimal entry.
A break above 4,370 will serve as a confirmation signal to scale in further.
BTC Isn’t FOMO — But It’s Not Ready to Drop EitherIf we look at BTC right now as a tug-of-war, the buyers are winning slightly — and consistently . Recent news continues to support a moderate risk-on environment , institutional capital has not exited Bitcoin , and the market lacks a shock strong enough to trigger a deep sell-off. As a result, the most reasonable scenario over the next 1–2 days is a gradual, controlled upside rather than a sharp vertical breakout.
From a technical perspective, the overall trend still leans bullish . Price is holding above a rising trendline and continues to find support on pullbacks. The 90,000 level stands out as a key psychological support and has repeatedly acted as a reliable base for rebounds. Ichimoku analysis shows price hovering around short-term equilibrium, suggesting the current move is more about accumulation and slow continuation than an aggressive rally.
The plan for a mild bullish bias is clear: prioritize BUY setups on pullbacks toward the 90,000–90,300 zone, especially if price shows strong holding behavior. If BTC regains momentum and stabilizes above this area, the next upside target sits near 94,000 as the upper resistance zone. Conversely, a clean break below 90,000 would weaken the bullish-light scenario and increase the likelihood of a deeper pullback for renewed accumulation.
In short, BTCUSDT is in a healthy, moderate bullish phase — not euphoric , but structurally supported. The real question now isn’t “will it go up?”, but rather: will you wait for a clean pullback to 90,000 for a safer entry, or step in as price starts pushing higher?

XAUUSD in Uptrend, Awaiting Technical PullbackHi everyone, Domic here. Let’s take a closer look at gold today!
Overall, both news and technicals favor buyers. Gold has surged to around $4,270/oz, up $32 from yesterday, reaching its highest level in over a month. The Fed’s 0.25% rate cut, lowering the benchmark to 3.5–3.75%, has clearly weakened the USD — a positive catalyst for gold. Meanwhile, silver also hit a new high around $64.22/oz. According to Edward Meir, silver’s strong momentum is lifting gold and other precious metals, signaling a return of capital to safe-haven assets.
Looking ahead, the market eyes the Nonfarm Payrolls report on December 16 for clues on the next rate moves. Discussions over the next Fed chair, with front-runner Kevin Hassett supporting rate cuts, further strengthen expectations of a prolonged low-rate environment, keeping gold in a favorable position among safe-haven assets.
On the H4 chart, XAUUSD’s uptrend is clear. Price sits above both EMAs, with the short EMA (red) near 4,221 and the long EMA (blue) near 4,188, confirming the medium–long-term uptrend. The recent breakout pushed gold to 4,270–4,280 with rising volume, indicating active buying rather than a random spike. However, the gap between price and the short EMA is wide, making a technical pullback likely.
Preferred scenario:
Gold may retrace to a nearby support zone before resuming its uptrend. The first support is around 4,240–4,250, where price previously consolidated before the breakout — a potential shallow pullback before bouncing higher.
If selling intensifies, the 4,220–4,225 zone near the red EMA offers a good retest point, aligning with the broken resistance. In a stronger pullback, the long EMA (blue) near 4,188 acts as the next safety net, preserving the medium-term uptrend.
→ As long as price stays above this zone on H4, any dips are just pullbacks within the uptrend.
Wishing you successful trades!

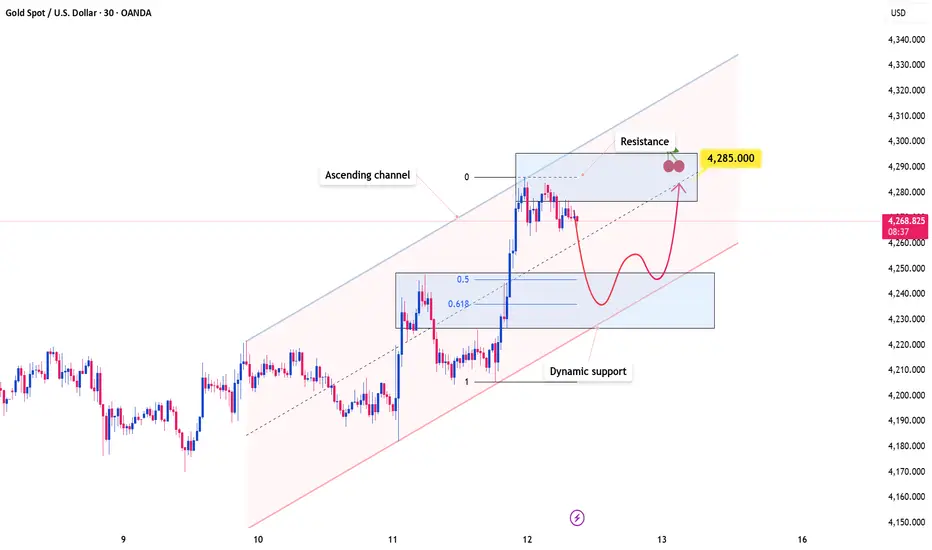
Gold Holds a High Ground While the Market Reprices RiskOANDA:XAUUSD continues to trade within a well-defined ascending channel, with price action consistently respecting both the upper and lower boundaries. This structure highlights strong bullish control, suggesting that buyers remain firmly in charge and that upside continuation is still favored.
Price has recently broken above a key resistance zone and may return to retest this level. If it holds as support, it would further validate the bullish structure and significantly increase the probability of a move toward the 4,285 target. This level aligns closely with the midline of the ascending channel as well as a previous resistance area, reinforcing its technical importance.
As long as price remains above this support zone, the bullish outlook stays intact. However, a failure to hold this level could weaken the current structure and open the door for a deeper pullback toward the lower boundary of the channel.
On the fundamental side, gold’s recent surge has been driven by an unexpected shift from the U.S. Federal Reserve toward monetary easing, including a return to bond purchases. This move pressured the U.S. dollar and effectively removed prior concerns over a prolonged hawkish policy stance, prompting renewed inflows into gold.
While short-term pullbacks remain possible due to overbought conditions, the broader trend continues to look constructive, supported by ongoing central bank buying and sustained demand for safe-haven assets.
Gold Bear Flag Ready for a Bullish BreakoutHello everyone, Helene here! XAUUSD is currently showing a more positive outlook as price structure starts shifting into a bullish direction.
The latest market interaction is particularly interesting. We’re seeing an early recovery phase, weakening bearish momentum, and low-volume candles suggesting seller exhaustion. This often acts as an early signal for a potential bullish move developing.
Based on the current pattern, my target is around 4,330 – a reasonable level aligned with the market structure. Should price continue in this direction, the next move could become a beautiful extension of the bullish story in Gold we’ve been following.
This setup looks very appealing. It’s a developing scenario, although it still requires patience and proper confirmation before fully validating the upside.
Even though a bearish scenario is still possible due to the clear support zone below, I personally lean toward additional bullish continuation as the pattern forming here supports that outlook.
Wishing you a successful trading session and the best of luck.

Gold’s Next Big Move: 4,350 Is Within Reach!Hello everyone, it's Helene here!
Gold is looking pretty interesting right now. As mentioned in the previous analysis, the price shot up. But guess what? Right now, it's slightly pulling back, moving in the opposite direction to the previous uptrend, which looks like a familiar bullish flag pattern. In this case, there's a scenario that could play out, and considering the market conditions are still bullish, I'm leaning toward the possibility that the price will break the flag pattern to the upside.
My target is 4,350.
Do you agree? Leave a comment below. Joining the TradingView community is always helpful to improve and develop your trading skills.

An Urgent Warning to ALL Traders & InvestorsWhat in the world just happened to the market today? NASDAQ:QQQ AMEX:SPY AMEX:IWM
That’s exactly what we’re breaking down—calmly, logically, and from an investor’s perspective.
In this video, I walk through the major indexes ( NASDAQ:QQQ , AMEX:SPY , and AMEX:IWM ) across multiple timeframes to explain the pullback, what *could* be driving it (macro fears, rates, inflation/GDP concerns), and the two paths the market may take next.
We also cover the VIX spike (but still at relatively low levels), COR3M/market stress, and what I’m seeing in crypto (BTC and ETH) as part of the broader “risk-on/risk-off” puzzle.
The key takeaway: this is a choppy “kangaroo market.” I lay out the bullish bounce scenario vs. the bear structure scenario, and the specific levels that would confirm either direction—so you can stay prepared, not emotional.
Not Financial Advice - DYOR

NPLNPL Stock – Trade Plan
Fundamentals:
Revenue growth supported by Omoda, Jaecco J6 & J7 launches.
Margins stable, cash strong, debt manageable.
EPS YoY disappointing → caution on fundamentals. Can turn around due car sales
Technical:
Pattern: Head & Shoulders + Cup & Handle.
Breakout confirmed.
Wait for retrace to zone 1 and 2 → take entry on HL
Stop-loss: below recent swing low.(if trading)
Target: 1:1:2 or use TP mentioned in charts. Book profits timely.
Notes:
Weak EPS may pressure price; vehicle sales are a short-term catalyst.
Monitor retrace volume for strong support confirmation.

AUD/CHF LONG FROM SUPPORT
Hello, Friends!
AUD/CHF pair is in the uptrend because previous week’s candle is green, while the price is evidently falling on the 4H timeframe. And after the retest of the support line below I believe we will see a move up towards the target above at 0.536 because the pair is oversold due to its proximity to the lower BB band and a bullish correction is likely.
Disclosure: I am part of Trade Nation's Influencer program and receive a monthly fee for using their TradingView charts in my analysis.
✅LIKE AND COMMENT MY IDEAS✅

EURUSD EURUSD had a bounce up early morning and got rejected by Friday highs a little later.
EURUSD finding some resistance in the upper green zone.
Looking at how EURUSD reacts and will try to anticipate a move!
Let me know what you think!
Stay safe out there and do your own due diligence, this is not investment advise!

USOIL Is Very Bullish! Buy!
Here is our detailed technical review for USOIL.
Time Frame: 1h
Current Trend: Bullish
Sentiment: Oversold (based on 7-period RSI)
Forecast: Bullish
The market is approaching a significant support area 57.360.
The underlined horizontal cluster clearly indicates a highly probable bullish movement with target 58.090 level.
P.S
Overbought describes a period of time where there has been a significant and consistent upward move in price over a period of time without much pullback.
Like and subscribe and comment my ideas if you enjoy them!

GBP/CAD BULLS ARE GAINING STRENGTH|LONG
GBP/CAD SIGNAL
Trade Direction: long
Entry Level: 1.840
Target Level: 1.844
Stop Loss: 1.838
RISK PROFILE
Risk level: medium
Suggested risk: 1%
Timeframe: 1h
Disclosure: I am part of Trade Nation's Influencer program and receive a monthly fee for using their TradingView charts in my analysis.
✅LIKE AND COMMENT MY IDEAS✅
