MSTR buy setup to 260. 200% profit via 2x daily bullish ETF MSTXtrade setup is for 200% profit from current price, swing trade to 12$ range as MSTR has strong buy rates for active buy sequence to 260 over upcoming 8-12 wks.
take profit on MSTX when MSTR reaches 260-280 levels, or when MSTX reaches approx 12$ for 200% gains.
thank me later
Buysetup

LONG ON AUD/JPYThe Jpy Index pushed up on Friday but is now starting to retrace/pullback/correct or fall.
We have a nice choc (change of character) from down to up on AJ on the 15min timeframe.
I expect price to drop first to 106.392 then rise.
This is a buy limit order. I will be looking to catch 100-200 pips.

EURUSD H4 Buy Setup Structure Buy Side CHOCH EURUSD On the H4 timeframe, EURUSD market structure is bullish, with multiple BOS (Break of Structure) confirming the uptrend. A buy-side CHOCH has already formed, and price has respected the bullish trendline. Additionally, a strong bullish order block is holding, indicating potential for further upside continuation.
Trade Plan: Entry: 1.16872
Target 1: 1.17700 Final Target: 1.18600 Stop Loss: 1.16200
Disclaimer:
This analysis is for educational purposes only. It is not financial advice. Trading involves risk, so always do your own research and manage risk properly before taking any trade.

Buy DellHey Trading Fam,
Pretty simple. My Pivot Zones indicator has given me a "BUY" signal here, and so, I am buying. The technicals do support the indication. You can see, we are very oversold into that orange 350 SMA. Additionally, high-volume trading days have been supporting price moves to the upside. These are very good signs that support another great "BUY" alert from my indicator. The indicator will be released for use once beta testing is completed by the end of February.
✌️Stew

LONG ON EUR/USDEUR/USD has retraced into a nice FVG after giving us a choc (change of character) from down to up.
The dollar (dxy) is bearish which correlates with EU rising.
I will be buying EU looking to catch 100-150 pips to the next swing high.

XAUUSD Bullish Structure – BUY Setup Toward 4530 & 4560Price has broken above the trendline and is holding above the support zone at 4,485–4,495, where former resistance has now turned into support. As long as price stays above this support area and respects the rising trendline, bullish momentum is likely to continue. The first target is 4530, and if strength sustains, price can extend toward the main target zone at 4,550–4,560. A clear break back below 4,485–4,495 support would invalidate the bullish setup.

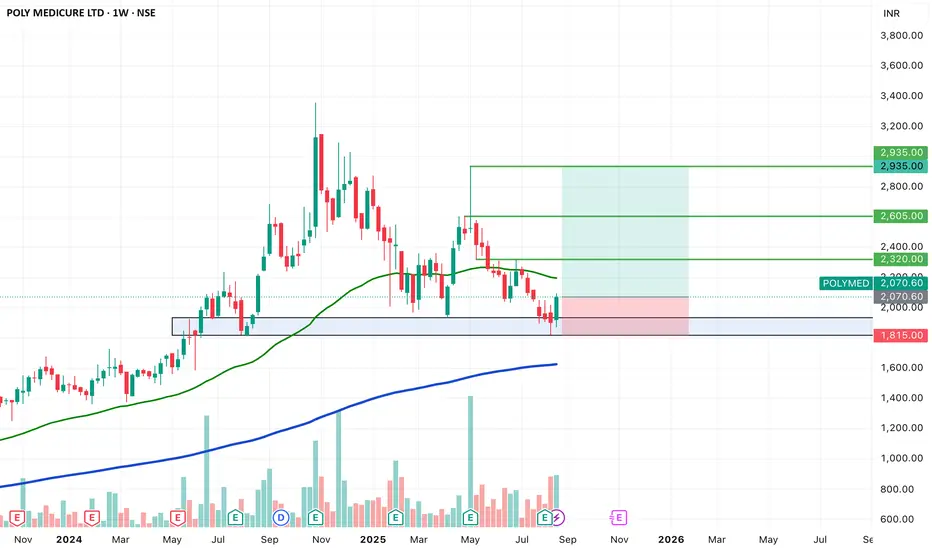
SWING IDEA - POLY MEDICUREPoly Medicure , a leading Indian medical devices manufacturer with a strong global footprint, is currently offering a favorable swing trading setup backed by strong technical confluence.
Reasons are listed below :
1,950 zone acting as a strong support base
Bullish engulfing candle on the weekly timeframe, signaling reversal strength
Marubozu candle on the daily chart, supported by strong volumes
Golden Fibonacci retracement zone providing support in the larger trend
Price comfortably above the 200 EMA, showing long-term trend strength
Target - 2320 // 2605 // 2935
Stoploss - weekly close below 1815
DISCLAIMER -
Decisions to buy, sell, hold or trade in securities, commodities and other investments involve risk and are best made based on the advice of qualified financial professionals. Any trading in securities or other investments involves a risk of substantial losses. The practice of "Day Trading" involves particularly high risks and can cause you to lose substantial sums of money. Before undertaking any trading program, you should consult a qualified financial professional. Please consider carefully whether such trading is suitable for you in light of your financial condition and ability to bear financial risks. Under no circumstances shall we be liable for any loss or damage you or anyone else incurs as a result of any trading or investment activity that you or anyone else engages in based on any information or material you receive through TradingView or our services.
@visionary.growth.insights
XAUUSD BUY SETUPGOLD — Trade Setup
📈 Bias: Bullish
🎯 Entry: 4315 / 4325
🛑 Stop Loss: 4305
🎯 Target: 4355
📊 Technical Reasoning:
Gold is maintaining bullish momentum after holding above a key support zone. The entry area is positioned where buyers are expected to defend price and continue the move higher. The stop loss is placed beyond the invalidation level to manage downside risk, while the target is aligned with a higher liquidity objective and continuation structure.
📌 Execution Plan:
* Buy from the marked entry zone
* Apply disciplined risk management
* Monitor price behavior as it approaches the target
❌ Invalidation:
A clear break and close below 4305 would invalidate this bullish setup.
💬 Do you expect continuation toward 4355, or consolidation before the next leg up?
⚠️ This analysis is for educational purposes only. Not financial advice.


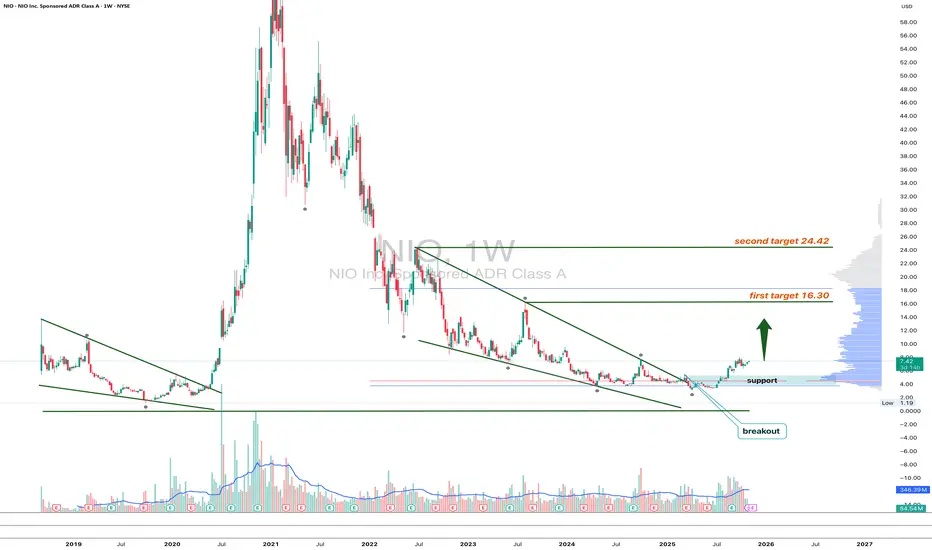
NIO 1W - engine on or just market noise?Technically, NIO has broken out of a long downtrend and is holding above the key $7.4 support. On the weekly chart this looks like the first sign of a long-awaited reversal. Fundamentally, however, the story is still mixed.
The company reported record October deliveries above 40 k units, up roughly 93% year-on-year - strong momentum that shows NIO is expanding its market share in China and entering a new growth phase. Still, free cash flow remains negative and profitability elusive due to heavy investments in battery-swap infrastructure and R&D.
Overall, sales growth and improving brand position support a bullish outlook. As long as price holds above $7.0–7.5, targets at $16.3 and $24.4 remain realistic. A breakdown below $6.5 would invalidate the setup.
Even electric dreams need a full charge - let’s see if this one can make it up the hill.
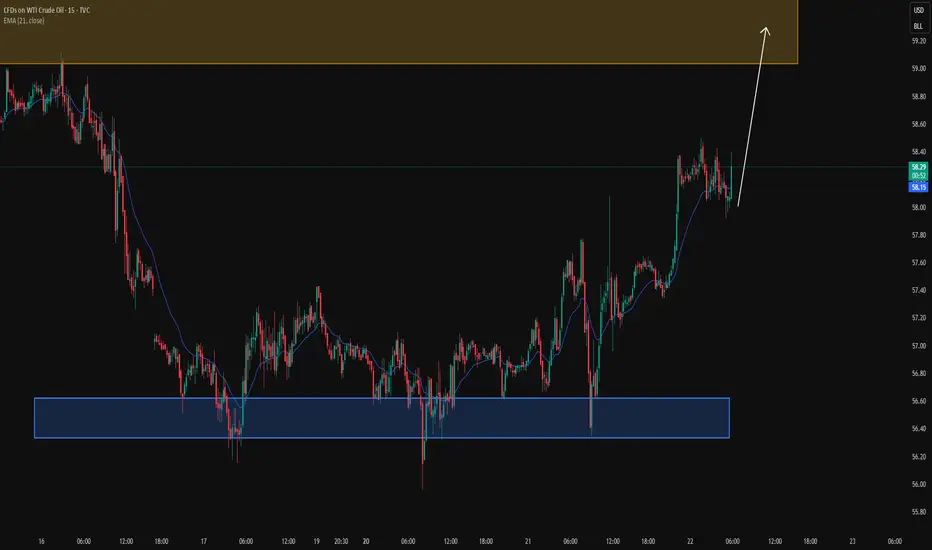
USOIL: Uptrend strengthens after multiple support tests
* Trend: assessed using at least three trend indicators, with market structure as the primary guide.
** Weak or Reversal Signals: Assessed based on one of our criteria for trend reversal signals.
*** Support/Resistance: Selected from multiple factors – static (Swing High, Swing Low, etc.), dynamic (EMA, MA, etc.), psychological (Fibonacci, RSI, etc.) – and determined based on the trader’s discretion.
**** Our advice takes into account all factors, including both fundamental and technical analysis. It is not intended as a profit target. We hope it can serve as a reference to help you trade more effectively. This advice is for informational purposes only and we assume no responsibility for any trading results based on it.
George Vann @ ZuperView
USDJPY: Waiting for a pullback signal on the lower timeframe
* Trend: assessed using at least three trend indicators, with market structure as the primary guide.
** Weak or Reversal Signals: Assessed based on one of our criteria for trend reversal signals.
*** Support/Resistance: Selected from multiple factors – static (Swing High, Swing Low, etc.), dynamic (EMA, MA, etc.), psychological (Fibonacci, RSI, etc.) – and determined based on the trader’s discretion.
**** Our advice takes into account all factors, including both fundamental and technical analysis. It is not intended as a profit target. We hope it can serve as a reference to help you trade more effectively. This advice is for informational purposes only and we assume no responsibility for any trading results based on it.
George Vann @ ZuperView

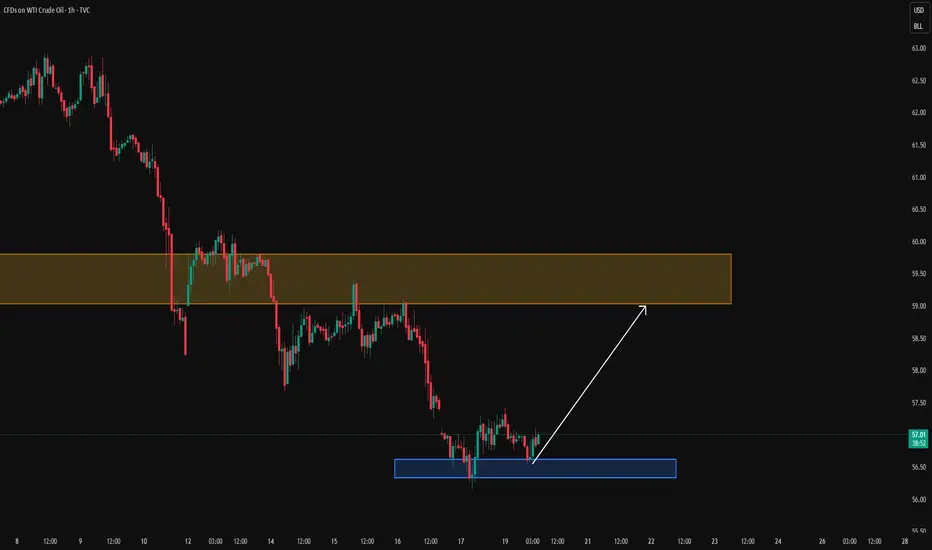
USOIL: Buy setups during higher-timeframe correctionOIL PRICE WEEKLY OUTLOOK
(Week of Oct 20-24, 2025)
Key Drivers & Risks
Updates in Supply, Demand, and Geopolitical News
EIA (week ending Oct 10): Crude inventories +3.5 million bbl; distillates −4.5 million bbl.
IEA OMR (Oct 2025): Upgraded global supply forecast: +3.0 mb/d in 2025 and +2.4 mb/d in 2026, while demand grows only ~0.7 mb/d per year ⇒ signaling a large surplus risk and downward pressure on prices.
OPEC (Oct 2025): Maintains demand growth outlook of +1.3 mb/d for 2025, but acknowledges a smaller deficit in 2026 as OPEC+ output rises; September production increased by ~630 kb/d.
Maritime risk in the Red Sea / Gulf of Aden: Over the weekend, a gas carrier reportedly caught fire following a possible attack off Yemen’s coast, leading to higher shipping risk premiums, though no major disruption to trade flows has been reported yet.
Watchlist for the Week Ahead
EIA Weekly Report (Oct 22): Focus on crude and distillate inventories, and any signs of policy or flow adjustments.
Maritime security updates in the Red Sea / Gulf of Aden / Strait of Hormuz — monitor frequency and severity of incidents.
China data: imports, refinery runs, and inventories — potential signals of stockpiling at lower price levels.
Any notable demand-side surprises (if any emerge).
Overall View
Oil prices are expected to gradually decline within a relatively narrow range of $70–$50 through mid-2026.
Short-term rebounds may occur due to low price levels and heightened transport risk headlines.
China’s potential restocking activity could provide limited demand-side support.
* Trend: assessed using at least three trend indicators, with market structure as the primary guide.
** Weak or Reversal Signals: Assessed based on one of our criteria for trend reversal signals.
*** Support/Resistance: Selected from multiple factors – static (Swing High, Swing Low, etc.), dynamic (EMA, MA, etc.), psychological (Fibonacci, RSI, etc.) – and determined based on the trader’s discretion.
**** Our advice takes into account all factors, including both fundamental and technical analysis. It is not intended as a profit target. We hope it can serve as a reference to help you trade more effectively. This advice is for informational purposes only and we assume no responsibility for any trading results based on it.
George Vann @ ZuperView
GOLD TREND MOVEMENTAfter gold sell on friday, we completed a minor bearish retracement channel ehich has been long expected followed by a bullish pullback to 4240's
Gold opened bullish this week as we're now at the 4260's as we aim back for 4300's as there is a clear path back to ATH just as the trend analysis implies. This trend shows the top liquidity levels and POI
Updates would be given as the market gains momentum

GBPUSD: Waiting for bullish pullback signalsIn my previous analyses, GBPUSD has been in a corrective downtrend on the daily timeframe. On the lower timeframes, the pair continues to test support and resistance levels to confirm the overall trend.
Daily timeframe outlook:
4h timeframe outlook:
* Trend: assessed using at least three trend indicators, with market structure as the primary guide.
** Weak or Reversal Signals: Assessed based on one of our criteria for trend reversal signals.
*** Support/Resistance: Selected from multiple factors – static (Swing High, Swing Low, etc.), dynamic (EMA, MA, etc.), psychological (Fibonacci, RSI, etc.) – and determined based on the trader’s discretion.
**** Our advice takes into account all factors, including both fundamental and technical analysis. It is not intended as a profit target. We hope it can serve as a reference to help you trade more effectively. This advice is for informational purposes only and we assume no responsibility for any trading results based on it.
George Vann @ ZuperView

GBPUSD: Pullback retesting resistance on lower timeframesTo better understand my current outlook on GBPUSD, please refer to my previous higher-timeframe and fundamental analyses:
GBPUSD is currently retracing on the lower timeframes before continuing the bearish trend. For a more reliable confirmation, wait for a sell pullback setup on the 4h chart
* Trend: assessed using at least three trend indicators, with market structure as the primary guide.
** Weak or Reversal Signals: Assessed based on one of our criteria for trend reversal signals.
*** Support/Resistance: Selected from multiple factors – static (Swing High, Swing Low, etc.), dynamic (EMA, MA, etc.), psychological (Fibonacci, RSI, etc.) – and determined based on the trader’s discretion.
**** Our advice takes into account all factors, including both fundamental and technical analysis. It is not intended as a profit target. We hope it can serve as a reference to help you trade more effectively. This advice is for informational purposes only and we assume no responsibility for any trading results based on it.
George Vann @ ZuperView

USDJPY: Waiting for bullish pullback signals on the 4h timeframeTo better understand my current outlook on USDJPY, please refer to my previous higher-timeframe and fundamental analyses:
* Trend: assessed using at least three trend indicators, with market structure as the primary guide.
** Weak or Reversal Signals: Assessed based on one of our criteria for trend reversal signals.
*** Support/Resistance: Selected from multiple factors – static (Swing High, Swing Low, etc.), dynamic (EMA, MA, etc.), psychological (Fibonacci, RSI, etc.) – and determined based on the trader’s discretion.
**** Our advice takes into account all factors, including both fundamental and technical analysis. It is not intended as a profit target. We hope it can serve as a reference to help you trade more effectively. This advice is for informational purposes only and we assume no responsibility for any trading results based on it.
Please like and comment below to support our traders. Your reactions will motivate us to do more analysis in the future 🙏✨
George Vann @ ZuperView

LONG ON GBP/AUDGBP/AUD has created a nice falling wedge into a major demand zone.
Price has already swept sell side liquidity and has given bullish pressure.
I will be buy GA looking to catch 150-200 pips by the end of the week.

POTENTIAL USDCHF BUYDaily Created a HL Followed by two Strong Bullish Candles, with a Slight Pullback.
H4 Timeframes looks Beautiful for Potential Buys around 0.79600.
A Text book Break of Resistance is Shown, currently waiting for price to find a Floor. ( 0.79600)
As long as Price prints a Bullish Engulfing (Or Bullish Variation) generating a HL, this could push Price past the Key Lvl 0.80000.
TP1 :0.80386
TP2 : 0.80751

GBP/CAD : Full Analysis With Great Sell Setup!Her is my 4H GBP/CAD, The price is suffering around this area of resistance. and if you take a historical look u will see multiple wicks refering to the strength of this area. this can be a good indicator to sell this pair again around this area . i will be targeting 100 to 150 pips.

EUR/NZD Creating H&S Pattern , Buy Setup Is Valid Now !Here is my 4H Chart On EUR/NZD , The price creating a very clear reversal pattern ( Reversed head and shoulders pattern ) and the price made a very good bullish price action now from a good support area above my neckline. so we can enter a buy trade now if you are an aggressive trader or u can wait for a 4H retest for My Neckline and then u can enter your buy trade. For this trade we can be targeting from 100 : 150 pips with a decent stop loss.

GBPUSD - BUY OPPORTUNITYLooking to BUY GU in BUY AREA and PROFIT in TP AREA.
Entry Criteria:
Will be looking for Signs of reversals, rejections at Buy Area.
Do not enter Buy Area 1 if strong bearish break of Buy Area 1.
Will look for entry in Buy Area 2 on signs of reversal and or rejections etc.
Trade Safe

BULLISH ON GBP/NZDGBP/NZD has reached a nice demand zone and has created a beautiful inverse head and shoulders pattern.
Price is just now giving us a CHOC (Change of Character) to the upside breaking a previous strong high to the left.
I am waiting for price to pullback into that same demand area before buying, also watch out for the sweep below the (Head) of the Head and Shoulders.
Looking to catch 300-400 pips.
