LONG ON GBP/AUDGBP/AUD has created a nice falling wedge into a major demand zone.
Price has already swept sell side liquidity and has given bullish pressure.
I will be buy GA looking to catch 150-200 pips by the end of the week.
Buysetup

POTENTIAL USDCHF BUYDaily Created a HL Followed by two Strong Bullish Candles, with a Slight Pullback.
H4 Timeframes looks Beautiful for Potential Buys around 0.79600.
A Text book Break of Resistance is Shown, currently waiting for price to find a Floor. ( 0.79600)
As long as Price prints a Bullish Engulfing (Or Bullish Variation) generating a HL, this could push Price past the Key Lvl 0.80000.
TP1 :0.80386
TP2 : 0.80751

GBP/CAD : Full Analysis With Great Sell Setup!Her is my 4H GBP/CAD, The price is suffering around this area of resistance. and if you take a historical look u will see multiple wicks refering to the strength of this area. this can be a good indicator to sell this pair again around this area . i will be targeting 100 to 150 pips.

EUR/NZD Creating H&S Pattern , Buy Setup Is Valid Now !Here is my 4H Chart On EUR/NZD , The price creating a very clear reversal pattern ( Reversed head and shoulders pattern ) and the price made a very good bullish price action now from a good support area above my neckline. so we can enter a buy trade now if you are an aggressive trader or u can wait for a 4H retest for My Neckline and then u can enter your buy trade. For this trade we can be targeting from 100 : 150 pips with a decent stop loss.

GBPUSD - BUY OPPORTUNITYLooking to BUY GU in BUY AREA and PROFIT in TP AREA.
Entry Criteria:
Will be looking for Signs of reversals, rejections at Buy Area.
Do not enter Buy Area 1 if strong bearish break of Buy Area 1.
Will look for entry in Buy Area 2 on signs of reversal and or rejections etc.
Trade Safe

BULLISH ON GBP/NZDGBP/NZD has reached a nice demand zone and has created a beautiful inverse head and shoulders pattern.
Price is just now giving us a CHOC (Change of Character) to the upside breaking a previous strong high to the left.
I am waiting for price to pullback into that same demand area before buying, also watch out for the sweep below the (Head) of the Head and Shoulders.
Looking to catch 300-400 pips.

GOLD BULLSAFTER A FAKEOUT SELL along CPI, bulls are back in action as we aim for more bullish momentum
Trend Hedge path leads us back to ATH and above,

LONG ON ETHEREUMEthereum is coming from a major demand area after sweeping liquidity.
I am taking a buy limit order on ETH looking to catch price rising to the previous highs. Over 500-600 points.

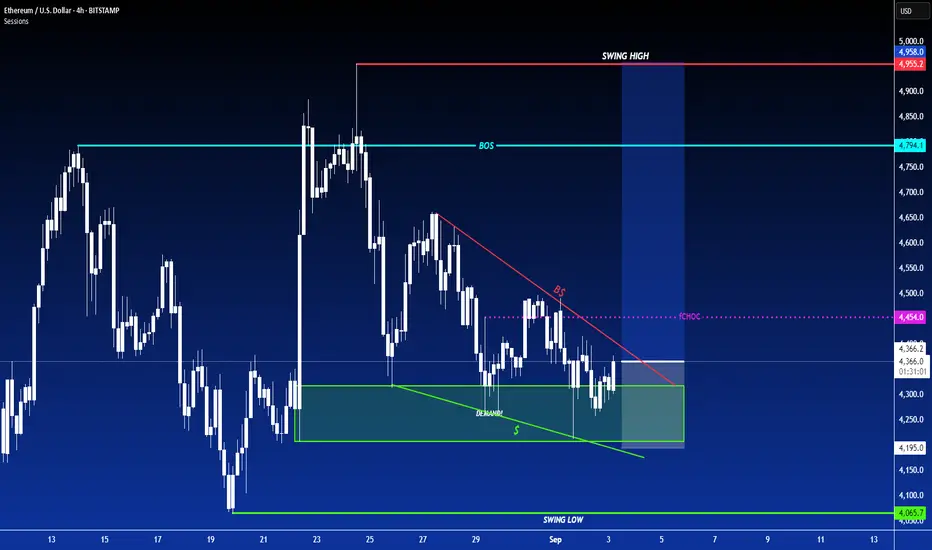
LONG ON ETH/USD ETHEREUMEthereum has a nice falling wedge into a major demand zone.
I will be taking ETH as a market buy now looking for price to reach 5000
making over 500 points to the previous High.
LONG ON USD/CADUSD/CAD is in a Major Demand Zone and has rejected it nicely.
I will be buying USD/CAD looking for price to reach the previous high for about 100 pips.

Trap Day Example – 12AM Bias, London Trap & New York Silver BullThis schematic illustrates how price action often sets up around key time windows and liquidity pools, independent of the actual news release.
• 12AM Candle Bias: The 12AM (NY) hourly candle often sets the directional framework for the day. A red candle can sometimes indicate the opposite bias (bullish) as liquidity is engineered around retail positioning.
• London Trap (1AM–5AM): Liquidity is typically built in the early session, where clean-looking structures entice traders to place stops just beyond obvious highs or lows. These stops become fuel later in the session.
• Reset Window (5AM–7AM): Price consolidates and repositions, chopping up retail orders. Patience here is essential.
• 7:38AM Liquidity Sweep: A sharp move often clears out positions, targeting extreme levels such as the 4th standard deviation (~68 pips in this example). This is not random — it’s part of the day’s liquidity cycle.
• 10AM Silver Bullet Zone: A major move frequently coincides with scheduled news events. However, the setup is often already “baked in” to the algorithms well before the announcement, providing a precise time/price confluence for high-probability trades.
Key Takeaway:
Markets are not driven by randomness. Time, liquidity, and structure work together to engineer traps and sweeps before directional moves unfold. By studying these repeatable cycles — from the London trap to the New York Silver Bullet — traders can better understand how the market truly operates.

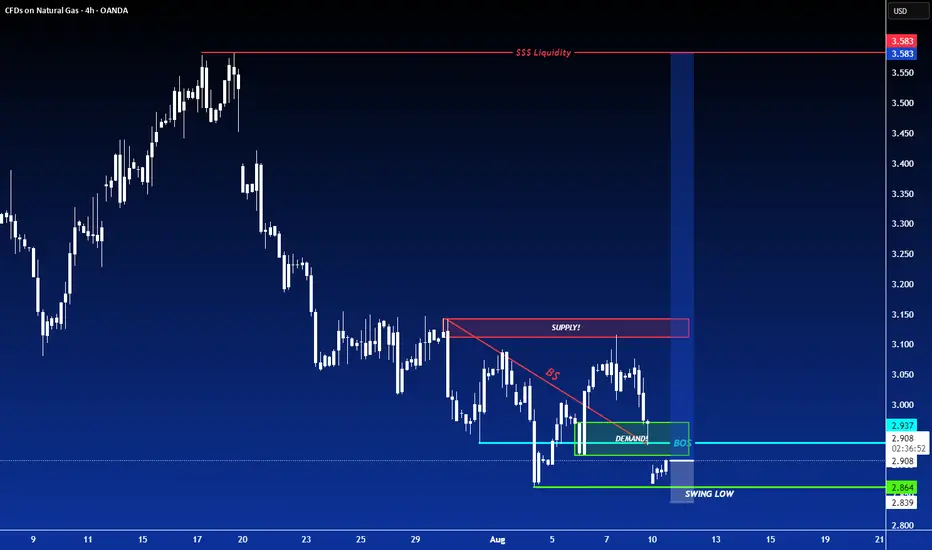
LONG ON NATURAL GASNatural gas has given us a nice CHOC (change of character) to the upside to start a upward move from a major demand zone.
I will be buying natural gas to the next level of supply.
3rd Wave About to Start in Ingersoll Rand (IR)Good looking Elliott Wave setup in NYSE:IR
Stock rose in clean 5 waves impulse wave followed by 3 waves down in ABC to almost exactly at 61.8% level around 75. If the wave C low 73.87 holds then we can expect another 5 wave rise in larger (3) or (C) on the upside. As per wave equality principle, we can expect it to be same in size as the previous 5-wave rise seen in the chart. That gives a potential target of 98.7 for current levels. 1.618 times of the move is at 114.04 which could be second (extended) target.
Note that invalidation level for this setup is wave C low at 73.87.

LONG ON EUR/USDEUR/USD is currently at a major demand level after sweeping sell side liquidity.
The Dxy (Dollar) is overall bearish. I expect the dollar to fall and EUR/USD to rise to the previous high / supply level for over 200-300 pips.
News most likely will affect this pair in terms of volatility.

LONG ON NZD/USDNZD/USD is at a major demand level.
Dollar is bearish. Economic News this afternoon should assist and pushing this pair up.
Looking to catch 200 pips to the previous high.

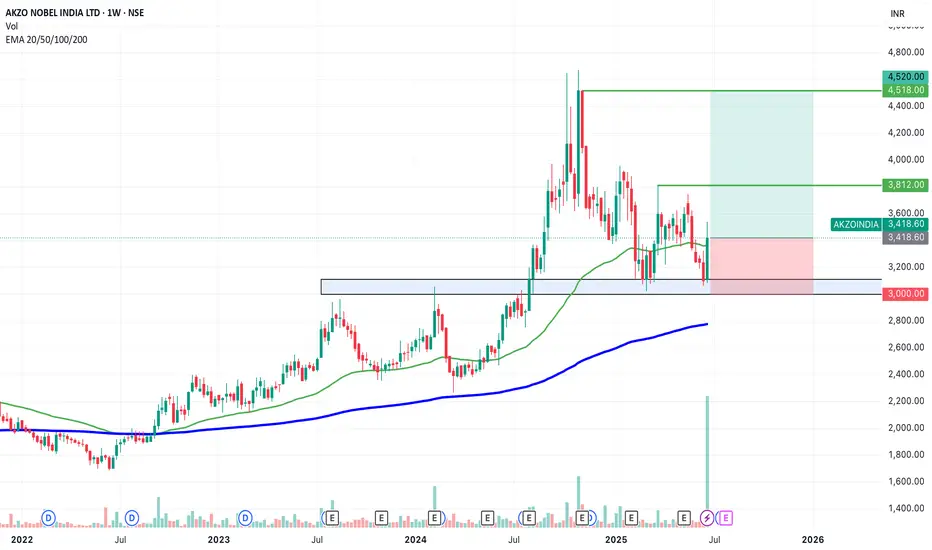
SWING IDEA - AKZO NOBEL INDIA Akzo Nobel India , a subsidiary of the global paints and coatings giant AkzoNobel N.V., is a leading player in India’s decorative and industrial paints market. Known for its premium brand Dulux , the company has strong brand recall, a wide distribution network, and consistent profitability.A strong brand, steady margins, and a bullish chart make this a candidate to watch for a short- to medium-term swing trade.
Reasons are listed below :
Bullish engulfing candle spotted on the weekly timeframe, signaling a potential trend reversal.
Accompanied by the highest-ever volume spike, adding strong conviction to the move.
Price is bouncing off the golden Fibonacci support (0.618), a classic retracement zone where strong reversals often occur.
The level of 3100 acted as a solid support.
The stock is trading above its 50 & 200 EMA on the weekly chart — a sign of long-term strength.
Target - 3812 // 4520
Stoploss - weekly close below 3000
DISCLAIMER -
Decisions to buy, sell, hold or trade in securities, commodities and other investments involve risk and are best made based on the advice of qualified financial professionals. Any trading in securities or other investments involves a risk of substantial losses. The practice of "Day Trading" involves particularly high risks and can cause you to lose substantial sums of money. Before undertaking any trading program, you should consult a qualified financial professional. Please consider carefully whether such trading is suitable for you in light of your financial condition and ability to bear financial risks. Under no circumstances shall we be liable for any loss or damage you or anyone else incurs as a result of any trading or investment activity that you or anyone else engages in based on any information or material you receive through TradingView or our services.
@visionary.growth.insights
LONG ON GBP/AUDGA has given us a CHOC (change of character) to the upside after making a new low.
Price has since pulled back to the demand area that created that change leaving us with a possible double bottom forming.
I expect GA to rise to sweep buy side liquidity at the equal highs then reaching the previous supply level / previous High.
Looking to catch 200-300 pips.

LONG ON GBP/CADGBP/CAD is now at a major key area/demand zone after completing its pullback phase.
I expect price to now rise to the next level of supply or previous high.
looking to catch 200-400 pips throughout the week.

LONG ON USOIL OIL has just completed a sweep of sell side liquidity, leaving behind lots of BUY side liquidity.
DXY is falling on top of economic news stating trump will possibly fire Jerome Powell.
All this with OPEC increase oil production.
I expect oil to make a $5-$10 move throughout the rest of the week.
That's 500-1000 pips!

SWING TRADE OPPORTUNITY 〉LONGAs illustrated, I try to visualize what the next bullish impulse could look like if price holds 3300 as a key psychological and algorithmic price level.
Illustrated are the potential buy areas (a current one and an extended one in case a pullback occurs to manipulate lower levels in the next 24-48 hours).
This projection, if valid, could hold from now until next week, so it can be considered a swing trade to hold at least the next week and into the following one).
--
After this post, I will upload another analysis on the Daily timeframe projecting the longer term move, so make sure to go in my profile to check it out.
GOOD LUCK

USDJPY 1H - market buy with a confirmed structureThe price has bounced from a key support zone and is showing early signs of recovery. A clear base has formed, and the MA50 is starting to turn upward, indicating a shift in short-term momentum. While the MA200 remains above the price, the overall structure suggests a potential continuation of the bullish move.
Trade #1 — entry at market, target: 145.939, stop below recent local low.
Trade #2 — entry after breakout and retest of 145.939, target: 148.000, stop below the retest zone.
Volume has stabilized, and the reaction from support is clear. As long as price holds above the last swing low, buying remains the preferred strategy.

LONG ON GBP/USDGU is currently in its pullback phase of its uptrend.
We have a nice sell side Liquidity sweep being completed at this moment.
Price should now tap into previous demand that broke a high to repeat history and rise again.
Very Nice Setup over 300 pips on the table to the previous high/supply zone.

LONG ON GBP/CHFGBP/CHF has tapped into a major demand zone and has lots of buy side liquidity to the upside near the supply zone to collect.
I will be buying GBP/CHF to the supply zone looking to catch 400-600 pips.
