Gold More Chances to Buy Now at this its price on exactly on VALUE AREA LOW POINT .its more Chances to goes Bullish side at 4370.289 to 4382.893 (POC and Value Area High ) these area are Struggling for if price break that level then will be another BULLISH Move 4548.009.
let’s see how price reacts around this level
DISCLAIMER
This is made for educational and informational purposes only.
It is not financial, investment, or trading advice.
Trading involves risk, and past performance doesn't guarantee future results.
Always do your own research or consult a licensed financial advisor
before making any trading or investment decisions.
The creator is not responsible for any profit or loss from your actions.
We don't offer paid signals or account management services.
Beware of scammers using our name - we are not connected to them.
Buysignal

HURRY Up I See Wonderful opportunity AwaitsYou Can see clearly the turtle Soup for Bearish in past
What we Show You The Upcoming opportunity
1st it will fill the empty Gray Box below as soon it offer into the
Green Box We Immediately looking for longs .

Gold continues to consolidate above 4300, trading sideways.⭐️GOLDEN INFORMATION:
Gold (XAU/USD) trades slightly lower during the Asian session on Thursday, slipping back below the $4,350 handle after recently hitting seven-week highs. The pullback appears driven by profit-taking activity alongside a short-term rebound in the US Dollar (USD). That said, downside risks for the yellow metal look contained, as recent US labor-market data has reinforced expectations for additional rate cuts by the Federal Reserve, keeping broader USD dynamics biased to the downside. A lower interest-rate environment continues to compress the opportunity cost of holding non-yielding assets, providing a supportive backdrop for gold prices.
On the geopolitical front, tensions have intensified after Venezuela reportedly deployed naval forces to escort oil shipments amid threats of a US blockade. Such developments could reignite safe-haven demand, potentially lending renewed support to gold in the near term.
⭐️Personal comments NOVA:
Gold prices are consolidating around 4300, with a predominantly upward trend. Maintaining above 4300 will allow for further accumulation for the upcoming uptrend.
⭐️SET UP GOLD PRICE:
🔥SELL GOLD zone: 4390 - 4392 SL 4397
TP1: $4375
TP2: $4360
TP3: $4345
🔥BUY GOLD zone: 4298 - 4296 SL 4291
TP1: $4310
TP2: $4325
TP3: $4340
⭐️Technical analysis:
Based on technical indicators EMA 34, EMA89 and support resistance areas to set up a reasonable BUY order.
⭐️NOTE:
Note: Nova wishes traders to manage their capital well
- take the number of lots that match your capital
- Takeprofit equal to 4-6% of capital account
- Stoplose equal to 2-3% of capital account

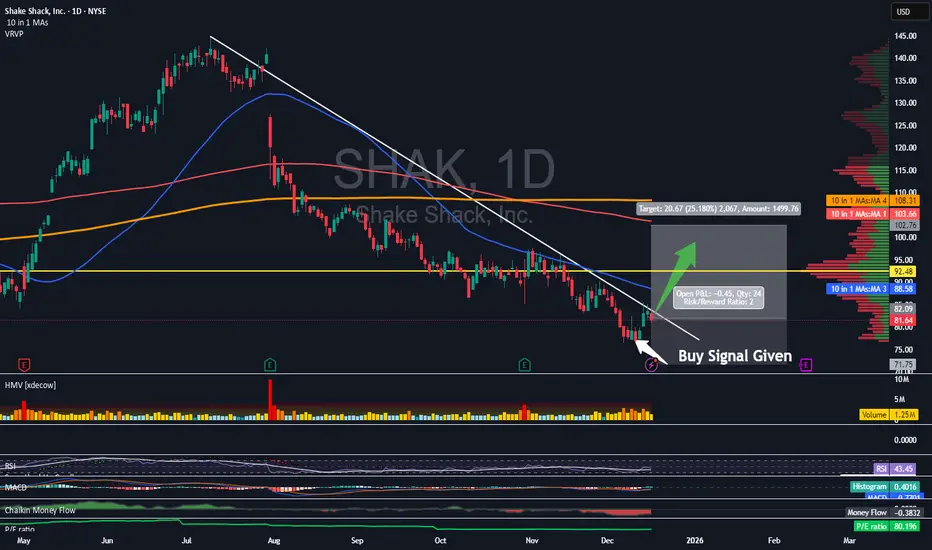
Buy Signal Given on Shake ShackTrading Fam,
I've received two more clear buy signals from my indicator recently. Here on SHAK we were given our signal about a week ago. I didn't wait for to break that descending trendline on this one, so it may be a tad bit more risky than had I waited for that breakout. However, I have full confidence in my indicator as it has a knack of predicting breakouts before they occur. I don't doubt this will be the same.
Here is what I am looking at:
1) Buy signal given by my indicator and confirmed with good volume.
2) We are about to break to the upside of that descending trendline. Once we do, we should be able to climb up to that red 200 SMA (my target) for a touch.
3) There will be some resistance before we get to my healthy 25% profit target: the descending TL, the 50 SMA, and the VRVP PoC.
This trade comes in at a 1:2 rrr with a target of $102+ and a SL of 71.75.
✌️Stew
BTCUSD 4h, TRADE IDEA. 2ND DEC,2025.Bitcoins looks to be trying to break above back to a $100K, after a short push below to almost $70k, if price hold the marked out levels I expect to a BUY position.

MRK Merck On the Verge of a Breakout? Unusual Calls !!Merck (MRK) is setting up for what could be a high-probability breakout. The stock has been in a falling wedge pattern for several months — a classic technical formation that often precedes sharp upside moves. Price action has now compressed to the end of the wedge, and we may be on the brink of a bullish resolution.
🔍 Technical Setup
Falling Wedge Pattern nearing completion
Price currently hovering near long-term support ($78.25)
Strong bullish divergence forming on momentum indicators (RSI/MACD)
The falling wedge is typically a reversal pattern, and given how deep MRK has pulled back from its highs ($134+), the risk/reward here looks compelling.
🔥 Options Flow
Today’s options market added fuel to the fire:
48,000 call contracts traded expiring this Friday
This sudden surge in short-dated call buying signals aggressive positioning for an imminent move
This kind of volume is not retail-driven — it points to potential institutional interest
💡 The Bullish Case
With the technical breakout structure in place and strong confirmation from options flow, the case for a bullish reversal is growing. If MRK can close above wedge resistance with volume, it opens the door to a quick move toward $85+, possibly even higher in the coming weeks.
Disclosure: I am part of Trade Nation's Influencer program and receive a monthly fee for using their TradingView charts in my analysis.

Gold prices continue to recover - above 4200⭐️GOLDEN INFORMATION:
Gold (XAU/USD) picks up fresh demand in Friday’s Asian session, rising to a two-week high as bulls target a move back toward $4,200. Growing expectations of a December Fed rate cut remain a major tailwind for the non-yielding metal, while a break above the $4,170–4,175 resistance zone has also fueled additional technical buying
⭐️Personal comments NOVA:
Continue to recover - break resistance and increase price. Gold price approaches resistance zone 4210 at the end of the week
⭐️SET UP GOLD PRICE:
🔥SELL GOLD zone: 4210 - 4212 SL 4217
TP1: $4200
TP2: $4185
TP3: $4170
🔥BUY GOLD zone: 4113 - 4115 SL 4108
TP1: $4130
TP2: $4140
TP3: $4160
⭐️Technical analysis:
Based on technical indicators EMA 34, EMA89 and support resistance areas to set up a reasonable BUY order.
⭐️NOTE:
Note: Nova wishes traders to manage their capital well
- take the number of lots that match your capital
- Takeprofit equal to 4-6% of capital account
- Stoplose equal to 2-3% of capital account

VKTX Viking Therapeutics Potential Buyout Soon?!If you haven`t bought VKTX before the previous rally:
If GLP-1 obesity drugs are a multi-hundred-billion-dollar opportunity, a successful VK2735 (injectable + oral) could justify a valuation far north of where VKTX trades today—if it makes it to market.
My bullish thesis:
1. GLP-1 Momentum + “Mini Lilly / Novo” Narrative
VKTX is seen as a “pure play” on the global obesity and metabolic-disease boom.
Viking’s lead program, VK2735, is a dual GLP-1/GIP receptor agonist being developed in both injectable and oral form for obesity and related metabolic disorders.
Phase 1 and Phase 2 data for the injectable version have already shown meaningful weight loss with an encouraging safety/tolerability profile, which is why it advanced into large Phase 3 obesity trials.
An oral version of VK2735 is in Phase 2 obesity trials and, in the VENTURE oral study, delivered up to ~12.2% mean weight loss at 13 weeks, with a clear dose response.
2. Rapid Trial Execution = Strong Momentum & Upcoming Catalysts
Another big talking point is how fast Viking is executing on its trials, which bulls see as a leading indicator of future news flow:
Viking recently announced completion of enrollment in its Phase 3 VANQUISH-1 VK2735 obesity trial, with ~4,650 patients (above the original 4,500 target).
The company highlighted VK2735 data at ObesityWeek 2025 and continues to position both injectable and oral formulations as core programs.
Management has reiterated that VK2735 oral and injectable programs are moving forward on schedule, with more data expected as Phase 3 and longer-duration studies mature.
3. Short Interest + “Squeeze Fuel” Angle
VKTX has a high short interest, which Twitter traders love to highlight:
Recent data shows around 22–23% of the float short, with days to cover >5 based on average volume.
For many momentum and options traders, this is exactly the kind of setup they look for:
High short interest = a lot of investors betting against the stock.
Any positive surprise (trial data, partnership, M&A rumor, or a strong breakout on the chart) could force shorts to cover.
If that happens during a period of high retail interest, the price action can get violent to the upside.
4. Analyst Targets + Big Pharma Takeover Speculation
Analyst consensus is currently Strong Buy, with an average price target around $95+.
On top of that, there’s constant speculation that VKTX could become a takeover target:
The GLP-1 market is being dominated by Eli Lilly (Zepbound, Mounjaro) and Novo Nordisk (Wegovy, Ozempic).
Many large pharma companies without a strong obesity franchise might prefer buying a late-stage asset rather than starting from scratch.
VK2735, with Phase 3 obesity trials underway and promising oral data, is the kind of asset that fits that narrative.

Accumulated price zone 4100, there is a recovery✍️ NOVA hello everyone, Let's comment on gold price next week from 11/24/2025 - 11/28/2025
⭐️GOLDEN INFORMATION:
Gold (XAU/USD) holds firm in Friday’s North American session after Fed officials signaled the possibility of a December rate cut. The metal trades near $4,096, up 0.53%, after briefly touching $4,101.
Despite mixed US data and shifting rate expectations, XAU/USD has moved sideways for the past three days as traders remain uncertain about its next direction. Recent Fed commentary and the return of key economic releases suggest a steady economy with a strong labor market and persistent inflation pressures
⭐️Personal comments NOVA:
Gold price accumulates around 4100, showing signs of recovery when breaking the short-term downtrend
🔥 Technically:
Based on the resistance and support areas of the gold price according to the H4 frame, NOVA identifies the important key areas as follows:
Resistance: $4133, $4242
Support: $4033, $3982
🔥 NOTE:
Note: Nova wishes traders to manage their capital well
- take the number of lots that match your capital
- Takeprofit equal to 4-6% of capital account
- Stoplose equal to 2-3% of capital account
- The winner is the one who sticks with the market the longest

EURUSD - 20 NOV 2025What are you looking out for on EURUSD? The counter trend buy then the sell to continue till 1.4700, lets see how it goes guys. Keep and eye on the bigger picture guys as market is fractal.

ES Buy Signal Supply-Demand And Support ResistanceSee picture for analysis
Seasonality = bullish
Fundamnetals = bullish
Sentiment = mixed
Technicals = long-term bullish/ short-term choppy
Price created 1timeframe demand level reacting
off of support.
Demand can also be used as HTF and wait for LTF confirmation.
Odds of full TP hit maybe around 28-32%

GBPJPY: A Golden Buying Opportunity as the Bulls Return!The market is gradually shifting in favor of the bulls on GBPJPY , as both fundamental and technical factors align to strengthen the short-term bullish outlook.
From a news perspective, the Japanese yen continues to weaken as Japan maintains its ultra-loose monetary policy stance, while the British pound shows mild recovery amid improving global risk sentiment. This combination has helped GBPJPY maintain upward momentum, despite slightly weaker UK labor data.
The chart now shows buying pressure returning , with GBPJPY hovering around the 202–203 zone, trading above the Ichimoku cloud — a positive signal for the ongoing uptrend. The 202.000 level acts as short-term support, while the next target lies at 205.000, which aligns with a key resistance and previous supply area.
Any pullbacks toward the 202.000 region can be viewed as buy-the-dip opportunities in line with the dominant trend. As long as price holds above this support, a move toward 205.000 remains highly achievable in the coming sessions.

Long - XAUUSD Hit TP on early MondayAnother week opened, XAUUSD long position hit TP as expected. I took a buy following a strong rejection at support zine. Price closed the week with 4000 after a strong bullish candle/rejected wick, confirming a short term bullish bias and surge with a sharp move earlier this morning.

LONG ON GBP/USDGBP/USD has given us a nice retracement after a CHOC (Change of Character) to the upside.
I expect GU to rise to the next high for about 100-200 pips.

BTC returns to support zone, bullish reactionBTC/USD Analysis (4H timeframe)
Bitcoin continues to trade within a descending wedge structure, suggesting a potential accumulation phase before a possible bullish breakout. The market is currently reacting near the lower boundary of the pattern, showing signs of support around the 106,300–107,000 zone.
1. Market Structure
Price remains trapped between the wedge’s lower trendline support and the descending upper resistance. Each rejection from the upper boundary has been met with strong buying interest at the lower support, indicating that buyers are still defending this level.
The overall structure shows higher lows forming within the wedge, which could be a bullish signal if confirmed by a strong rebound.
2. Key Support and Resistance Levels
Immediate support: 106,300–107,000
Secondary support: 103,400 (major liquidity zone and previous swing low)
First resistance: 113,800–114,000 (near descending trendline and EMA confluence)
Second resistance: 116,300–116,500 (major breakout zone)
3. EMA Confluence
The 34, 89, and 200 EMAs are currently stacked above price, acting as dynamic resistance. A clean breakout and candle close above these EMAs would confirm a shift in momentum and likely trigger a move toward the 113,800–116,300 targets.
4. Possible Scenarios
Bullish Scenario:
If BTC holds above 106,300 and rebounds with strong bullish candles, price could retest 113,800, followed by 116,300. A breakout above 116,300 would confirm a bullish reversal and open room toward 120,000+.
Bearish Scenario:
A clear breakdown below 106,300 could lead to a deeper retracement toward 103,400 before a possible rebound.

LONG ON GOLD XAU/USDGOLD Has swept sell side liquidity at a major support zone.
It also has bullish divergence on the lower timeframes.
Additionally there is conflict between Iran and Israel which leads investors to safe havens like gold and silver.
I am looking to catch over 300 points on GOLD which is over 3000 pips.

BTC accumulates and starts to recoverBitcoin (BTC/USD) – Daily Analysis
BTC continues to trade within a broad ascending channel, currently rebounding strongly from the key demand zone around 106,000–108,000. This zone has acted as a major liquidity area where buyers have repeatedly stepped in to defend price.
After forming a double rejection at the lower channel boundary, BTC has reclaimed the EMA 34 and is now attempting to stabilize above 110,000, signaling early bullish recovery momentum.
If buyers can maintain price action above 110,000, the next resistance levels to watch are:
113,000–114,000: confluence of EMA 89 + prior structure resistance.
126,000–127,000: upper trendline of the ascending channel and potential medium-term target.
Technical Outlook:
Price respected long-term ascending channel support.
EMAs show potential for a bullish crossover if momentum continues.
Higher low formation supports a recovery scenario.
Bullish Scenario:
Holding above 110,000 would confirm strength, with possible continuation toward 113,000 → 126,000.
Bearish Scenario:
Failure to hold 108,000 could trigger a deeper retracement toward 106,000 or even 102,000 (next demand zone).

VIX will spike soon with Gold / Silver crashingThis am Gold and Silver have been coming down hard, and will likely keep tanking as supply cannot be met breaking trust in the supply chain. It's happened every other time.
Maybe nothing, but VIX is very nicely positioned now. May use UVIX as a proxy.
Best of luck!

The bulls are too dominant, prices continue to increase⭐️GOLDEN INFORMATION:
Gold (XAU/USD) extends its record-breaking rally above $4,100 in Tuesday’s Asian session, fueled by safe-haven demand amid the ongoing US government shutdown and renewed US-China trade tensions. Geopolitical risks and rising expectations of further Federal Reserve rate cuts also continue to underpin the non-yielding metal.
⭐️Personal comments NOVA:
Selling pressure is almost absent in the market, buying pressure continues to push gold prices up. Continue waiting for a new ATH today.
⭐️SET UP GOLD PRICE:
🔥SELL GOLD zone: 4212 - 4214 SL 4219
TP1: $4200
TP2: $4185
TP3: $4162
🔥BUY GOLD zone: $4058-$4056 SL $4051
TP1: $4070
TP2: $4090
TP3: $4105
⭐️Technical analysis:
Based on technical indicators EMA 34, EMA89 and support resistance areas to set up a reasonable BUY order.
⭐️NOTE:
Note: Nova wishes traders to manage their capital well
- take the number of lots that match your capital
- Takeprofit equal to 4-6% of capital account
- Stoplose equal to 2-3% of capital account

Positive Market - BTC Continues to Find New ATHBTCUSD Analysis
Bitcoin is currently testing the upper boundary of a long-term ascending channel, where price has previously faced rejection several times (as shown by the red arrows).
The market recently completed a strong rally toward 124K, aligning with the 1.618 Fibonacci extension (123,609) — a significant resistance zone that triggered selling pressure.
Key observations:
• Resistance area: Around 124K–125K, aligning with the upper channel line — potential for short-term correction.
• Support zones: The first support lies near 118,100, followed by 115,000–115,500, both acting as Fibonacci retracement zones.
• Possible scenarios:
1. Price may retrace toward 118K–115K to gather liquidity before another push upward.
2. If the market holds above 123K, a breakout toward 132K–133K could be confirmed.
Overall, momentum remains bullish, but the current zone requires caution — a short-term pullback is likely before the next major move.

LONG ON GBP/AUDGBP/AUD has created a nice falling wedge into a major demand zone.
Price has already swept sell side liquidity and has given bullish pressure.
I will be buy GA looking to catch 150-200 pips by the end of the week.

BABA: triangle with tensionOn the weekly chart, BABA has already formed a golden cross - price is above both MA50 and MA200, confirming a bullish trend shift. The stock is now approaching the upper edge of the symmetrical triangle and the key resistance at $122, which also aligns with the 0.5 Fibonacci level.
The numbers inside the triangle represent the contraction phases, not Elliott waves. This is a classical consolidation before a potential breakout. If the $122 level is broken and retested, upside targets are $128 (0.618), $137 (0.786), and eventually $148–181 (1.0–1.618 extension).
Volume is rising, MACD is flipping bullish, and RSI is climbing out of oversold territory — all signs point to growing bullish momentum.
Fundamentally, Alibaba benefits from China's economic rebound, possible regulatory relief, and ongoing share buybacks. With Chinese tech rotating back into favor, BABA could lead the rally.
So if you're still waiting for a signal - it's already here. The golden cross is done, price is flying above moving averages, and all that’s left is a clean breakout. Watch $122 — that’s the launchpad.

Bitcoin Buy signalThis signal is a little risky and i would say it would be MED_RISK level.
also the RR is good and it is 1:3(Risk: Reward).
i put entry below the support of green trendline because we may have some stop loss hunting there.
Also if stop hit then market is also bearish for a while and more dump may lead like red arrows mentioned on the chart.
DISCLAIMER: ((trade based on your own decision))
<<press like👍 if you enjoy💚
