XAUUSD READY FOR FLY (READ CAPTION)Gold is currently trading with a bullish bias, indicating strength in the overall price structure and potential continuation to the upside.
🔹 Support Zone (4276):
This is a strong demand area where buyers are expected to step in. As long as price holds above this zone, the bullish trend remains intact and pullbacks can be considered buying opportunities.
🔹 Resistance Level (4400):
This is the immediate resistance level. A confirmed breakout and close above 4400 can accelerate bullish momentum and open the path toward higher targets.
🔹 Supply Zone (4460):
This is a major supply area where selling pressure may appear. Price may face rejection or consolidation near this zone unless strong buying pressure leads to a decisive breakout.
🔹 Overall Bias:
The bullish outlook stays valid while Gold remains above the 4276 support zone. Any retracement toward support is viewed as corrective within the uptrend.
like,comment,and follow
Buyzone

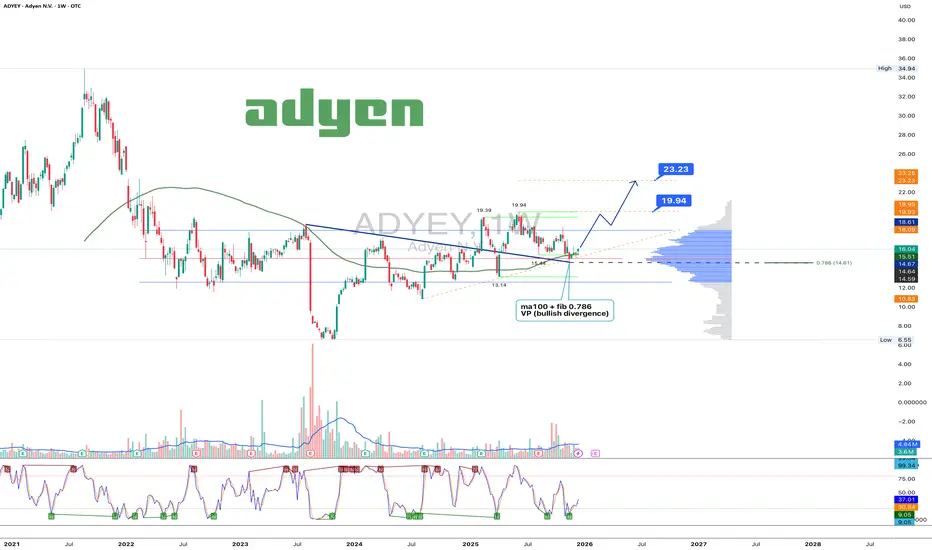
Adyen 1W: The trend broke twice, the market is just catching upOn the weekly chart, Adyen has broken the long term downtrend twice, and price is now performing a controlled pullback retest. The current consolidation holds above the $15.5–16.0 demand zone, where MA100, 0.786 Fibonacci and strong volume profile support align. Selling pressure is fading, volumes on the pullback are declining, and bullish divergence remains intact. This structure favors confirmation of the breakout rather than a return to a bearish trend. As long as price stays above this zone, upside remains the priority. First target stands at $19.94, followed by $23.23.
Fundamentally, Adyen continues to deliver consistent growth. H1 2025 revenue reached $1.28B, up from $1.13B in H2 2024. H2 2025 revenue is projected at $1.49B, with forecasts extending toward $1.53–1.88B in 2026–2027. EPS came in at $0.18 for H1 2025, with $0.21 expected in H2, rising toward $0.25–0.26 by 2027. Analyst sentiment leans bullish as digital payment volumes continue to expand globally.
When a trend breaks twice, patience usually gets paid.
Robinhood pretends to chill, but the chart exposes its ambitionsRobinhood pretends to wander, but the chart already knows its destination
HOOD closed at 123.08 on the daily chart and is moving toward the buy zone 116.54–120.86, aligned with the ma100, which forms a strong demand area. As long as price stays above the intermediate support near 120.00, the bullish structure remains valid. The expected scenario is a controlled pullback into 116.54–120.86 followed by accumulation and a fresh upward impulse.
Once demand confirms, the first major resistance is 138–146. A breakout above that level opens the road to the primary target 180.36. Fibonacci aligns cleanly with the structure: 0.618 at 119.54, 0.5 at 123.86, 0.786 at 110.38 remain key tracking levels.
Fundamentally as of December 12 2025, Robinhood is delivering strong performance. Active users exceed 26.5M, trailing revenue is near 2B USD, and options revenue is up more than 18 %. Cash reserves surpass 5.7B USD with minimal debt. Robinhood Retirement, lending products and the fast growing Gold Membership continue expanding monetization. User activity remains high with more than 6M daily trades.
Price has not yet reached the demand zone, but volume behavior and moving averages suggest a strong upcoming entry point. Robinhood looks casual, but the chart hints that something bigger is brewing.

ALGO Consolidation at Key Support | Spot Long SetupOver the last couple of days, Algorand (ALGO) has been consolidating tightly around a key support level between $0.130 and $0.135. This range has historically held well, acting as a strong base for previous upward moves. The sideways price action here suggests accumulation, with buyers stepping in to absorb selling pressure.
🎯 Trade Idea (Spot Long)
Entry Zone: $0.130 – $0.135
Take Profits: $0.145 / $0.175 / $0.225 / $0.26
Stop Loss: $0.125
This setup offers a favorable risk-reward ratio, especially with confirmation of support holding. The multi-tiered TP approach allows for scaling out profitably.
Always watch for volume confirmation and market sentiment shifts. A breakdown below $0.125 would invalidate the idea. This setup is meant for educational purposes only.

Microsoft: Overvalued but Still Bullish - Watching the 400–450Microsoft NASDAQ:MSFT
1. Quick Trade Plan (for those who want levels first) 🎯
Market Bias: Long term bullish, but in a late phase of the cycle.
Strategy: Don’t chase highs; buy the correction.
📌 Buy Zones
Primary Buy Zone: 400–450 USD
Strong support cluster and the preferred accumulation zone.
Aggressive Early Entries:
450–470 on sharp dips, but main focus remains 400–450.
⛔ Invalidation Level
345 USD
A break below this level invalidates the mid term bullish structure.
🎯 Take Profit Targets
TP1: ~600
TP2: 680–720
Potential completion of the final fifth wave.
🧭 For Current Holders
Continue holding while above 345.
Use a protective stop below 345 if trading shares.
Options traders may hedge instead.
🆕 For New Buyers
Avoid entering near ATHs.
Wait for the 400–450 pullback.
Use 345 as your hard-risk level.
2. Fundamental Overview: Great Business, Clearly Overvalued 💼📊
Microsoft has delivered very stable mid-teens growth for years:
Revenue growth: 15–17 percent annually
EPS growth: also 15–20 percent annually
Last 3 quarters: EPS +9–12 percent, revenue in the same range
This is a mature mega-cap, not a hyper-growth name.
⚠️ Buybacks Stopped
Company regularly bought back shares for six years
Stopped in March 2023 and hasn’t resumed
This removes a major EPS-boosting engine
📉 Valuation (Peter Lynch style)
EPS growth ≈ 15 percent
P/E ≈ 30
Stock trades at ~2x its fundamental fair value
Conclusion:
Amazing business. Predictable. Cash generative. 🔥
But fundamentally overpriced and in the late stage of its growth curve.
3. Technical Picture: Still Bullish, but Late in the Cycle 📐📈
📅 Long Term Channel Since 2010
Price has stayed inside a massive uptrend channel for 14+ years.
As long as MSFT remains inside it, the primary trend stays bullish.
📏 200-Day Moving Average
MSFT consistently bounces from the 200d MA on the weekly.
That keeps the structural bull trend intact.
🌊 Elliott Wave Context
Currently in the 5th sub-wave of a larger 3rd wave
Upside still possible
Potential final wave targets: 600–700
⏳ What Comes After
Once this major wave completes:
Expect a multi-year sideways cycle (5–7 years) as the market distributes the massive positions accumulated since 2009.
4. Current Structure: A Correction Is Likely Before New Highs 🔄
We already saw an A–B–C correction, but structure suggests another A–B–C, forming a zigzag, before the final move higher.
🎯 Why 400–450 Is the Key Zone
Major liquidity & support cluster
Aligns with channel midline and prior consolidation
Perfect area for a 5th wave launch
If MSFT hits 400–450 and bounces → 600–700 is back on the table.
5. What To Do Based on Your Situation 🧭
✔️ If You Already Hold MSFT
Stay in the trade while above 345
Expect volatility
You can hedge or use a stop below 345
🟦 If You Want to Enter
Don’t FOMO near the highs ❌
Wait for a pullback into 400–450
Start with partial size, add on confirmation
345 = hard stop
⚡ If You Trade Short Term
Shorts are counter-trend
Treat every drop as a tactical move, not a macro reversal
Unless 345 breaks
6. Final Thoughts ✨
Microsoft is still in a powerful long term uptrend, but:
Fundamentally overvalued
Technically late stage of its long cycle
Likely to give a clean buyable correction
Best accumulation zone: 400–450
Invalidation: 345
Upside targets: 600–700
It’s a “buy the dip, not the rip” market for MSFT.
Not financial advice — manage risk according to your plan.

BLMZ - bottom building or just warming up before a move?BLMZ continues to hold the key 0.14 support zone, where the market has built a tight accumulation base after completing the previous descending channel. Volatility compression, multiple retests of the horizontal level, and persistent lower wicks indicate active absorption by buyers. A rebound from 0.14 opens the way toward the first structural target at 0.50 - the liquidity zone of the previous range and a confirmed breakout above it unlocks the next target around 0.65, aligned with the upper imbalance area of the prior structure.
Company: BLMZ (Harrison Global Holdings) is a holding entity focused on distressed and developing assets, investing in undervalued businesses and restructuring opportunities.
Fundamentally , as of November 15, the company remains in a restructuring stage with low revenue, minimal liabilities, and attempts to stabilize operating expenses. As a typical microcap, the stock combines weak financials with high sensitivity to news, low float, and thin volumes. The balance sheet structure - low debt, ongoing corporate reboot, and occasional institutional interest - creates potential for sharp upside moves if a positive catalyst emerges.
As long as price stays above 0.14, the accumulation structure remains valid. A move above 0.18 pulls the range toward 0.30, and a full breakout of the upper boundary sets targets at 0.50 and 0.65. Losing 0.14 returns the stock to an extended sideways phase, though the current formation increasingly resembles pre-impulse positioning.
The chart may be whispering for now, but whispers often turn into sudden moves in the microcap world.

FLNC 1D – The power comeback!On the daily chart, Fluence Energy (FLNC) shows a clean cup and handle formation followed by a golden cross (MA50 crossing above MA200) - a textbook bullish reversal setup.
Price broke out of the structure and is now pulling back into the buy zone ($14.57–$16.80) - a confluence of Fibonacci support and previous resistance.
✅ Golden cross confirms trend reversal
✅ Rising volume supports the move
✅ MAs below price - bulls are in control
The first target sits near $27.43, while the second projection extends to $40.28 if momentum continues.
Fundamentally, Fluence remains a leader in energy storage and grid technology - a hot spot for global investment as the renewable sector accelerates.
Let’s just say - this chart looks fully charged ⚡️

USDCHF 1D – the dollar wakes upAfter a long decline, the pair finally shows some life - on the daily chart we have a clean breakout from the falling wedge followed by a retest.
Price now holds inside the buy zone (0.795–0.803) - the perfect base for a potential bullish move.
Technically, the setup looks solid:
✅ breakout confirmed
✅ retest completed
✅ volume rising
✅ momentum turning bullish
The first resistance sits at 0.808, where a minor pause could appear.
If buyers hold control above that level - the path to 0.823 (1.618) and later 0.848 (2.618) opens up nicely.
Structure remains bullish as long as the buy zone stays intact.
And remember: you don’t fight the wedge - you ride the breakout.

LZ 1D: Legal move to the upside?On the daily chart, LegalZoom broke out of a falling wedge and perfectly retested the breakout area - almost textbook stuff. The buy zone around 9.25–9.89 aligns with the 0.5–0.618 Fibonacci retracement and previous volume cluster, giving the setup extra strength.
With both MA50 and MA200 below the price, momentum stays bullish. The first technical target lies near $15.33, with potential extension toward $20+ if broader sentiment remains supportive.
From a fundamental view, LegalZoom benefits from renewed demand for digital legal services and cost optimization. Not a bad combo - solid technicals plus improving business dynamics.
So yes, bulls have the gavel now - let’s just hope the verdict is in their favor

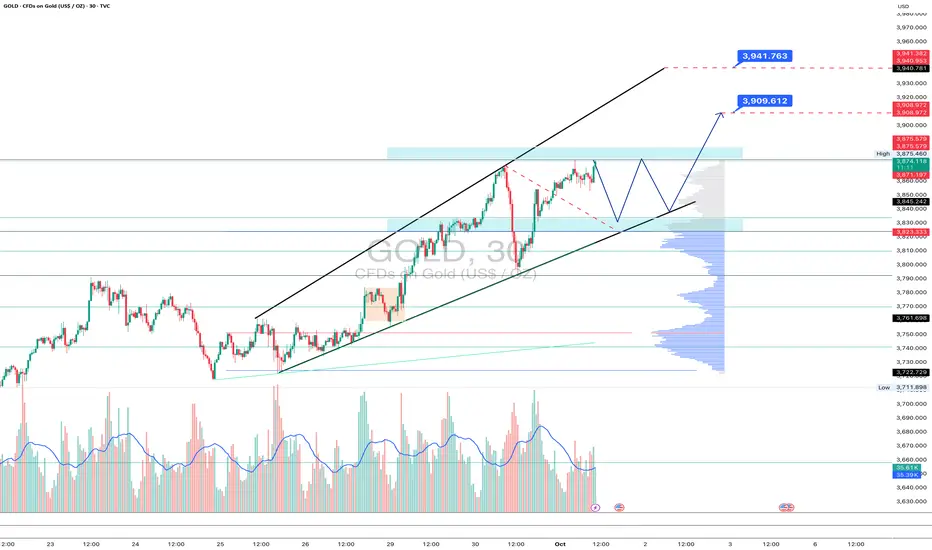
Gold is preparing a pause before a new breakthroughOn the 30-minute chart, gold remains inside the ascending channel but is showing local signs of overheating: price hit resistance around 3875 and pulled back.
The technical setup suggests a correction towards the channel support and the 0.5–0.618 Fibo zone (3833–3823), where buyers are expected to step in. If support holds, the bullish trend may resume with targets at 3909 and 3941.
Volume indicates selling pressure at highs, but the overall trend remains intact - moving averages are pointing upward, and the higher-high structure is still valid.
Tactical plan: watch how the 3833–3823 zone reacts; if buyers confirm control, gold has room for another strong push.
And if bulls rush without giving a pullback - that’s the classic “market never waits for your comfy chair” scenario.
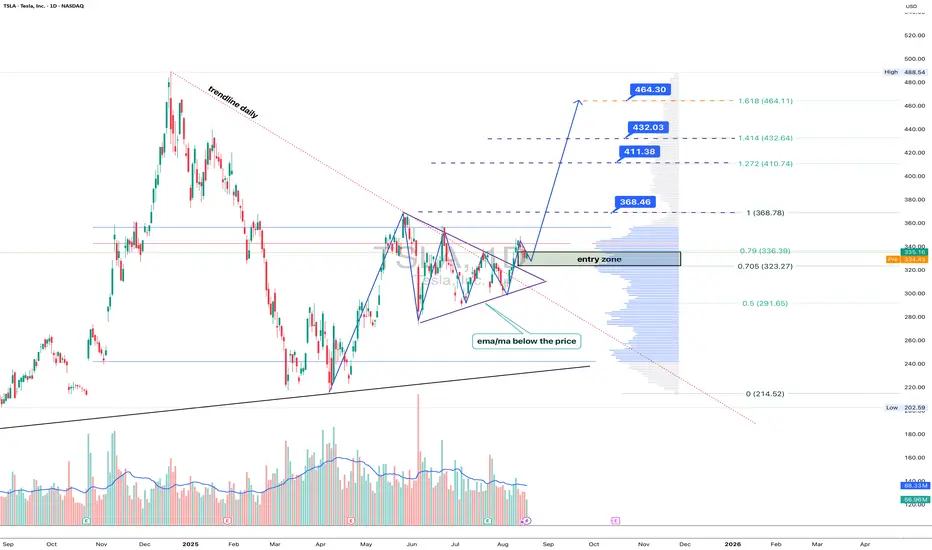
Tesla: breakout mode, Elon’s rocket fuel for the chartTechnically , Tesla broke out of a symmetrical triangle while holding above EMA/MA supports, which confirms bullish control. The breakout unlocks targets at 368.46 (Fibo 1), followed by 411.38, 432.03, and the 1.618 extension at 464.30. Volume profile confirms strong accumulation below, leaving the upside path less crowded.
Fundamentally , Tesla keeps investor attention alive. EV sales stabilized, but the focus has shifted to AI and robotaxi — Musk’s latest promises of disruption. With Fed rates peaking and yields easing, growth stocks regain momentum. Risks remain from Chinese competitors, yet Tesla’s margins are still leading the industry.
Tactical plan : entry zone stands at 323–336. As long as price holds above it, buyers target 368.46 → 411.38 → 464.30. A break below 323 would flip the bias back toward 291.
Bottom line: Tesla’s chart looks ready for lift-off. Musk might be dreaming of Mars, but for now, bulls are happy if he just launches the stock a few hundred dollars higher.
BMNR 4H – cup with handle or champagne glass?The current technical setup on BMNR (4H) shows a potential “cup with handle” structure forming within a clear accumulation zone. Price is holding above both the MA50 and MA200, which are positioned below and confirm buyers’ control. The 4H trendline acts as dynamic support, while the 48–50 zone remains the key entry area. The upside potential extends toward 97.50, making this setup attractive for a medium-term outlook. Volume support during the last bounce favors the bullish case, and RSI recovery from oversold levels suggests renewed demand.
From a fundamental standpoint, BMNR is still tied to the volatility of speculative growth stocks, yet growing investor appetite for niche digital tech solutions and broader market optimism amid potential rate cuts provide a tailwind.
Tactical plan: accumulation from the 48–50 buy zone, with targets at 71.7, 86.2, and a final destination at 97.5.
The structure looks like a champagne glass - now it’s just a matter of waiting for the toast at higher resistance.

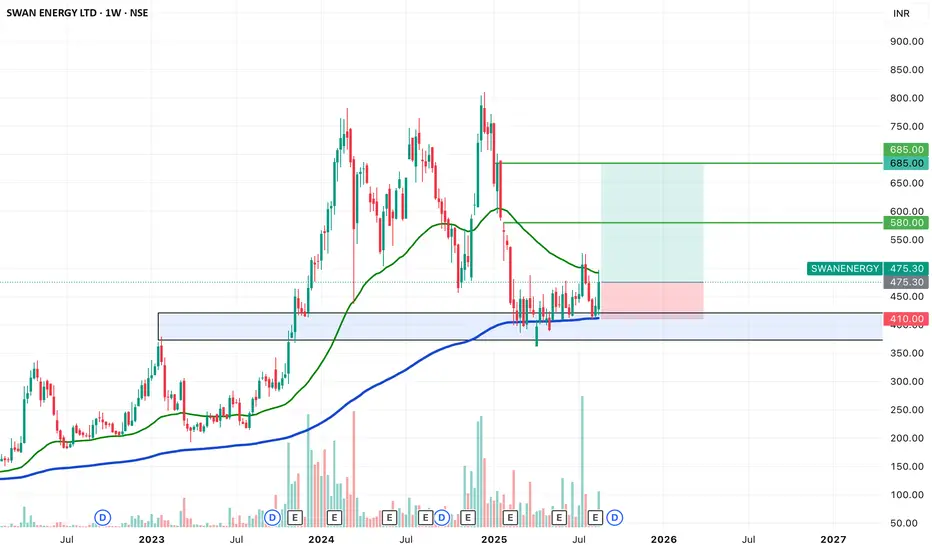
SWING IDEA - SWAN ENERGYSwan Energy , a diversified company with interests across textiles, energy, and real estate, is showcasing a strong swing trade opportunity backed by reliable technical signals.
Reasons are listed below :
The 450 zone has acted as a strong support, and price is now attempting a breakout from a 6-month Darvas box consolidation.
A strong bullish engulfing candle on the weekly timeframe signals renewed buying interest.
The 200 EMA on the weekly chart is acting as a solid support.
The stock is also bouncing from the golden 0.618 Fibonacci retracement zone.
Target - 580 // 685
Stoploss - weekly close below 410
DISCLAIMER -
Decisions to buy, sell, hold or trade in securities, commodities and other investments involve risk and are best made based on the advice of qualified financial professionals. Any trading in securities or other investments involves a risk of substantial losses. The practice of "Day Trading" involves particularly high risks and can cause you to lose substantial sums of money. Before undertaking any trading program, you should consult a qualified financial professional. Please consider carefully whether such trading is suitable for you in light of your financial condition and ability to bear financial risks. Under no circumstances shall we be liable for any loss or damage you or anyone else incurs as a result of any trading or investment activity that you or anyone else engages in based on any information or material you receive through TradingView or our services.
@visionary.growth.insights
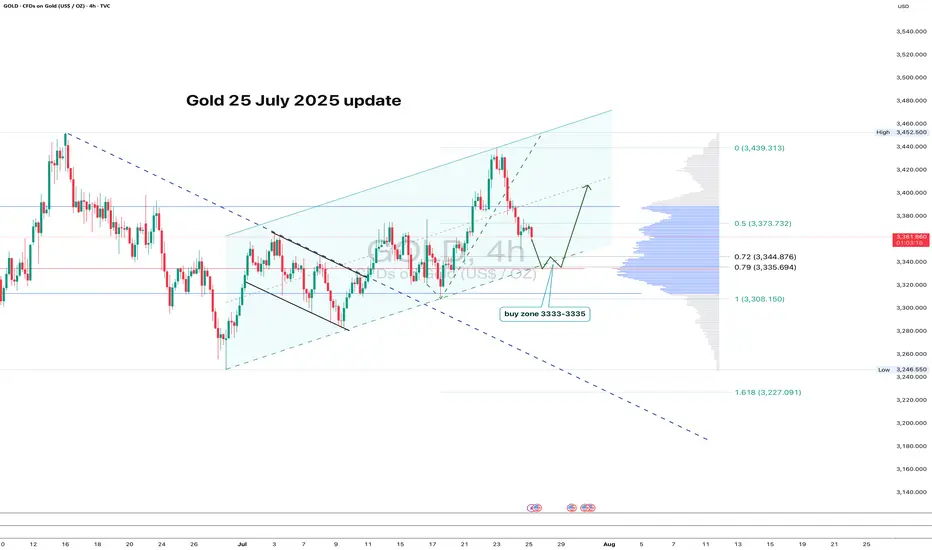
GOLD: clean pullback - now let’s see if support holdsGold continues to trade within an ascending channel on the 4H chart. After a local high, the price pulled back and is now approaching the key zone at 3333–3335. This area lines up with the 0.79 Fib retracement, the lower channel boundary, and a major volume cluster — a classic confluence zone.
If buyers show up here and we get a bullish reversal candle, this becomes a valid long setup with a tight stop just below the level. First target is 3373 (0.5 Fib), followed by a potential retest of the high near 3439.
The structure remains intact, the pullback is orderly, and volume supports the move. As long as the channel holds - the bias stays bullish.
Boeing (BA, 1W) Falling Wedge + H-Projection TargetOn the weekly chart, Boeing has formed a classic falling wedge — a bullish reversal pattern that typically signals the end of a correction phase. After a sharp decline from $267.97 to $138, price action began to compress within a wedge, forming lower highs and higher lows on declining volume — a textbook setup for a breakout.
The structure remains active: a confirmed breakout above the upper wedge boundary, with a retest near $181.60 (0.618 Fibonacci retracement), would validate the pattern and trigger the next upward phase.
The projected move (H) equals the height of the previous impulse — $130.02. Adding this to the base of the wedge (~$138) yields a technical target of $268.00, aligning with the previous high and completing the structural recovery.
Technical summary:
– Multiple confirmations of wedge support
– Volume declining into the apex (bullish)
– Entry zone: breakout + retest at $181.60
– Mid-level resistance: $198.09 (0.5 Fibo)
– Final target: $267.97–$268.00 (H-projection complete)
Fundamentals:
Despite operational setbacks, Boeing remains structurally positioned for recovery as demand for commercial aircraft rebounds. Additional support could come from improving supply chains, increased defense contracts, and a more dovish outlook from the Federal Reserve heading into 2025.
A breakout above $181.60 and sustained momentum would confirm the falling wedge pattern and activate the H-measured move toward $268. This is a structurally and fundamentally supported mid-term recovery setup

SILVER 1DA possible scenario for silver on the daily timeframe involves buying from the levels of 30.90-31.00 with further targets at 33.02, 34.8291 and the expected completion of the rounding pattern with a subsequent movement to the zone 40.0251
Everything is clearly depicted on the graph!
Have a good day!

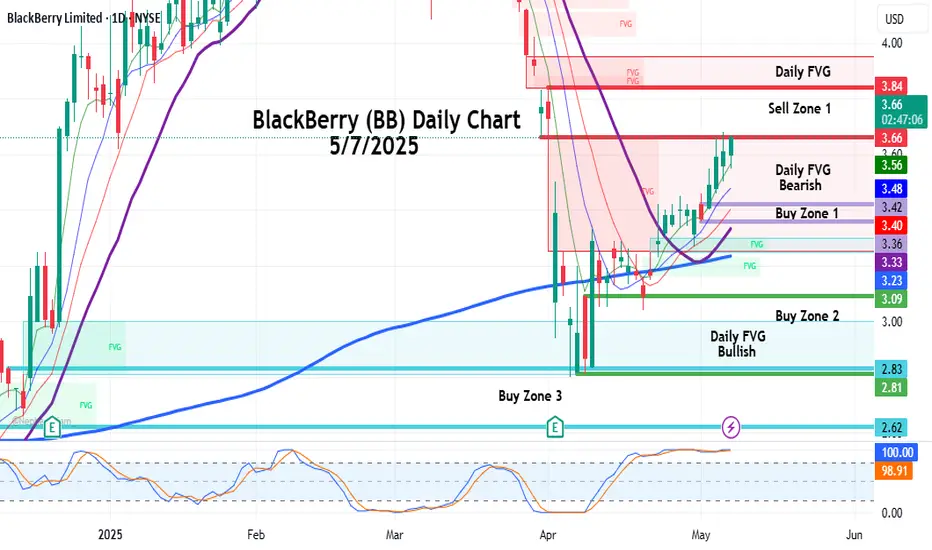
Backberry is up, still a good outlook at the Sell Zone!My first area of support is at my Buy Zone 1 which starts at $3.42 down to $3.36 where it hovered for days, and there's a bullish ICT Order block in that zone. It shot out of there and is at $3.67 now. I'm going to wait because my Sell Zone started at $3.66 so we may get some resistance in this area. However, long-term I'm Bullish on BlackBerry, because there's a chance that even a small pullback to my 1st buy Zone at $3.42 would potentially give a great entry to hold.
ADA Cardano announced as part of strategic reserve!!Final liquidity run rapidly approaching as we come off news of strategic reserve!
Ensure LIMIT buy orders are placed at .50 area or just below to ensure they get filled. Just below the last big wick on daily/4hr tf. This news will be manipulated once again to trap over-leveraged bulls & then bears imo.
Perfect opportunity to enter cheap once again & then ride it to 20-50$ buy cycle targets over upcoming months.

XRP strategic reserve announcment! UPDATED FORECASTAs indicated in prior post (see: ) we have now reached the near term liquidity target at 2.8-2.9 zone; this news of a strategic reserve is highly likely to be sold off to trap both bulls & bears who are over-leveraged.
They rarely waste a good PR for such price action.
Expecting one more liquidity sweep below 1.70 for a final discount buy opportunity!! Looking to enter with LIMIIT buy orders at 1.65 area; its possible that we extend as low as 1.35 but my mentality is its best not to be idealistic, perfectionistic, or entitled at those levels! The market does not owe you the best or lowest price on anything! For that reason, consider anything below 1.70 to be a huge gift with a big big bow wrapped around it!

Nasdaq volatility ahead into close of week!Wonderful opportunity to extract profits from the markets on current Nasdaq futures setup.
Pay close attention to those buy-side & sell-side liquidity zones relative to the doji candle established on the 15min tf. Expect that range to be tested once again into London/NY sessions.
Sell-side liquidity target expected to be reached at 21075-21090 levels, corresponding to 1.272 fibonacci extension target on sell structure. After that, I anticipate a strong buy sequence to 21440's buy-side target

A1+ setup...BTC will pump up immediately it grabs liquidity !!!if you are willing to risk 33 pips for 300 pips, this setup is for you then !!!
Reason for entry
* Valid zone
* M5 point of Interest
* Inducement is resting just above the M5 POI
* Due to the fact that investors are hedging their risks on XAU USD because of tarrif talks, BTC USD might share from the gains (my sentiments)
* Bullish structure,

PLUG power consolidation completed! Buy setupBuying now at discount levels near structural support. Expecting bullish thesis to be solidified once we recover above 1.9-2.2 levels.
Expecting fairly rapid progression to gap fill targets by 2026.
Strongly likely we see 6$ before summer 2025 & 10-12$ levels by end of yr
Planning to scale out of buy positions primarily at 10-12$ range. Will leave remainder for long term speculation for possible 14-20$ levels.

Cardano ADA headed for more volatility!!Looking for current buy sequence to reach 0.85-0.92 by early March timeframe. To be followed by one final sell wave as low as .45 area before continuation back to the highs.
Next buy-side targets will be
TP1 @ 3.00
TP2 @ 7.00
