SILVER (XAGUSD): Confirmed Breakout
As I predicted yesterday, Silver successfully violated a key
horizontal resistance cluster.
It turned into a support now.
I will expect a bullish continuation from that.
Next resistance - 88.0
❤️Please, support my work with like, thank you!❤️
I am part of Trade Nation's Influencer program and receive a monthly fee for using their TradingView charts in my analysis.
Candlestick Analysis

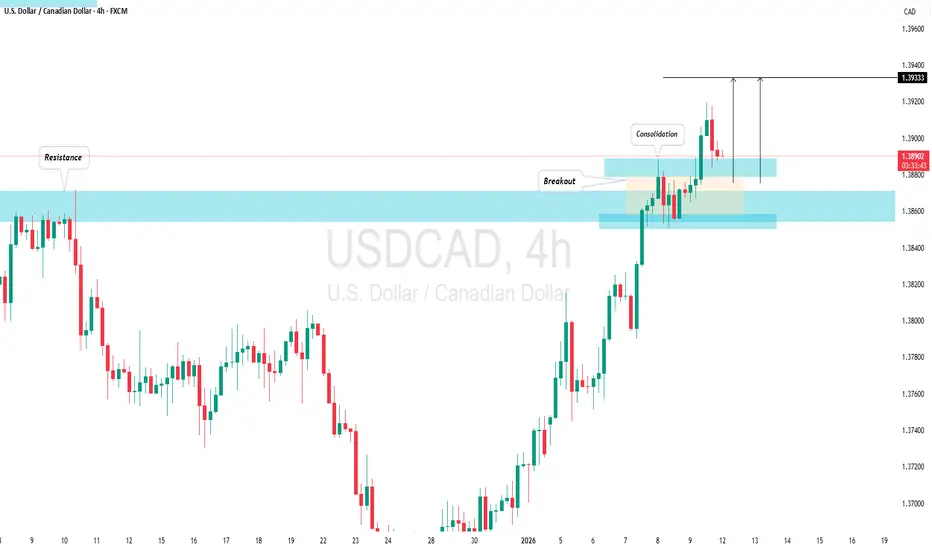
USD/CAD: More Growth Ahead!The USDCAD pair successfully breached and important daily resistance level last week, confirming a bullish Break of Structure (BoS).
Following this, a retest of the previously broken structure was observed on Friday, leading to subsequent consolidation.
A bullish breakout above its intraday resistance further confirms this upward trend.
We anticipate continued upward movement for the pair, projecting it to reach 1.3933 soon.
NZDUSD SHORT Market structure bearish on HTFs 3
Entry at Weekly and Daily AOi
Weekly Rejection at AOi
Previous Weekly Structure Point
Daily Rejection At AOi
Previous Daily Structure Point
Daily EMA retest
Around Psychological Level 0.57500
Touching EMA H4
H4 Candlestick rejection
Rejection from Previous structure
TP: WHO KNOWS!
Entry 125%
REMEMBER : Trading is a Game Of Probability
: Manage Your Risk
: Be Patient
: Every Moment Is Unique
: Rinse, Wash, Repeat!
: Christ is King.

#GBPNZD: Swing Buy Latest Update 15/12/2025 Swing Setup! Dear Traders,
Swing Buying Setup On OANDA:GBPNZD 📈
🔺The GBP/NZD pair has been bearish for a few weeks. It recently broke through the bearish trendline and is currently correcting. The current volume suggests further price growth and volume is likely to increase throughout the week.
🔺Keep your stop loss below the previous low and your take profit at the red horizontal line. Always use risk management and conduct thorough research before making any buying entries.
When To Buy? 💭
🔺The best buying zone is the current price zone where the price is likely to reverse. We’re simply waiting for the market volume to increase.
Support And Encouragement❤️🏆
Like and comment on our trading ideas, this will help us help you more.
As always stay safe and trade safe!
Team Setupsfx_


USDJPY – Moving Closer to Potential Intervention LevelsYesterday, the US dollar took a hit against many major currencies as traders reacted negatively to news that the Federal Reserve had been served with grand jury subpoenas from the US justice department threatening a criminal indictment, which was widely seen as a major escalation of the Trump administration’s challenge to the US central bank’s independence.
What was interesting is that USDJPY managed to hold firm, registering only a brief dip to 157.52 (Jan 12th low) before resuming its push back to highs just above the 158 level. Move forward 24 hours and it is perhaps no surprise that after observing this type of price action, USDJPY has extended its up move to a high of 158.97 at the time of writing this morning (0630 GMT).
Previous attempts to probe this area have been met with verbal intervention from Bank of Japan (BoJ) and Ministry of Finance (MoF) officials who have mentioned the potential for physical intervention if JPY weakness, dollar strength continued to be an on-going problem, and this was again the case overnight with officials warning against ‘one sided’ JPY moves (Reuters). In the past, these types of comments alone were enough to push USDJPY back lower again, but it remains to be seen if this will be the case on this occasion.
The reason for this is that traders may need to factor in the impact on the dollar (USD) side of the currency pair from US CPI data that is released at 1330 GMT. This inflation update could have an outsized influence on the direction of USDJPY depending on whether it deviates above market expectations or not. This is because it could significantly change the current market outlook for 2 Fed rate cuts in 2026, with the first being due as soon as April.
Many observers are watching 160.00 in USDJPY as the first line in the sand that may draw actual intervention from the MoF, so paying attention to moves around this level could be prudent. Assessing the technical outlook could also be beneficial.
Technical Update: Can The Current Move Higher Continue?
January has been a positive month for USDJPY so far, with the move from the 156.12 low on January 5th to this morning’s current 158.97 high, marking a 1.8% advance. This follows the recent slowing in the upside momentum, which resulted in a choppy, sideways phase of price activity from the November 20th high.
However, as the daily chart above shows, today’s current price action is producing a new recovery high for this up move. That naturally raises the question of whether the current strength can continue, or if this will once again prove to be a brief break to new highs before fresh weakness emerges. In this situation, being aware of the next key support and resistance levels could be important in helping to gauge where price action may head next.
Potential Resistance Levels:
There is no guarantee that a break to new recovery highs in price will lead to a sustained period of strength, and as the weekly chart below shows, there is another layer of historical resistance, which at the time of writing (0630 GMT) is currently being tested at 158.88, a level which corresponds to the January 2025 failure high.
Given how long this resistance has remained in place, the 158.88 level arguably represents an important area to monitor. A closing break above this point could be needed to unlock potential for further upside attempts. If such a break occurs, the next upside focus might then shift toward 161.95, which is the July 2024 failure point.
Potential Support Levels:
Of course, the 158.88 resistance level may still cap USDJPY on as closing basis tonight, allowing fresh weakness to develop. If that happens, attention could shift to 157.19 as the first possible support level. This is the 38.2% Fibonacci retracement of the December 16th to January 13th advance. A closing break below 157.19 may be needed to signal scope for a move to lower levels.
A confirmed closing break below 157.19 could trigger further downside pressure, with 156.12, which is the deeper 61.8% retracement, emerging as the next support. If that level also gives way, the downside potential may extend toward a test of 154.39, which is the December 16th low.
The material provided here has not been prepared accordance with legal requirements designed to promote the independence of investment research and as such is considered to be a marketing communication. Whilst it is not subject to any prohibition on dealing ahead of the dissemination of investment research, we will not seek to take any advantage before providing it to our clients.
Pepperstone doesn’t represent that the material provided here is accurate, current or complete, and therefore shouldn’t be relied upon as such. The information, whether from a third party or not, isn’t to be considered as a recommendation; or an offer to buy or sell; or the solicitation of an offer to buy or sell any security, financial product or instrument; or to participate in any particular trading strategy. It does not take into account readers’ financial situation or investment objectives. We advise any readers of this content to seek their own advice. Without the approval of Pepperstone, reproduction or redistribution of this information isn’t permitted.

Crypto is Shifting GearsHello I am the Cafe Trader.
Today we’re looking at COIN
Price has rotated down and is now getting accumulated in the Demand zone. This is the same area where buyers previously stepped in. The move lower has lost momentum, and price is no longer accelerating to the downside.
If buyers continue to absorb supply here, COIN has room to rotate higher and eventually work back toward the upper range.
If demand fails, then the next lower pocket becomes the area to watch.
But until that happens, this remains a buy-side controlled zone.
This is a longer-term positioning chart, not a short-term trade. Use it for context if you’re involved in crypto-related equities or looking to scale exposure over time.
Entry 245
SL 180
TP 420
RR 2.74
Happy Trading,
@thecafetrader ☕📈

Plan for 13h January 2026 Nifty future and banknifty future analysis and intraday plan.
Quarterly results-
This video is for information/education purpose only. you are 100% responsible for any actions you take by reading/viewing this post.
please consult your financial advisor before taking any action.
----Vinaykumar hiremath, CMT


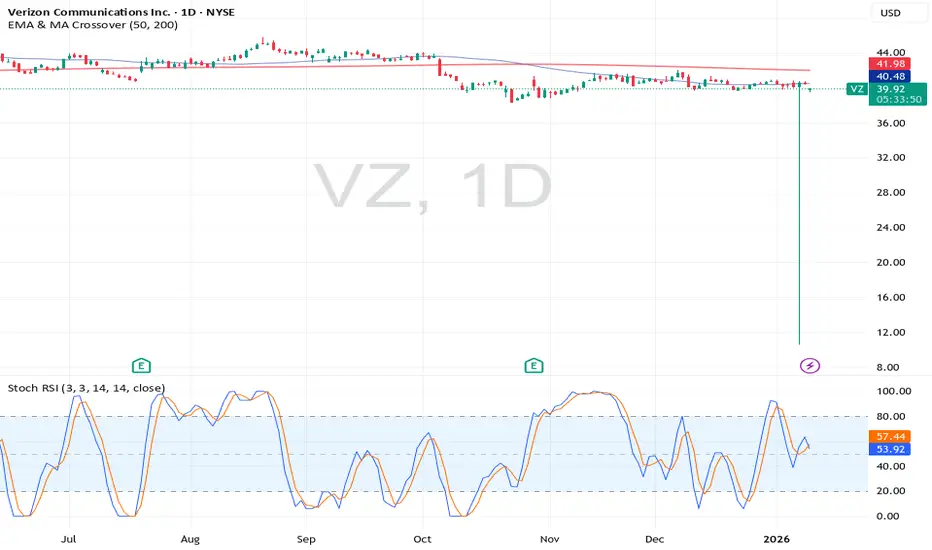
How To Short Sell Using The 3-Step Rocket Booster StrategyAm from listening to
a podcast and its about a wrestler
that started started from nothing
had a dream to be a superstar
and then started working
at a gym
Their at the gym he was introduced
to aspiring superstar wrestlers
that would train at the same gym.
This is when he got his break
and started
Am talking about John Cena.
Listen whatever it is that you
want you can achieve it
nothing is impossible
i thought i document
this trade because i have always wanted to learn
how to short sell
So am going to show you how using
the 3 step rocket booster strategy,
-The price has to be below the 50 ema
-The price has to be below the 200 rma
-The price has to gap down.
This price action is the
perfect example
this is why i feel you have
to see this trade
live ..
and not only that
in this price action i used the
candlestick pattern
called "the spinning black top"
Also this is a swing trade which
is a strategy i am perfecting
in order to find better quality
trades
this is how you short sell
thank you for reading trade
safe.
Rocket boost this content to learn more
Disclaimer:Trading is risky please learn more about risk
management and profit taking strategies,
Also use a simulation trading account before you trade with real money.

Too Late to Buy Silver?Hello I am the Cafe Trader.
Today we’re looking at Silver (SLV). After a strong, almost vertical run many are wondering if this has more in the tank? or are we too late?
Unfortunately when breaking new territory on pricing, it can be hard to pick tops or bottoms, but here are some ways you can play SLV if you are late to the game
Top of Demand . This is where the current Strong demand is sitting. We should see a reaction at this level. People at this area have aggresive sentiment, and will be looking to add here. If we start to break this level, then we could see the market try and find liquidity again.
Green Scenario
If buyers continue to defend the Top of Demand around the mid-60s, Silver can stay elevated and work higher through consolidation. This would likely look choppy at first, but as long as demand holds, the path remains open for a continuation even into the 100s (Many people might look to take profiit at $100 since it is a psycological number, so keep that in mind.)
Entry around $64 - 64.50
Exit (your choice) but I gave you a 3/1RR option.
Stop loss can be tighter then what I have drawn here, but with the volatility this high, keep it super tight, or loose, nothing in between. I am showing a loose Stop loss.
Red Scenario
If we lose the Top of Demand, I would expect a deeper rotation into the Strong Demand zone below. That area represents conservative area for buyers after such an aggressive run. A dip into that zone would not be bearish in the bigger picture — it may even pose a hotter reaction. We want price to hold above that Key level . The closer you can get an entry to that price the better.
Long Term
Aggressive: Top of Demand (~64)
Value: Strong Demand (~48–50)
Extreme Value: Key Level / Bottom of Demand (~44)
Overall, Silver looks strong. The question isn’t whether the trend is bullish — it’s whether buyers choose to hold price up here, or let it rotate lower to build a stronger base. Either outcome can still support higher prices over time.
Happy Trading,
@thecafetrader

CO.PA LONG - RSI extreme positive divergenceSince long this stock shows positive divergence on the chart.
Something is going to happen.
A bit speculative, but don't miss the chance to make profit of this signal.

Selena | XAUUSD – 1H | Market Structure & Live AnalysisPEPPERSTONE:XAUUSD
Price previously rejected from the upper channel resistance, triggering a deep correction. That correction formed a range-out zone, where sellers failed to continue downside. The breakout from this range indicates re-accumulation, not distribution. Current price action is a pullback into a previous intraday demand / breakout retest zone, which aligns with the channel midline — a high-probability continuation area.
This is not a random buy. This is structure-based continuation.
Key Scenarios
✅ Bullish Case 🚀
If price holds above the highlighted demand zone and respects channel support, continuation toward HTF highs is expected.
🎯 Target 1: 4,500
🎯 Target 2: 4,540
🎯 Target 3: 4,580 (HTF resistance / liquidity)
❌ Bearish Case 📉
A strong 1H close below the demand zone and channel support would invalidate the bullish continuation and suggest deeper correction toward 4,300.
Current Levels to Watch
Resistance 🔴: 4,500 – 4,560
Support 🟢: 4,420 – 4,440
Invalidation ❌: Below 4,400 (1H close)
⚠️ Disclaimer: This analysis is for educational purposes only. Not financial advice.

AUDCAD OutlookI've taken a sell at that Supply area, Low probability setup but worth giving a shot.
Break and retest of that demand will confirm further downside, if not price will violate the sells
Manage risk well if interested


CADCHF LONGTrade IDEA 1 for 2026:)
Market structure bullish on HTFs DW
Entry at both Weekly And Daily AOi
Weekly Rejection at AOi
Previous Weekly Structure Point
Daily Rejection at AOi
Previous Daily Structure Point
Around Psychological Level 0.57500
H4 Candlestick rejection
TP: WHO KNOWS!
Entry 95%
REMEMBER : Trading is a Game Of Probability
: Manage Your Risk
: Be Patient
: Every Moment Is Unique
: Rinse, Wash, Repeat!
: Christ is King.

GBPUSD ____ SHORT TRADE IDEAHi Guys,
I'm expecting some bearish move after price displaced from a weekly orderblock and formed a shift in market structure.
My speculation is that we trade to the inversion fair value gap on the weekly chart.
Cheers,
Jabari

#USDJPY SHORTWe finally got the move that was supposed to happen Friday. Sundays sometimes a given and this was it for me.


USD/JPY(20260114)Today's AnalysisMarket News:
The U.S. Labor Department reported on Tuesday that the U.S. CPI rose 2.7% year-on-year in December, unchanged from November. Excluding volatile food and energy costs, the core CPI rose 2.6% year-on-year, also unchanged from November. Both figures were below market expectations.
On Tuesday, traders increased their bets that the Federal Reserve might not wait until Fed Chairman Powell's term ends in May to cut interest rates. While traders still believe a June rate cut is the most likely outcome, the latest data projects a 42% probability of a Fed rate cut in April, up from 38% before the data release.
Technical Analysis:
Today's Buy/Sell Threshold:
158.72
Support and Resistance Levels:
160.01
159.53
159.22
158.23
157.91
157.43
Trading Strategy:
If the price breaks above 159.22, consider buying with a first target price of 159.53.
If the price breaks below 158.72, consider selling with a first target price of 158.23.

WARNING - Michael Saylor Manipulates Market - Buys 1.5 BillionPlease give me a follow on tradingview for future updates!
------ MARKET MANIPULATION WATCH
Looking at the 1 Week Chart for BTCUSD, it appears that we're about to see a golden cross on the MACD (12,26,close)
However, on the 1-month chart, the MACD and RSI data looks terrible , with a death cross that began around October 2025. See chart:
Although the 4 hour view or other short term views may look bullish, the 1 day is showing negative signs.
Today Michael Saylor purchased 1.5 Billion of Bitcoin.
Troublesome waters. Be VERY careful, you may see charts with a false golden cross due to saylors massive whale market manipulation. Many long-term HODLers are selling right now, probably for good reason.
Happy Trading and Please subscribe/follow me here on tradingview for future updates.

Long trade Buyside trade
Pair PENGUUSDT Buyside trade
Thu 8th Jan 26 LND Session PM 3.00 pm
Entry 0.011734
Profit level 0.013628 (16.14%)
Stop level 0.011588 (1.24%)
RR 12.9
Market Structure & Context
Higher-timeframe structure remains bullish, with price respecting a range low/demand base following prior expansion. The market completed a liquidity sweep into equal lows, inducing sell-side liquidity before displacement. Subsequent BOS (Break of Structure) confirms bullish continuation intent. Price re-entered and respected a discount Fair Value Gap (FVG), aligning with optimal trade entry conditions.
Market behaviour suggests accumulation → manipulation → expansion, with London PM acting as the fuel for directional continuation
