PEP (PEPSI) Is ready to RISEThere is a bullish candle and the RSI has risen sharply forming a breakaway gap and the stock is ready to rise higher on increased momentum
Candlestick Analysis

EUR/USD: Important Bullish Breakout The EURUSD pair has successfully violated and closed above a significant resistance level, which was established by a prior higher high.
This confirmed break of structure suggests a strong likelihood of continued bullish movement.
The subsequent resistance level is observed at the 1.1700 psychological mark.
This level may represent the next goal for buyers.

Update on Eurusd longsLongs played out well. We are now at a resistance area but there’s upwards momentum looking to break. All stops are at break even no risk to capital involved now💯

L.V.L Capital • Thursday Pre London Session BreakdownSTRUCTURE OF PRICE ACTION
Daily Analysis
•
1st What is Market Doing ?
Trending = BRC Playbook
Consolidation = STR Playbook ☑️ Market @ HH Deciding weather to retrace to Daily Support LVL 4150
Time Frame Correlation
•
WEEKLY & Daily
WEEKLY BIAS | Bullish • Price sitting at HH
1. DAILY • Bearish
2. 4HR • Bearish
3. 2HR • Bearish
4. 1HR • Bearish
**1HR | 30MIN are for watching the trade when live **
EIGHTCAP:XAUUSD EIGHTCAP:XAUUSD What is the Trend Based on Weekly & Daily ?: l Neutral
**ENTRIES ON 2HR CANDLE CLOSE DURING SESSION
** Wait for Confirmation
ANALYSIS :
Price is currently consolidating between the daily Support & Resistance Levels w/ a Area of Interest / Liquidity pool @ 4187.50 Level
Potential Trades
•
Shot #1 Buy off liquidity pool at 4187.5
Shot #2 Sell off down to Daily support 4150


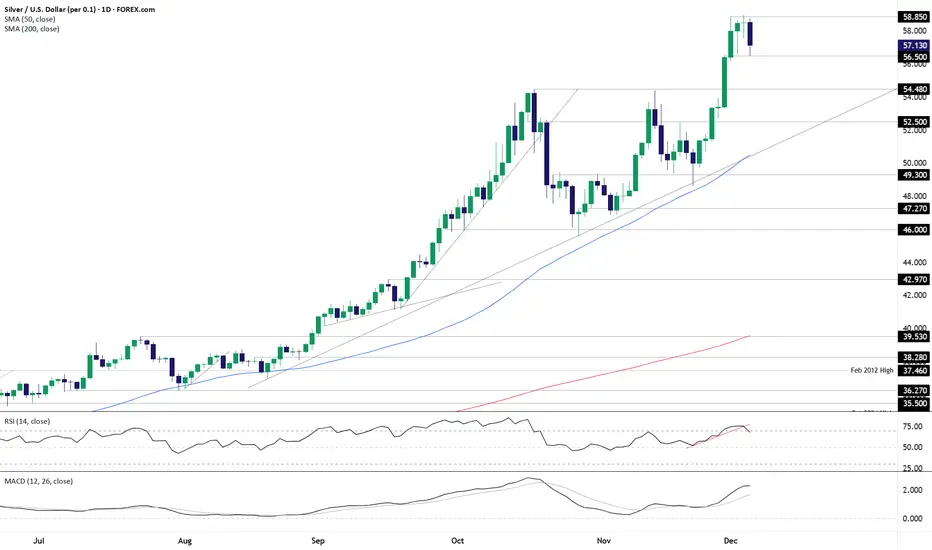
Three candles, one message: Bulls bewareSilver has completed a three-candle evening star pattern following a sharp run higher, warning of bearish reversal risk. However, before acting on the signal, it would be preferable to see the price push below $56.50 before considering short setups, providing a level where a stop could be placed above it for protection against reversal.
Downside targets to consider include $54.48, $52.50 or August uptrend support/50DMA, the latter found today at $50.48.
RSI (14) has broken its uptrend and is curling over but remains above the neutral 50 level, indicting waning upside strength. MACD provides a similar message, beginning to curl over towards the signal line while remaining firmly in positive territory. It’s not a bearish picture being provided by the oscillators, but it does provide a reason for bulls to be cautious around these levels.
While the option is there to act immediately on the bearish signal and initiate shorts at current levels, given the bullish frenzy seen in silver over recent months, risk management looms as particularly important for anyone considering bearish setups.
Good luck!
DS
AUDCAD SHORTMarket structure bearish on HTFs 3
Entry at Both Weekly and Daily AOi
Weekly Rejection At AOi
Daily Rejection at AOi
Previous Daily Structure Point
H4 Candlestick rejection
Rejection from Previous structure
TP: WHO KNOWS!
Entry 100%
REMEMBER : Trading is a Game Of Probability
: Manage Your Risk
: Be Patient
: Every Moment Is Unique
: Rinse, Wash, Repeat!
: Christ is King.

EURAUD Short Market structure bearish on HTFs DW
Entry at both Weekly and Daily AOi
Weekly Rejection at AOi
Daily Rejection at AOi
Previous Structure point Daily
Daily EMA retest
Around Psychological Level 1.78000
Touching EMA H4
H4 Candlestick rejection
TP: WHO KNOWS!
Entry 95%
REMEMBER : Trading is a Game Of Probability
: Manage Your Risk
: Be Patient
: Every Moment Is Unique
: Rinse, Wash, Repeat!
: Christ is King.

GBPAUD SHORTMarket structure bearish on HTFs 3
Entry at Daily AOi
Weekly Rejection at AOi
Previous Structure point Daily
Around Psychological Level 2.02500
Touching EMA H4
H4 Candlestick rejection
Rejection from Previous structure
TP: WHO KNOWS!
Entry 100%
REMEMBER : Trading is a Game Of Probability
: Manage Your Risk
: Be Patient
: Every Moment Is Unique
: Rinse, Wash, Repeat!
: Christ is King.

FireHoseReel | TRX Technical Outlook After Resistance Break🔥 Welcome to FireHoseReel!
Let’s jump into the TRX market structure analysis.
👀 TRX – 4H Overview
TRX has successfully broken above the $0.2824 resistance and is now pushing higher.
Over the past 24 hours, TRX trading volume has dropped by 20%.
📊 Volume Analysis
Watch the volume closely on the chart. Every time price previously reached $0.2824, it faced strong sell pressure and sell orders were heavily filled.
On the third and current test, fewer sell orders were present, and with a slight increase in volume, this resistance was finally broken.
✍️ TRX Trading Scenarios
Below are the active scenarios you can use alongside your trading strategy:
🟢 Long Scenario
Since TRX has broken this resistance, you can enter a long position, placing your stop-loss below the current low.
Alternatively, wait for better consolidation above this level and enter on the pullback for a safer setup.
🔴 Short Scenario
A break below the $0.2791 support, accompanied by strong selling pressure, could lead to a deeper drop and offers a valid short setup.
🧠 Protect your capital first. No setup is worth blowing your account. If risk isn’t controlled, profit means nothing. Trade with rules, not emotions.

Market volatility, pay attention to the daily MA10.#XAUUSD OANDA:XAUUSD TVC:GOLD
Today's market closed below the MA5 on the daily chart, with short-term resistance at 4210-4220. The current market trend is weak, and it may continue to test the support near the daily MA10. If it touches the 4170-4160 area for the first time, you can consider a small long position. If the downward momentum continues strongly, it may further test the 50% retracement level around 4145.

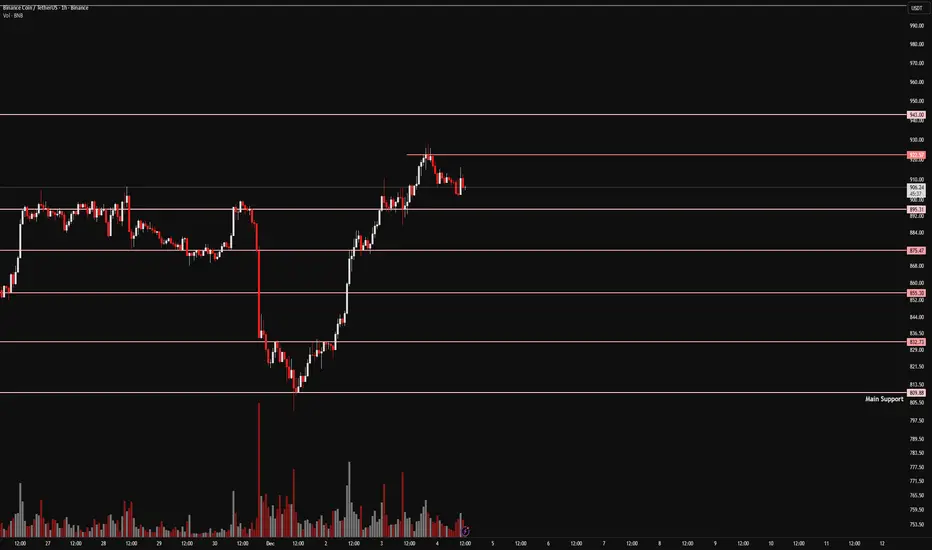
FireHoseReel | BNB Daily Analysis #15🔥 Welcome to FireHoseReel!
Let’s dive into the Binance Coin (BNB) analysis.
👀 BNB – 1H Overview
BNB has successfully activated its long trigger and is now moving higher.
At the moment, BNB is forming a higher low compared to the previous bottom, which strengthens the bullish structure and keeps the upside continuation in play.
📊 Volume Analysis
After the long trigger was activated, BNB volume increased strongly, supporting the upward move.
If buying pressure remains sustained, BNB can continue its rally toward the next key resistance zone.
✍️ BNB Trading Scenarios
🟢 Long Scenario
The main long trigger is already active.
However, the risk-on long trigger will activate with a break above the current high, offering a more aggressive continuation setup.
🔴 Short Scenario
If BNB forms a lower high and a lower low below the $895 level, strong selling pressure could emerge.
That said, on the 4H timeframe, there is still a high probability that this short scenario may fail.
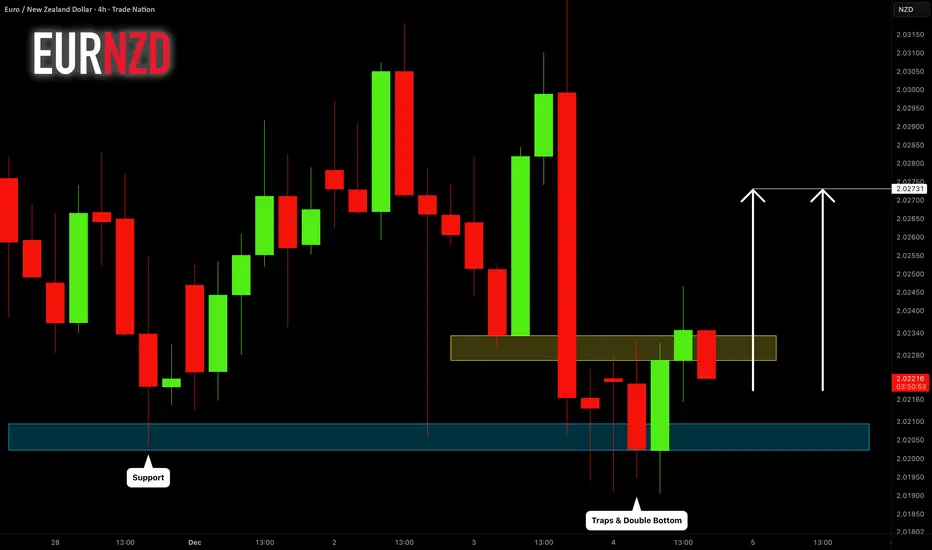
EURNZD: One More Pullback?! 🇪🇺🇳🇿
Looks like we will see another pullback on EURNZD.
The pair looks bullish after multiple traps below a key intraday/daily support.
A double bottom pattern gives a strong confirmation.
I expect a pullback to 2.0273
❤️Please, support my work with like, thank you!❤️
I am part of Trade Nation's Influencer program and receive a monthly fee for using their TradingView charts in my analysis.
Nifty Analysis EOD – December 4, 2025 – Thursday🟢 Nifty Analysis EOD – December 4, 2025 – Thursday 🔴
Bulls Retake 26K: Recovery Capped by Late Selling Pressure.
🗞 Nifty Summary
The session began flat, immediately plunging 50 points to mark the day low at 25,938.95. The subsequent recovery was swift and confident, successfully pushing the Nifty above the initial resistance at 26030 and completing the Initial Balance (IB) formation.
The index then methodically climbed through 26075, PDH, and 26104. Bulls tried hard to sustain above the PDH but failed, leading to a sharp fallback below 25985 and the PDC.
After another strong, 100-point recovery attempt failed to reclaim the PDH, the day concluded with a surprise element: sharp selling in Reliance (2% fall within last 30 minutes) wiped out 50 points in the last 30 minutes.
Despite this late pressure, the Nifty closed successfully at 26,010.35, securing a close above the psychological 26K level. The day was full of action, showing strong territorial fighting from both sides.
🛡 5 Min Intraday Chart with Levels
🛡 Intraday Walk
The initial market weakness was quickly negated by strong buyers at 25938, turning the early move into a deep lower wick.
The strong recovery confirmed demand below 26K. The most crucial structural failure occurred when Nifty broke 26104 but could not hold it, showing overhead supply at that level. This failure indicates that while bulls are defending 26K, they lack the conviction for a sustained breakout.
The final sharp sell-off, attributed primarily to a major heavyweight stock (Reliance), dragged the closing price lower, but the close above 26K remains a small victory for the bulls.
📉 Daily Time Frame Chart with Intraday Levels
🕯 Daily Candle Breakdown
Open: 25,981.85
High: 26,098.25
Low: 25,938.95
Close: 26,033.75
Change: +47.75 (+0.18%)
🏗️ Structure Breakdown
Type: Bullish candle with a moderately long upper wick.
Range (High–Low): ≈ 159 points — demonstrating moderate intraday movement.
Body: ≈ 52 points — reflecting controlled upside strength.
Upper Wick: ≈ 64 points — indicates that buyers attempted a breakout but faced significant resistance near the highs (26,100).
Lower Wick: ≈ 43 points — confirms buyers protected the lower levels early in the session.
📚 Interpretation
The candle is bullish, confirming a successful defense of the 25930 ~ 25920 zone. However, the long upper wick is a warning signal, showing strong supply near 26,100. The overall structure suggests that while bulls are fighting back, they are meeting strong resistance at critical breakout levels. The successful close above the 26K psychological level is the primary positive takeaway.
🕯 Candle Type
Bullish Candle with Upper-Wick Resistance — Upside continuation requires clearing the 26100 resistance decisively.
🛡 5 Min Intraday Chart
⚔️ Gladiator Strategy Update
ATR: 189.97
IB Range: 97.4 → Medium
Market Structure: Balanced
Trade Highlights:
10:07 Long Trade - Target Hit (R:R 1:1.74) (IBH + Resistance Breakout)
12:05 Long Trade - SL Hit (IBH + Resistance Breakout)
Trade Summary: The strategy capitalized on the strong morning recovery from the day’s low, securing an early long target. However, the unexpected high-level rejection and subsequent choppy price action around the PDH resulted in the second trade hitting its stop loss.
🧱 Support & Resistance Levels
Resistance Zones:
26030 ~ 26075
26104
26132 ~ 26160
26220
Support Zones:
25985
25930 ~ 25920 (Immediate Base)
🧠 Final Thoughts
“The fight for 26100 defines the week.”
The market is holding above 26K, which is positive, but the strong selling near 26100 shows bears remain active. For tomorrow’s session, bulls must breach the 26160 gap zone and secure a close above 26100 to maintain bullish momentum. Failure to do so could lead to a re-test of the 25985 support.
✏️ Disclaimer
This is just my personal viewpoint. Always consult your financial advisor before taking any action.


XAUUSD scalp long positionOANDA:XAUUSD After reaching the green zone and by seeing a reversal pattern im 1m timeframe as confirmation, I'll open a long scalp position.

XAUUSD possible buy setupHere we faced a beautiful CHOCH, hunting the liquidity zone and mitigating a valid order block creating a possible long position which is following my previous idea:
*** But we have to consider that the price is below the daily low (purple line) and the volume is not yet powerful to break the descending structure.
So I'll think about the long position only after the breakout of the purple line . Otherwise the price is going to hunt the liquidity around 4,110 if it continues with a powerful descending momentum.
Good luck🤞

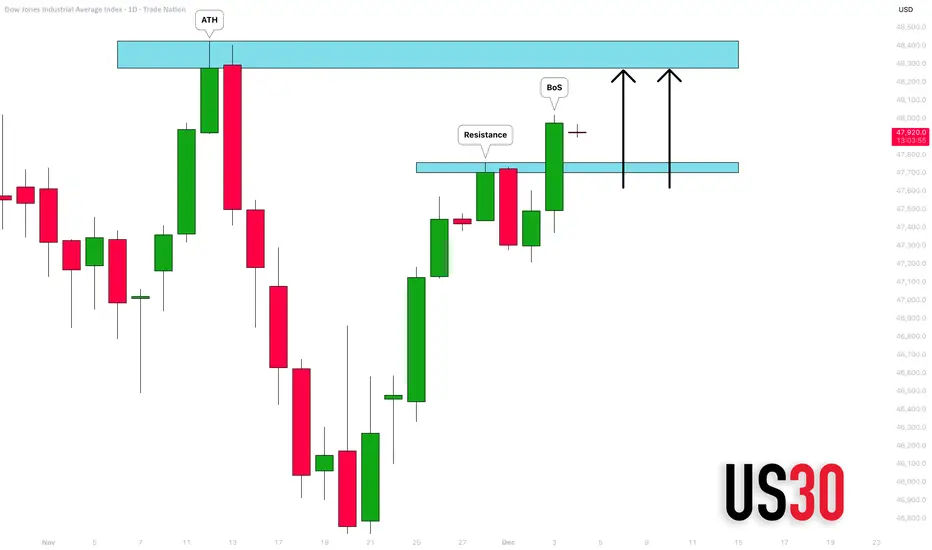
DOW JONES INDEX (US30): Confirmed BoS
With the yesterday's fundamental US news releases and
Trump's speech, US30 bounced strongly.
The market violated a significant daily resistance cluster
and closed above that.
It opens a potential for more growth to a resistance based
on a current All-Time High.
❤️Please, support my work with like, thank you!❤️
I am part of Trade Nation's Influencer program and receive a monthly fee for using their TradingView charts in my analysis.
AUDJPY ltf sells?First sells from area of supply. Manage your risk very well o.
Am still bearish even if price violates the setup

EURCAD: Important Breakout 🇪🇺🇨🇦
EURCAD broke and closed above a significant intraday/daily
resistance cluster.
With a high probability, the price will rise more and reach 1.6305 level soon.
❤️Please, support my work with like, thank you!❤️
I am part of Trade Nation's Influencer program and receive a monthly fee for using their TradingView charts in my analysis.

EUR/USD Ready for Its Next Move: Breakout or Channel Re-Test?
📊 Technical Context
EUR/USD is trading inside a clearly defined ascending channel, continuing an uptrend and respecting both support and resistance zones.
Price is currently testing a key resistance level, near the upper boundary of the channel. If EUR/USD fails to break above, we could see a retracement toward the mid or lower channel levels, which would align with typical channel behavior and offer potential rebuy zones.
In that scenario, consolidation or pullback would be natural given overextended recent moves.
🌍 Fundamental Context
The U.S. dollar is showing signs of weakness, driven by growing expectations of rate cuts by the Federal Reserve, which reduces the dollar’s yield advantage and weakens its appeal.
At the same time, the Euro-zone economy, while mixed, doesn't show extreme weakness; some positive sentiment around economic recovery supports EUR demand.
As a result, EUR/USD benefits from a combination of euro strength + dollar softness, creating a favorable backdrop for possible upside continuation.
🎯 What to Watch / Scenarios
Upside scenario: Break above resistance leads to continuation upward — trend remains bullish.
Pullback scenario: If resistance holds — watch for drop to mid/lower channel zones, then look for long entries aligned with structural support + fundamental bias.
Manage risk carefully due to potential volatility during breakout attempts or key macro news.
OANDA:EURUSD

Bitcoin – Technical + Fundamental Analysis
📊 Technical Situation
BTC remains inside its bullish ascending channel, with lower boundary still holding well.
Yesterday, price failed to break above the channel’s mid-line / resistance, suggesting consolidation is needed.
A drop toward the lower boundary of the channel could provide good liquidity and a support zone for a bounce.
If that support holds, price could attempt a new upward swing targeting ~94,000 USD, assuming resistance is overcome.
🌐 Fundamental Context
Risk sentiment remains shaky: as traditional markets show volatility, crypto tends to follow — higher Treasury yields and macro pressure have weighed on Bitcoin recently.
On the other hand, medium-term tailwinds remain: growing concerns over global money supply and potential monetary easing support Bitcoin as a hedge against inflation and currency debasement.
Institutional flows remain a mixed factor: while some investors are reducing exposure, others view dips as opportunities — this could generate volatility, but also strong rebounds if sentiment flips.
🎯 What I Expect
Ideally, BTC corrects toward the channel floor before resuming upward — this sets up a buy-the-dip opportunity.
If macro conditions worsen (rising yields, global risk-off), expect pressure toward lower channel support or even deeper.
If support holds and yields/market sentiment improve, Bitcoin could push toward 94,000 USD or higher.

Gold – Key Scenarios & Fundamentals🟡 Gold – Key Scenarios & Fundamentals
📉 Technical Setup
During the Asian session, gold broke down below the Previous Day Low (PDL) — a level that now acts as resistance.
For today, two clear scenarios are on the table:
🔹 Bullish Scenario:
Price reclaims the PDL (break + retest) → targets the Previous Day High (PDH) and the zone around 4,240 as the next upside target.
🔹 Bearish Scenario:
PDL holds as resistance → throwback → price heads down toward 4,100, a zone with strong liquidity and coinciding with the midline (or EMA) of the bullish channel, acting as a potential key support zone.
Watch for confirmation: retest + momentum for longs, or clean breakdown for shorts.
🌐 Fundamental & Macro Context
Dollar strength or weakness remains a critical driver; renewed USD weakness (from shifting rate expectations or softer US data) could favor gold upside.
Interest-rate expectations: If markets expect a less aggressive tone from the Fed (or potential rate cuts ahead), gold tends to absorb flows as a non-yielding safe-haven.
Geopolitical risk / global uncertainty still provide a tailwind to gold — any headlines affecting risk sentiment could spark safe-haven demand.
Inflation & real yields: If real yields stay low or turn negative, gold becomes more attractive; watch upcoming inflation data for clues.
🎯 Trading Plan Summary
Bullish path: reclaim PDL → entry upon retest → target ~4,240
Bearish path: rejection at PDL → entry on breakdown → target ~4,100
OANDA:XAUUSD
