Long Term Nifty Outlook on Weekly chart. The Weekly candles indicate that Nifty is on the verge of major breakout. Once Nifty gives a closing above 26277 it's previous high the next Fibonacci target for it will be 27666 within next 12 to 16 months. If GDP numbers for upcoming quarters are similar to the one we received for Q2 that is 8.2% we may reach there earlier too.
Once we get a closing above 27666 the next long term target 24 to 36 months from now can be 29540. Supports for Nifty are at 25301 and 24622 (Mother line support on Weekly chart (50 Weeks EMA) and finally 23903. A closing below 23903 will invite the bears again and can turn down all upside projections invalid.
As of now the future looks good. There has been a solid consolidation all we need now is a proper monthly closing above previous all time high that is 26277 and recent high which was 26310.
Disclaimer: The above information is provided for educational purpose, analysis and paper trading only. Please don't treat this as a buy or sell recommendation for the stock or index. The Techno-Funda analysis is based on data that is more than 3 months old. Supports and Resistances are determined by historic past peaks and Valley in the chart. Many other indicators and patterns like EMA, RSI, MACD, Volumes, Fibonacci, parallel channel etc. use historic data which is 3 months or older cyclical points. There is no guarantee they will work in future as markets are highly volatile and swings in prices are also due to macro and micro factors based on actions taken by the company as well as region and global events. Equity investment is subject to risks. I or my clients or family members might have positions in the stocks that we mention in our educational posts. We will not be responsible for any Profit or loss that may occur due to any financial decision taken based on any data provided in this message. Do consult your investment advisor before taking any financial decisions. Stop losses should be an important part of any investment in equity.
Candlestick Analysis

Top 4 Price Action Signals For Beginners. Forex, Gold Trading
I will reveal 4 accurate price action signals that even a newbie trader will manage to easily recognize.
Watch carefully because these signals alone will help you to make a lot of money trading Forex, Gold or any other financial market.
Change of Character
Change of character is a strong signal that indicates a trend violation and a highly probable market reversal.
In a bearish trend, the change of character will be a bullish violation of the level of the last lower high.
Check how the change of character accurately indicated a bullish reversal on EURJPY pair.
In a bullish trend, a bearish violation of the level of the last higher low will signify a change of character and a highly probable bearish reversal.
Bearish violation of the last higher low level and a change of character on USDJPY gave a perfect bearish signal.
Breakout of Consolidation
No matter what time frame you trader, you probably noticed that quite often the markets become weak and start consolidating .
Most of the time, the prices tend to consolidate within horizontal ranges.
Breakout of one of the boundaries of the range can give you a strong trading signal.
Check how the price acted on GBPCHF.
The breakout of the support/resistance of the range always gave an accurate signal, no matter what was the preceding direction of the market.
Trend Line Breakout of a Pattern
There are a lot of trend line based bullish and bearish price action patterns: the ranges, the wedges, the triangles, the channels.
What unites these patterns is that the violation of the trend line of the pattern gives a strong trading signal.
A bullish breakout of a resistance line of a falling wedge, a bullish flag and a symmetrical triangle will give us a strong bullish signal.
Just look how EURUSD bounced after a bullish breakout of a resistance line of a falling wedge pattern.
While a bearish breakout of a support line of a rising wedge, a bearish flag or a symmetrical triangle will indicate a highly probable bearish continuation
Here is how a bearish breakout of the support of a symmetrical triangle formation helped me to predict a bearish movement on Gold.
Neckline breakout of a horizontal pattern
There are a lot of different price action patterns.
One element that unites many of them is the so-called horizontal neckline.
In bearish price action patterns like double top, head and shoulders, descending triangle, triple top, etc. a horizontal neckline represents a support from where buyers are placing their orders.
Bearish violation of such a neckline will be considered to be an important sign of strength of the sellers and a strong bearish signal.
In bullish price action patterns like double bottom, inverted head and shoulders pattern, ascending triangle, cup & handle, etc. a horizontal neckline represents a resistance where sellers a placing their orders.
Its bullish violation will a strong bullish signal.
Below is a perfect example how a bullish breakout of a neckline of an inverted head and shoulders pattern on Bitcoin triggered a strong bullish rally.
Here is how a breakout of a neckline of a double top on USDCAD confirmed an initiation of a bearish correctional movement.
The most important thing about these price action signals is that it is very simple to recognize them. You should learn the basic price action rules and a couple of classic price action patterns, it will be more than enough for you to identify confirmed bullish and bearish reversals on any time frame and any trading instrument.
❤️Please, support my work with like, thank you!❤️
I am part of Trade Nation's Influencer program and receive a monthly fee for using their TradingView charts in my analysis.

Long trade Wed 26th Nov 25 — 3:25 PM
NY Session PM
Entry TF: 5-Min
🟩 1. Trade Parameters
Pair: AVAXUSDT
Direction: Buy-Side
Entry: 14.557
Stop Loss: 14.400
Take Profit: 15.577
Risk–Reward: 8.43R
🟨 2. Higher-Timeframe Context
HTF (1H / 4H) market structure:
Market has been in a multi-day downtrend, forming successive lower-lows and lower-highs.
A major demand zone between 13.12 – 13.30 was reclaimed on 23rd Nov.
Strong NY expansion candle broke above compression on 25th Nov, signalling a likely HTF shift.
Price pulled back into discount, forming a textbook re-accumulation structure.
30min TF overview
🟧 3. Liquidity
Liquidity Taken (Before Entry)
Sweep of Sunday–Monday lows around 13.12.
Deep purge into demand zone engineered equal-lows → liquidity grab.
Market created inducement wicks at 14.12, which were later swept.
Liquidity Above (Targets)
Buy-side liquidity pool at 15.57 (clear cluster of prior highs).
Multiple FVGs above price requiring rebalancing.
Void left from the sharp selloff on Nov 18th → price required re-pricing into inefficiency.
Liquidity narrative:
Sweep → Accumulation → Reclaim → Displacement to inefficiency.
5min Chart
🟥 4. SMC / ICT Technical Model Breakdown
✔ Model Type: BOS + FVG + Re-Accumulation Breakout
BOS at ~14.25 confirms shift back to bullish orderflow.
Clean FVG (14.22–14.28) formed after displacement.
Price returned to the FVG → mitigated OB → tapped equilibrium.
Strong continuation displacement candle printed → ideal entry timing.
Key Confluences:
Demand zone → BOS → FVG → OB alignment
EMA/WMA bullish crossover
Tight SL under engineered liquidity
🟦 5. Entry Logic
The entry at 14.557 acted as the:
Re-accumulation breakout confirmation
Retest of micro FVG
Retest of prior resistance turned support
SL placement below 14.400 protected under:
✓ Equal lows
✓ OB mitigation
✓ Structural swing low
🟫 7. Trade Outcome
Status: In session

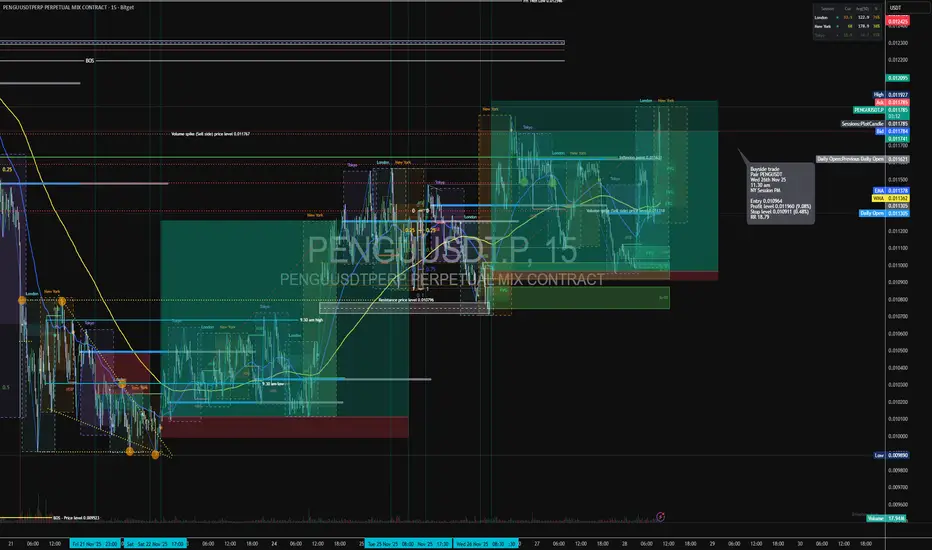
Long trade
🟦 Trade Details
Direction: Buyside Trade
Pair: PENGUSDT
Date: Wed 26th Nov 25
Time: 11:30 am
Session: NY Session PM
🟩 Execution Metrics
Entry: 0.010964
Take Profit: 0.011960 (+9.08%)
Stop Loss: 0.010911 (–0.48%)
Risk-to-Reward: 18.79
🟧 Market Structure Context
Price respects session highs/lows across London → NY transitions.
Prior sell-side sweep brought price into a discount where buyers stepped in.
Clear BOS to the upside confirms bullish orderflow.
NY PM continuation aligns with earlier accumulation from London.
🟥 Liquidity Narrative
Liquidity engineered beneath 0.01090 levels.
Strong reaction from:
Volume spike (sell-side)
Session liquidity pools
Open-to-close inefficiencies
Final draw on liquidity targets:
The inefficiency above 0.01190
Session equal highs in premium
🟪 PD Arrays / POIs
Price retraced into:
FVG (discount zone)
PMD retracement alignment
NY PM bullish re-pricing zone
POI validated with rejection from previous Daily Open zone.
🟨 Entry Model
Entry taken on 15-minute confirmation after:
Micro BOS
Retest into discount FVG
Strong PM session displacement
Clear continuation model (ICT-style buyside draw)
🟫 Sentiment
Strong market interest, rising volatility into NY PM.
Volume confirming active accumulation.
Micro-cap rotational sentiment supportive of fast expansion moves.
🟩 Outcome
A high-probability, high-RR continuation trade.
Clean narrative: Sell-side sweep → Discount entry → BOS → Expansion to buyside inefficiency.
Long trade 🟩 1. Trade Details
Pair: TONUSDT
Type: Buyside Trade (Trade 2)
Date: Tue 25th Nov 2025
Time: 2:00 PM
Session: London → NY AM
Entry Timeframe: 15-min
Chart Timeframe: 1H
Entry: 1.5948
Stop Loss: 1.5533 (-3.81%)
Take Profit: 1.7833 (+11.84%)
Risk-to-Reward: RR = 14.49R
🟦 2. Higher-Timeframe Context (Blue Tab — HTF Narrative)
HTF Trend:
• The 4H & 1H structure shows the larger downtrend has completed its corrective leg.
• Price forms a multi-tap accumulation range with repeated liquidity sweeps under 1.5520 – 1.5600.
• A clear BOS on the 1H shifts narrative from bearish → bullish.
Key HTF Confluences:
Breaker block reclaimed (originated from the last sell-side displacement).
Discount pricing beneath the 0.618 retracement of the previous leg.
Daily Open reclaimed → bullish orderflow.
FVG cluster left behind during displacement, acting as fuel for a pro-trend continuation.
Directional bias: HTF buy-side targeting 1.70 → 1.74 liquidity.
1Hr TF
🟧 3. Liquidity Story
Liquidity events leading to the entry:
1️⃣ Sell-side liquidity swept
• Deep wick into 1.5520 level (multi-session equal lows).
• New York session provided the liquidity injection needed for expansion.
2️⃣ Inducement / engineered liquidity
• Double-bottom fakes & equal-low structures were purposefully created during Asia/London.
3️⃣ Displacement
• Strong impulsive displacement from 1.5580 → 1.6200
• Break of Structure confirms bullish orderflow.
4️⃣ Pullback into discount
• Price retraced into:
0.618 retracement
15-min FVG
1H FVG stack
Order block 1.5630–1.5690
This created the optimal trade entry.
5️⃣ Final Liquidity Target
• Buyside resting above 1.7300 → 1.7500
• TP aligns with prior swing-high inefficiency and breaker block.
🟪 5. Market Sentiment & Narrative
Session Flow:
• Asia created the range → engineered liquidity
• London manipulated → swept sell-side
• NY AM gave the displacement → bullish confirmation
Market Psychology:
Retail assumed trend continuation downwards due to prior bearish leg.
Smart money accumulated aggressively in discount during multi-session compression.
🟫 6. Outcome
Trade Status: ACTIVE (Price mid-leg expansion)
Current Position: in +6.3% unrealised PnL at time
Market Structure: intact bullish MS
Invalidation: Break & close below 1.5600

Long trade 🟩 1. Trade Details
Pair: DOGEUSDT
Direction: Buyside Trade
Date: Thu 27th Nov 2025
Time: 7:29 PM
Session: London PM → NY Session PM
Entry TF: 5-min
Entry: 0.15039
Take Profit: 0.15979 (+6.25%)
Stop Loss: 0.14842 (−1.31%)
Risk-to-Reward: RR = 8.2R
🟧 3. Liquidity Story (ICT Liquidity Logic)
This trade typically follows a ICT liquidity cycle:
1️⃣ Sell-Side Sweep
Multiple sell-side lows at 0.1485 were taken out.
Stop-hunts engineered during London PM session.
2️⃣ Inducement Layer
Local double bottom + equal lows gave retail a false "floor".
Smart money used these as inducement for the long entry.
3️⃣ Displacement
Strong displacement candle breaks through 0.15120.
Fair Value Gaps (FVGs) form on 5m, 3m, 1m.
4️⃣ Rebalance & Entry
Price pulled back into a stacked FVG region + 5m OB.
Entry triggered exactly inside the discount zone of the bullish leg.
5️⃣ Buyside Liquidity Target
TP placed into the 0.15970 region — aligning with the next buyside pool.
🟥 4. Entry Logic
Entry Model: 📌 5-min BOS → 3-leg pullback → FVG → Bullish Order Block
ICT model confirmed:
Break of Structure (BOS) on 5m
Micro MSB on 1m
Retest into confluence zone:
FVG (5m)
Discount pricing
Bullish OB (institutional candle)
EMA + WMA crossover shift
Stop Placement:
Below: Recent liquidity sweep, OB invalidation point and 0.25 fib pullback zone
Take Profit Logic: Target aligns with the next premium inefficiency
Buyside liquidity resting at 0.16000–0.16150
🟪 5. Market Sentiment & Session Narrative
Session Flow: London PM created the liquidity base.
New York PM session delivered the displacement leg confirming buyers.
Low volatility midday compression → classic NY PM expansion setup.
Retail narrative:
We assumed the range was breaking down; price engineered a bearish trap, swept liquidity, and reversed.
Smart Money perspective:
Accumulation → displacement → rebalance → continuation model.
🟫 6. Outcome
Status: Active
Initial reaction: Bullish follow-through after FVG fill
Invalidation: Break below 0.14820

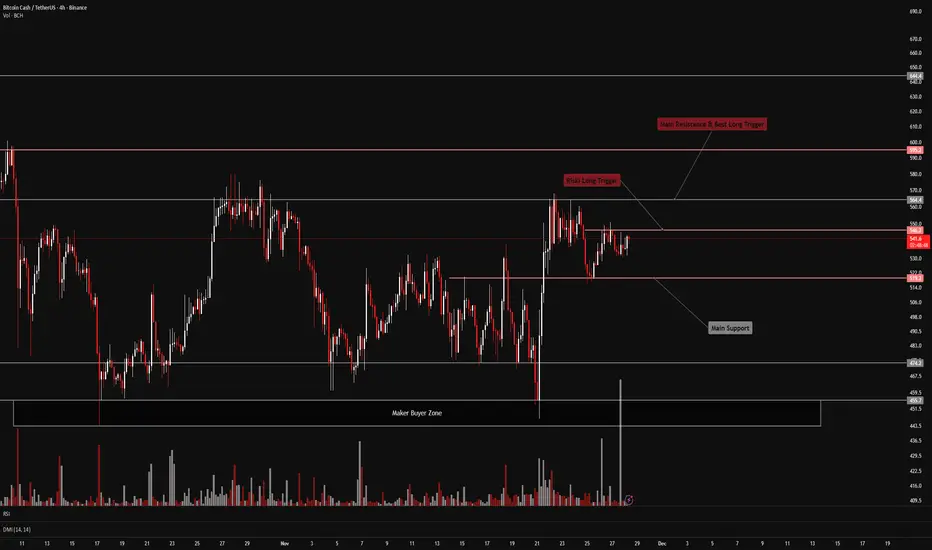
FireHoseReel | BCH: Ready to Shock the Market ?🔥 Welcome To FireHoseReel !
Let's dive into the BCH ( BitcoinCash ) 4H analysis .
👀 Bitcoin Cash (BCH) – Market Structure Overview
After reacting strongly from the major buyer zone, Bitcoin Cash pushed higher and attacked the $564 resistance directly.
Price then faced rejection at this level and entered a multi-timeframe corrective phase. During this correction, sell volume declined, and in the most recent 4-hour candles, buy volume has increased noticeably.
BCH has now formed an early long trigger around $546.
If this level breaks with multi-timeframe confirmation, we can look for early long positions, anticipating a future breakout above $564.
📊 Volume Is the Key Signal
Pay close attention to BCH volume — volume is more important than price here.
Right now, after price reached the $546 resistance zone, we’re seeing a strong surge in buy volume that hasn’t appeared for several days.
This behavior can be an early signal of a trend shift and the potential start of another bullish rally.
✔️ BCH/BTC Additional Market Perspective Looking at the BCH/BTC pair, price has moved upward very smoothly and is currently in a corrective phase.
The support and resistance levels that generate entry triggers are clearly defined — and these levels align perfectly with the BCH/USDT pair.
Early trigger: 0.005961
Safer trigger: 0.0062
These levels can be used for multi-pair confirmation.
📌 Trading Scenarios for Bitcoin Cash
You can review the following scenarios alongside your own strategy:
🟢 Long Scenario
A breakout above the $546 high, supported by rising buy volume, can offer a solid early long setup.
This setup is mainly for front-running the main breakout with lower initial risk.
If BCH later breaks and confirms above the stronger resistance at $564, we can safely add more size to existing long positions.
🔴 Short Scenario
Since the BCH/BTC pair is currently in a strong bullish structure, I do not expect a deep correction for Bitcoin Cash at this stage.
Therefore, short setups are not preferred in the current market context.
🛞 Risk Management & Disclaimer
Please remember to always use proper risk management and position sizing. Nothing in this analysis is financial advice. The market can change quickly, so always trade based on your own strategy, research, and risk tolerance. You are fully responsible for your own trades.
#ERAUSDT #1D (Bitget Futures) Descending channel on support LONGCaldera just printed a morning star on daily with good bounce back volume, bottom seems likely.
⚡️⚡️ #ERA/USDT ⚡️⚡️
Exchanges: Bitget Futures
Signal Type: Regular (Long)
Leverage: Isolated (1.3X)
Amount: 4.8%
Current Price:
0.2508
Entry Zone:
0.2503 - 0.2187
Take-Profit Targets:
1) 0.3245
2) 0.3921
3) 0.4598
Stop Targets:
1) 0.1593
Published By: @Zblaba
EURONEXT:ERA BITGET:ERAUSDT.P #1D #Caldera #RaaS #Rollups #DeFi caldera.xyz
Risk/Reward= 1:1.2 | 1:2.1 | 1:3.0
Expected Profit= +49.9% | +87.4% | +124.9%
Possible Loss= -41.7%
Estimated Gaintime= 1-2 months

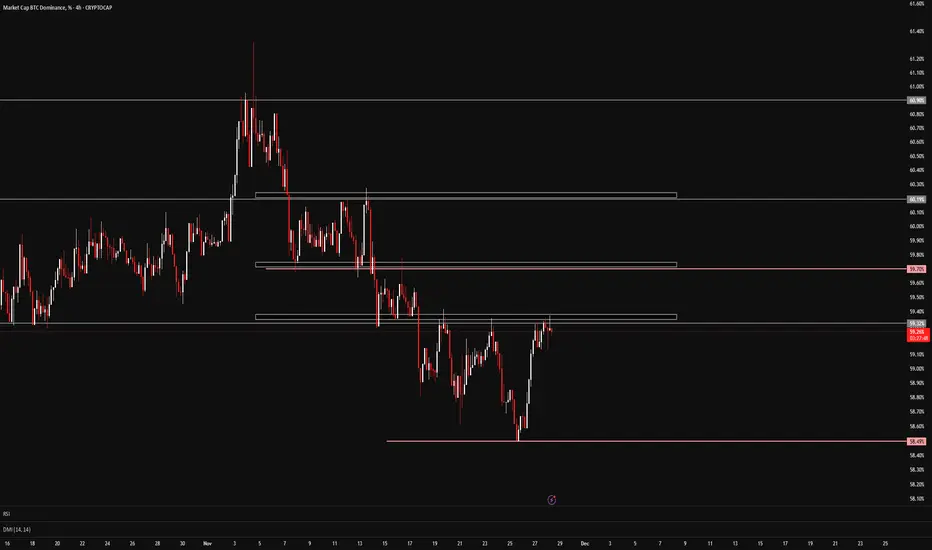
FireHoseReel | Bitcoin Dominance Technical Overview🔥 Welcone To FireHoseReel !
Let’s take a closer look at the current Bitcoin Dominance setup.
📊 Bitcoin Dominance – Market Structure (4H)
BTC.D is currently moving inside a 4H trading range.
A breakout above the range high could push Bitcoin dominance higher, and during that move, BTC-bullish pairs may also see sharp upside moves.
🔄 Dominance Correlation Across the Market
Bitcoin dominance has strong correlations with other dominance metrics.
When specific dominance alignments form, they can drive powerful moves in both Bitcoin and altcoins.
✅ Bullish Scenario: BTC.D Up + USDT.D Down
If Bitcoin dominance rises while USDT dominance falls, this creates an ideal environment for Bitcoin and BTC-bullish altcoins.
In this scenario, long positions can offer strong profit potential.
🧱 Key Resistance Levels Ahead
BTC dominance still has three major resistance levels ahead.
A confirmed breakout above these levels could push BTC.D out of its range and force the market into a new directional phase.
🛞 Risk Management & Disclaimer
Please remember to always use proper risk management and position sizing. Nothing in this analysis is financial advice. The market can change quickly, so always trade based on your own strategy, research, and risk tolerance. You are fully responsible for your own trades.
FireHoseReel | BNB Daily Analysis #9🔥 Welcome To FireHoseReel !
Let’s dive into the current BNB market structure and key levels.
👀 BNB – Market Structure & Trade Scenarios
After activating its trigger, BNB is currently trading just below a key resistance zone.
A clean breakout above this resistance could activate our long trigger, making this area a very strong zone for potential long positions after confirmation.
📊 Volume Behavior
Pay attention to volume — over the past few days, volume dropped noticeably, but we’re now seeing early signs of rising buy volume.
While this increase may not be fully visible on the 4H timeframe, on multi-timeframe analysis, the growth in buying pressure toward this resistance is clearly forming.
✔️ BNB/BTC – Relative Strength Check Looking at the BNB/BTC pair, price is currently sitting near a strong support level.
If this support is lost, it would signal a decline in BNB’s relative strength versus Bitcoin.
However, a solid reaction and bounce from this level could help trigger the resistance breakout on the BNB/USDT pair.
On the 4H timeframe, BNB/BTC still holds a slightly bullish structure, but on higher timeframes it appears bearish, meaning we must stay cautious.
📌 Trading Scenarios for BNB
Below are the key scenarios that can be used alongside your own trading strategy:
🟢 Long Scenario
A breakout above $898, confirmed with rising buy volume, can activate our long trigger and offer a valid buy entry.
The current area is a good preparation zone for a potential long after confirmation.
🔴 Short Scenario
For shorts, it’s best to focus on naturally bearish patterns, as supported by Dow Theory, such as:
• Failure Swing
• Non-Failure Swing
• Double Top
A break of newly formed lows with increased sell volume can present strong short opportunities.
🛞 Risk Management & Disclaimer
Please remember to always use proper risk management and position sizing. Nothing in this analysis is financial advice. The market can change quickly, so always trade based on your own strategy, research, and risk tolerance. You are fully responsible for your own trades.

Nifty Analysis EOD – November 28, 2025 – Friday🟢 Nifty Analysis EOD – November 28, 2025 – Friday 🔴
Consolidation Continues: Inside Bar Setup Forms
🗞 Nifty Summary
The Nifty opened with a 30-point Gap Up, followed by a sharp 80-point jump and an immediate recovery, which established the Initial Balance (IB) range. The index quickly found support at the highly contested 26200 ~ 26220 zone.
A key event was the fakeout above the IBH, trapping intraday buyers before slipping back to 26220. The 26220 level proved its importance, acting as both support and resistance throughout the session. Nifty spent the day hovering between 26250 (resistance) and 26200 (support), a tight 50-60 point range defined by high volatility.
The day closed flat at 26,202.95, with a minor 12-point loss (-0.05%). The entire day’s range (108 points) was inside the previous day’s range, forming a classic Inside Bar setup. This confirms another day of consolidation.
🛡 5 Min Intraday Chart with Levels
🛡 Intraday Walk
The overall day was range-bound with high volatility, but the crucial working range was tightly squeezed to only 30-50 points. The action was centered on the 26220 pivot, reflecting deep indecision after the successful breach of the ATH.
The fakeout above the IBH was a clear liquidity trap, ensuring that both long and short attempts within the range were punished.
This Inside Bar setup is a powerful technical signal: the market is currently “coiling,” suggesting that when the breakout occurs (either above today’s high or below today’s low), the resulting move will be aggressive.
📉 Daily Time Frame Chart with Intraday Levels
🕯 Daily Candle Breakdown
Open: 26,237.45
High: 26,280.75
Low: 26,172.40
Close: 26,202.95
Change: −12.60 (−0.05%)
🏗️ Structure Breakdown
Type: Bearish candle (close slightly below open) — Inside Bar.
Range (High–Low): ≈ 108 points — controlled, low range (relative to prior day).
Body: ≈ very small body indicating hesitation and perfect balance near the pivot.
Upper Wick: ≈ 43 points — buyers attempted to push higher but failed to sustain.
Lower Wick: ≈ 31 points — buying attempts from lower levels but limited recovery.
📚 Interpretation
The narrow candle body and minimal net change confirm the market is in a deep consolidation phase following the ATH test.
The Inside Bar formation is the key takeaway, signaling a high probability of a strong directional move once the high or low of today’s candle is decisively breached. There is no strong conviction from either side; the market is waiting for a trigger.
🕯 Candle Type
Neutral / Indecision Candle (Inside Bar) — Indicates maximum balance and a high-probability setup for an explosive directional trade.
🛡 5 Min Intraday Chart
⚔️ Gladiator Strategy Update
ATR: 196.83
IB Range: 83.75 → Medium
Market Structure: Balanced
Trade Highlights:
10:05 Long Trade - SL Hit
11:36 Short Trade - Trailing SL Hit
13:30 Long Trade - SL Hit
Trade Summary: The volatile, tight range produced a challenging environment, leading to multiple stop-loss hits as the market trapped traders on both sides. This is a typical result during an Inside Bar consolidation, where directional strategies struggle until the breakout occurs.
🧱 Support & Resistance Levels
Resistance Zones:
26220 (Immediate Resistance)
26277 (Old ATH, Now Immediate Resistance)
26310 (New ATH)
Support Zones:
26104 (Previous Strong Resistance, now first support)
26030
25985
25930 ~ 25920
🧠 Final Thoughts
“Patience is the only trade when the market is setting an Inside Bar.”
The setup for the next session is now crystal clear. The market is compressed, ready to move sharply. Intraday traders must focus solely on the breakout: A sustained move above 26280 will target 26400, while a decisive break below 26170 will target 26104 quickly. Avoid trading inside the range!
✏️ Disclaimer
This is just my personal viewpoint. Always consult your financial advisor before taking any action.

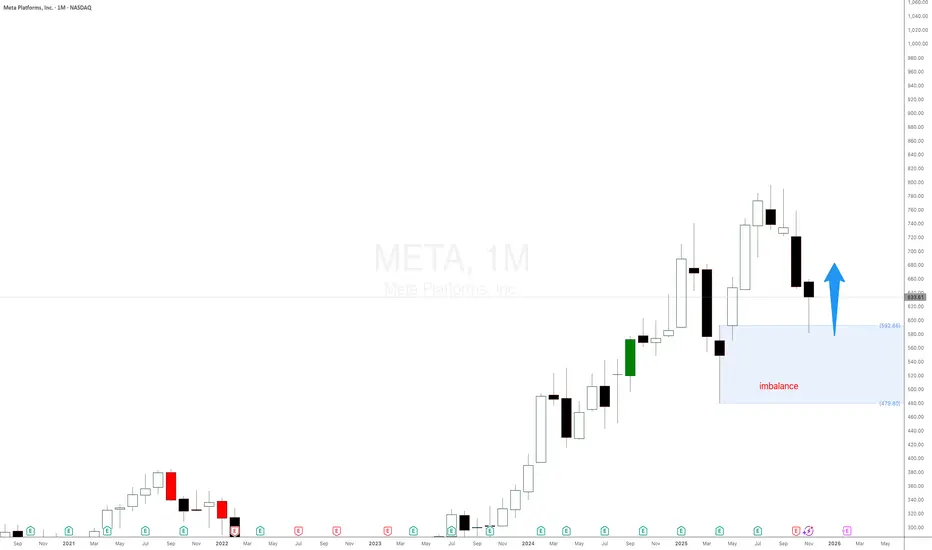
Meta Plafforms stock $META is exploding as expectedMETA Platforms NASDAQ:META is reacting nicely to the monthly demand imbalance at $592 as mentioned in the last update. Using pure supply and demand price action. META’s big drop was predictable from the monthly and weekly imbalances, and how the current reaction was part of the plan all along. Expecting a decent rally.
UK 100 Index – Psychological 10000 level Within Sight!As the dust settles on the UK Chancellor’s Autumn budget that was released on Wednesday it’s potentially a good time to assess the current backdrop for the UK 100 moving into early December.
First things first, Wednesday’s budget didn’t lead to an immediate rush to sell UK assets, which most notably was the case in the Liz Truss era and was a possible concern in the lead up to this release. Government bond markets took the series of tax rises and spending announcements in their stride, GBPUSD squeezed out some weak shorts to post a high of 1.3268 on Thursday, and the UK 100 followed it to print a 2 week high of 9715 before running into some profit taking on a move which had seen it rally from a low of 9425 posted on November 21st.
Looking forward, the focus for 100 UK traders may now shift to the interest rate decisions of the Federal Reserve (Fed) on December 10th and the Bank of England (BoE) on December 18th. The Fed rate decision could be important for two reasons, the first is that it may dictate the path of general risk sentiment into year end and secondly, with the UK 100 index dominated by multi-national companies generating around 70% of their revenue outside of the UK, any Fed move could directly impact their earnings outlook for early next year.
In terms of the BoE, while the Autumn budget wasn’t perhaps perceived by economists to be as dis-inflationary as it could have been, it may have done enough to shift the voting at the December meeting towards another 25bps (0.25%) cut. Certainly, the market thinks this to be the case with around 90% chance of a cut currently priced, although there could still room for a surprise ‘no change’ or disappointment on the speed of future rate cuts to start 2026.
While UK 100 price volatility may have reduced over this US Thanksgiving holiday period into the end of November, it could be very different story during the first 3 weeks of December.
Technical Outlook: How Much Further Can the Current Rally Go?
Since posting the 9425 November 21st low, the UK 100 index has rallied just over 3%, with immediate resistance levels giving way. This now includes closes above 9692, a level equal to the Bollinger mid‑average.
Traders may see this as the start of a further phase of price strength, but it remains essential to monitor both immediate support and resistance levels to gauge the next directional themes.
While a close above mid‑average resistance at 9692 could be interpreted as a signal of further upside potential ahead, there is no guarantee of this, and near‑term support levels may prove just as important in shaping price action over the coming days.
Potential Resistance Levels:
After the close above the Bollinger mid-average resistance at 9492 the focus could now be on 9742 as the next resistance. This level is equal to the 61.8% Fibonacci retracement
A successful close above 9742 is required to suggest further attempts at price strength, which could then shift focus towards potential tests of 9940, the November 12th all-time high.
Potential Support Levels:
After the latest price strength, initial support may now stand at 9605, the 38.2% retracement of the November rally. While a pattern of higher highs and higher lows is still intact, closing breaks below 9605 could lead toward further short-term weakness.
If the 9605 retracement gives way on a closing basis, risks could then shift toward deeper declines, opening scope for tests of 9537, which is the 61.8% retracement, possibly even 9425, the November 21st session low.
The material provided here has not been prepared accordance with legal requirements designed to promote the independence of investment research and as such is considered to be a marketing communication. Whilst it is not subject to any prohibition on dealing ahead of the dissemination of investment research, we will not seek to take any advantage before providing it to our clients.
Pepperstone doesn’t represent that the material provided here is accurate, current or complete, and therefore shouldn’t be relied upon as such. The information, whether from a third party or not, isn’t to be considered as a recommendation; or an offer to buy or sell; or the solicitation of an offer to buy or sell any security, financial product or instrument; or to participate in any particular trading strategy. It does not take into account readers’ financial situation or investment objectives. We advise any readers of this content to seek their own advice. Without the approval of Pepperstone, reproduction or redistribution of this information isn’t permitted.

GBPCAD: Pullback From Resistance ?! 🇬🇧🇨🇦
There is a high chance that GBPCAD will retrace from
a key daily resistance cluster.
I see a nice double top pattern on a 4h time frame on that
and a confirmed breakout of its neckline.
Expect a bearish movement to 1.851 level.
❤️Please, support my work with like, thank you!❤️
I am part of Trade Nation's Influencer program and receive a monthly fee for using their TradingView charts in my analysis.

GOLD (XAUUSD): Another BoS
A quick follow-up for the yesterday's post for Gold.
The price successfully bounced and broke another intraday resistance,
setting one more local higher high on a 4H.
The market will most likely continue rising following the plan
and reach 4205 soon.
❤️Please, support my work with like, thank you!❤️
I am part of Trade Nation's Influencer program and receive a monthly fee for using their TradingView charts in my analysis.

Gold Breakout, Record Highs in PlayGold has broken out of the bull pennant it’s been coiling within since late October, signalling a potential resumption of the prior bullish trend and a move back toward record highs. Bullish momentum is building, with RSI (14) pushing above 50 and MACD staging a bullish crossover, favoring long setups.
If the breakout holds, longs could be initiated above the downtrend with a stop beneath for protection, targeting 4245 initially—the high from November 13. Should the move extend beyond that level, the record highs may act like a magnet for price.
Good luck!
DS

IAG supply zonePrice arriving into supply zone.
will monitor from daily chart, h4/daily only
interested to see if 9.19 level will be reached ? or if any fake upside breaks?
and or how price behaves around highs.
short side catches my interest only if PA and structure builds right .
will wait for sellers to confirm their interest .
stick ya gambling pre mature entries up your insured asshoolee. ;)
naturally neutral stance will activate short position later on if price behaves.

BTC longIn the long zone, I am taking a BTC long. The long zone is the weekly support zone. The long position is valid for me as long as we don't fall and close a weekly candle below the weekly zone.
Entry: $83,175
TP: $91,200
SL: $79,760
RRR: 2.34"

EURUSD SHORT Market structure bearish on HTFs 3
Entry at both Weekly and Daily AOi
Weekly Rejection at AOi
Daily Rejection At AOi
Daily EMA retest
Previous Structure point Daily
Around Psychological Level 1.16000
H4 Candlestick rejection
TP: WHO KNOWS!
Entry 100%
REMEMBER : Trading is a Game Of Probability
: Manage Your Risk
: Be Patient
: Every Moment Is Unique
: Rinse, Wash, Repeat!
: Christ is King.

EURGBP SHORTsMarket structure bearish on HTFs DH
Entry at both Weekly and Daily AOi
Weekly Rejection at AOi
Daily Rejection at AOi
Previous Daily Structure Point
Around Psychological Level 0.88000
Touching EMA H4
H4 Candlestick rejection
Rejection from Previous structure
TP: WHO KNOWS!
Entry 100
REMEMBER : Trading is a Game Of Probability
: Manage Your Risk
: Be Patient
: Every Moment Is Unique
: Rinse, Wash, Repeat!
: Christ is King.

Nifty Analysis EOD – November 27, 2025 – Thursday🟢 Nifty Analysis EOD – November 27, 2025 – Thursday 🔴
Nifty Marks New All-Time High at 26,310.45, Followed by Intraday Consolidation.
🗞 Nifty Summary
Following yesterday’s powerful performance, the Nifty started another 60 points up, very close to the All-Time High (ATH). It filled the initial gap within the first five minutes, then successfully broke the previous ATH, marking a new record high and day high at 26,310.45.
However, the market was unable to sustain this top level. The 26220 zone provided multiple supports but was eventually breached around 1 PM, causing Nifty to fall to the next support zone of 26180 ~ 26132, where the day low was marked at 26,141.90.
A recovery pushed the index 80 points back up, but the 26220 level—formerly support—now acted as resistance. The day closed essentially flat at 26,215.55, adding a marginal +10.25 points (+0.04%).
The day was characterized by a single distribution, consolidating the massive gains from yesterday’s rally. After 14 months (since Sept 27, 2024), we are at a new ATH—a major psychological milestone.
🛡 5 Min Intraday Chart with Levels
🛡 Intraday Walk
The initial breakout above the ATH was quickly rejected, leading to an intraday price correction. The action confirmed that while there is buying interest at lower levels (the long lower wick), there is significant supply entering the market right at the new highs.
The wide, 168-point range and the inability to close strongly above the 26220 level indicate that the momentum has paused. This pattern suggests consolidation or profit-booking after a major breakout, which is often healthy before the next sustained move.
📉 Daily Time Frame Chart with Intraday Levels
🕯 Daily Candle Breakdown
Open: 26,261.25
High: 26,310.45
Low: 26,141.90
Close: 26,215.55
Change: +10.25 (+0.04%)
🏗️ Structure Breakdown
Type: Indecision / Neutral Bearish candle (close slightly below open).
Range (High–Low): ≈ 169 points — moderate intraday volatility.
Body: ≈ 46 points — relatively small body showing indecision and lack of directional conviction.
Upper Wick: ≈ 49 points — buyers attempted to break higher (to the ATH) but faced selling pressure.
Lower Wick: ≈ 74 points — strong defense by buyers, preventing a deeper downside.
📚 Interpretation
This candle reflects equilibrium after a significant push. The long lower wick highlights strong demand on dips, while the upper wick confirms selling pressure at the new ATH. The small body signals a pause, indicating neither bulls nor bears could take decisive control. The market is consolidating its position above the old ATH zone (26277).
🕯 Candle Type
Indecision / Neutral Bearish Candle with Lower-Wick Support — Shows balance between buyers and sellers; potential pause before next directional move.
🛡 5 Min Intraday Chart
⚔️ Gladiator Strategy Update
ATR: 210.90
IB Range: 195.5 → Big
Market Structure: ImBalanced
Trade Highlights:
10:49 Long Trade - SL Hit
13:11 Short Trade - Trailing SL Hit
Trade Summary: The choppiness around the ATH breach led to a challenging day for directional strategies. The lack of clean follow-through resulted in minor losses on the attempts to catch the trend, reflective of the market’s consolidation phase.
🧱 Support & Resistance Levels
Resistance Zones:
26220 (Immediate Resistance)
26277 (Old ATH, Now Immediate Resistance)
26310 (New ATH)
Support Zones:
26104 (Previous Strong Resistance, now first support)
26030
25985
25930 ~ 25920
🧠 Final Thoughts
“Consolidation is healthy, but the portfolio question remains.”
While the index achieved a new ATH, the indecisive close means the market is taking a breath. The immediate bias is neutral-to-positive, contingent on holding the 26180 ~ 26132 support zone.
A successful move above 26277 on Friday will confirm the resumption of the uptrend. Regarding the lack of portfolio participation: this often happens when the rally is concentrated in a few large-cap index heavyweights; it’s a cautious sign suggesting poor market breadth.
✏️ Disclaimer
This is just my personal viewpoint. Always consult your financial advisor before taking any action.

Nifty makes ATH, Profit Booking strikes thereafter. What next?Nifty made a new ATH today exactly after 14 Months although it is a point to rejoice. On the hindsight there is no growth for last 14 months. Such phases do come even in a Bull market but a closing above Today's ATH that is 26310 will be the real turnaround. Sometimes the indices will not reward you for months years and on some other occasions they will cover it up in few weeks or month. Afterall it is law of averages that catches up.
Nifty has been growing from last 20 years approximately around 15% per year. Last 14 months have been lackluster so if things go well Bulls can have a field day or weeks or months in the coming times. What we need is a weekly or monthly closing above 26310. As you can see in the chart the next resistance after 26310 will be around 26433. Major major Breakout above this zone.
Supports for Nifty are near 26141, 26015, 25834 and finally Mother line support is near 25608 on the daily chart.
Disclaimer: The above information is provided for educational purpose, analysis and paper trading only. Please don't treat this as a buy or sell recommendation for the stock or index. The Techno-Funda analysis is based on data that is more than 3 months old. Supports and Resistances are determined by historic past peaks and Valley in the chart. Many other indicators and patterns like EMA, RSI, MACD, Volumes, Fibonacci, parallel channel etc. use historic data which is 3 months or older cyclical points. There is no guarantee they will work in future as markets are highly volatile and swings in prices are also due to macro and micro factors based on actions taken by the company as well as region and global events. Equity investment is subject to risks. I or my clients or family members might have positions in the stocks that we mention in our educational posts. We will not be responsible for any Profit or loss that may occur due to any financial decision taken based on any data provided in this message. Do consult your investment advisor before taking any financial decisions. Stop losses should be an important part of any investment in equity.

FireHoseReel | AVAX: Building Energy Below Resistance🔥 Welcome To FireHoseReel !
Let’s dive into the analysis of AVAX (Avalanche).
👀 AVAX – 4H Market Structure Overview
On the 4-hour timeframe, after breaking its descending trendline, AVAX showed very strong bullish bias.
Even the pullback after the breakout was very shallow. Price then compressed like a spring and pushed away from the breakout zone with large whale-sized candles.
AVAX is now ranging just below a major resistance.
If this resistance breaks and price holds above it, we can say AVAX is likely to continue its bullish trend.
📊 Volume Analysis
Pay close attention to volume:
• The first volume spike came right after the bearish trendline breakout.
• The second volume increase appeared during the pullback completion at the $13.94 support.
• Now we are seeing the third wave of rising buy volume below resistance. This structure suggests that AVAX may be preparing for another multi-timeframe bullish rally, potentially transferring this momentum into higher timeframes.
✔️ AVAX/BTC – Additional Confirmation Looking at AVAX/BTC gives us a different perspective.
This pair is strongly bullish, confirming that AVAX deserves to stay on our watchlist for potential positions.
AVAX/BTC completed its correction while staying above a bullish curve structure and, just like AVAX/USDT, it is now sitting below resistance.
This resistance creates a trigger at 0.0001654, which is a key breakout level for confirmation.
📌 Trading Scenarios for AVAX, Below are the scenarios you can use alongside your own trading strategy. 👇🏻
🟢 Long Scenario
A breakout above the current AVAX resistance at $13.94, supported by rising buy volume, could start another bullish rally.
However, keep in mind:
• This is still the first direct test of resistance
• Any immediate entry here would be considered high risk
The safer approach is to:
• Wait for a pullback and consolidation
• Then enter after buy volume increases and the pullback structure completes
🔴 Short Scenario
A strong rejection from resistance, followed by:
• A lower high compared to the previous top
• A break of the new local low
• And the appearance of bearish patterns such as Failure Swing or Non-Failure Swing
can offer a valid short entry.
Even if we see equal highs, a confirmed break of the local low can still provide a short opportunity.
🛞 Risk Management & Disclaimer
Please remember to always use proper risk management and position sizing. Nothing in this analysis is financial advice. The market can change quickly, so always trade based on your own strategy, research, and risk tolerance. You are fully responsible for your own trades.
