CHF/JPY: Local Bearish Reversal?!We are observing a notable bearish reaction on a significant daily/intraday horizontal resistance level on CHFJPY.
Following a test of the highlighted blue area, the price started to consolidate, forming a horizontal range on a 4-hour timeframe.
The violation of this range's support level is an important signal of increased selling pressure.
Consequently, we anticipate a continued bearish trend, with a projected target of at least 189.66.
Candlestick Analysis

EUR/AUD: Local Bullish Reversal?!I spotted a notable bullish reaction to a significant daily/intraday horizontal support level on 📈EURAUD.
Following a test of the highlighted blue area, the price started to consolidate, forming a horizontal range on the 4-hour timeframe.
The resistance of this range is broken which we interpret as a significant indication of buyer strength.
We can now anticipate a bearish continuation, at least towards the 1.7800 level.

EUR/CAD: Bullish Outlook📈EURCAD formed a significant inverted head and shoulders pattern on a 4-hour timeframe.
The neckline for this pattern is identified between 1.6226 and 1.6210.
Should the price successfully break and close above this neckline, it would indicate a strong bullish signal.
In such a scenario, the market could potentially advance towards the 1.6560 level.
Please note that the neckline currently acts as a robust demand area. Shorting opportunities should only be considered after a confirmed breakout of this level.

Bear Zone_Solara IndustriesHi traders,
Currently Solara Industries gave breakdown in daily timeframe.Go short with 1st target 🎯 of 13k.

GBPJPY LONGMarket structure bullish on HTFs DW
Entry at Both Weekly and Daily AOi
Weekly Rejection at AOi
Weekly Previous Structure Point
Daily Rejection at AOi
Previous Daily Structuree Rejection
Around Psych Level 200.000
H4 Candlestick rejection
TP: WHO KNOWS!
Entry 95%
REMEMBER : Trading is a Game Of Probability
: Manage Your Risk
: Be Patient
: Every Moment Is Unique
: Rinse, Wash, Repeat!
: Christ is King..

BITCOIN (BTCUSD): Pullback From Key Support
Bitcoin is currently trading within a wide horizontal range on a daily.
We see a test of its support now.
There is a high chance that the price will bounce from that, following
a formation of a confirmed bullish imbalance candle.
Goal - 105170
❤️Please, support my work with like, thank you!❤️
I am part of Trade Nation's Influencer program and receive a monthly fee for using their TradingView charts in my analysis.

HSC+PL EUHalf session confirmation, market moved 38 pips, DXY showing signs of reversals, pin bar candle on 1HR

Nifty Analysis EOD – November 4, 2025 – Tuesday🟢 Nifty Analysis EOD – November 4, 2025 – Tuesday 🔴
A textbook triple-distribution day where bears dominated the expiry setup.
🗞 Nifty Summary
Nifty started flat to negative and instantly marked the day high at 25,787.40 in the very first minute. A sharp 82-point drop followed, taking the index to the crucial 25,706 zone. From there, Nifty got trapped within a narrow 35-point range (25,720–25,685) before slipping into another similar micro-range (25,685–25,650).
The entire day was a grind dominated by bears while bulls fought to defend supports — often leading to both-side fakeouts that punished intraday traders, particularly option buyers during weekly expiry volatility.
Around 2 PM, a breakdown from the second range breached both the PDL and the 25,635–25,615 support zone with strong momentum and volatility. The index eventually closed at 25,597.65, right at support and near the day’s low — confirming a triple-distribution day structure and a decisive bearish tone.
The engulfing move of yesterday’s bullish candle indicates that bears still have control, and short-term retracement toward 25,400 remains likely.
🛡 5 Min Intraday Chart with Levels
📉 Daily Time Frame Chart with Intraday Levels
🕯 Daily Candle Breakdown
Open: 25,744.75
High: 25,787.40
Low: 25,578.40
Close: 25,597.65
Change: −165.70 (−0.64%)
🏗️ Structure Breakdown
Type: Large bearish candle with a long body and small upper wick.
Range (High–Low): 209 points → high volatility session.
Body: ≈ 147 points → strong bearish control throughout.
Upper Wick: ≈ 42.65 points → rejection from 25,780 resistance.
Lower Wick: ≈ 19.25 points → weak late-session buying attempt.
📚 Interpretation
Nifty opened weak and failed to sustain above 25,780, triggering heavy selling below 25,650. This breakdown invalidated short-term bullish attempts, with bears pressing the index below major supports.
Despite minor pullbacks, the structure clearly confirms downtrend continuation with momentum building toward 25,400.
🕯Candle Type
A strong bearish continuation candle, confirming that yesterday’s spinning-top pattern was merely a pause before another leg lower.
🛡 5 Min Intraday Chart
⚔️ Gladiator Strategy Update
ATR: 202.64
IB Range: 102.30 → Medium
Market Structure: Balanced
Trade Highlights:
10:17 – Short Trade → SL Hit
11:25 – Long Trade → Trailing SL Hit
14:10 – Short Trade → Trailing SL Hit
📌 What’s Next? / Bias Direction
Trend : Bearish Continuation
If this momentum persists, short-term retracement toward 25,400 seems likely. Immediate supports lie at 25,550 and 25,460–25,440 zones.
📌 Support & Resistance Levels
Resistance Zones:
25,715
25,790
25,865 ~ 25,880
Support Zones:
25,585
25,550
25,510
25,460 ~ 25,440
💡 Final Thoughts
A clean triple-distribution expiry session often defines trend continuation phases rather than reversals. As long as Nifty remains below 25,700, sellers will dominate. A break below 25,550 could extend the fall to 25,400 — while any sustained move above 25,715 may only bring temporary relief.
“The market rewards patience when chaos tests conviction.”
✏️ Disclaimer
This is just my personal viewpoint. Always consult your financial advisor before taking any action.

4hr H&S pattern / anticipating right shoulder is going to be Daily trend - bears
4hr h&s pattern forming
Looking to get in on where i think right shoulder will be for 1:2rr

NZDCAD SHORT Market structure bearish on HTFs DW
Entry at both Weekly And Daily AOi
Weekly Rejection at AOi
Previous Weekly Rejection at AOi
Daily Rejection at AOi
Previous Daily Structure Point
Around Psychological Level 0.80500
Touching EMA H4
H4 Candlestick rejection
TP: WHO KNOWS!
Entry 100%
REMEMBER : Trading is a Game Of Probability
: Manage Your Risk
: Be Patient
: Every Moment Is Unique
: Rinse, Wash, Repeat!
: Christ is King.

NZDUSD SHORTsMarket structure bearish on HTFs 3
Entry at Both Weekly And Daily AOi
Weekly Rejection at AOi
Previous Weekly Structure Point
Daily Rejection at AOi
Previous Daily Structure Point
Around Psychological Level 0.57500
Touching EMA H4
H4 Candlestick rejection
Rejection from Previous structure
TP: WHO KNOWS!
Entry 120%
REMEMBER : Trading is a Game Of Probability
: Manage Your Risk
: Be Patient
: Every Moment Is Unique
: Rinse, Wash, Repeat!
: Christ is King.

AUDCAD SHORT Market structure bearish on HTFs 3
Entry at Daily AOI
Weekly Rejection at AOi
Daily Rejection at AOi
Previous Structure point Daily
Around Psychological Level 0.92000
H4 Candlestick rejection
Rejection from Previous structure
TP: WHO KNOWS!
Entry 95%
REMEMBER : Trading is a Game Of Probability
: Manage Your Risk
: Be Patient
: Every Moment Is Unique
: Rinse, Wash, Repeat!
: Christ is King..

BTC faces a crash, can it hold the $100000 mark?#BTCUSD BITSTAMP:BTCUSD BINANCE:BTCUSDT BITSTAMP:BTCUSD BINANCE:BTCUSDT
Affected by market news, BTC's hourly chart showed a large bearish candlestick, falling to a low of around 104000. Currently, regardless of the time frame, BTC has reached the lower Bollinger Band area, and all moving averages across different timeframes are trending downwards in tandem, with the MACD indicator showing a bearish crossover and increasing volume. There are no signs of a technical reversal yet, and in the short term, BTC still has room for further downward correction.
If 104000 is breached again, BTC may further decline to 102000-101000, or even the psychological level of 100000. It's only a matter of time, and the bulls will temporarily back down.
Therefore, if BTC rebounds to 105500-106500 in the short term, shorting BTC can be considered.

Gold – Dancing Around $4000, Where Next?Gold prices may have stabilised after their sharp correction from an all-time high at 4381 on October 20th to a low of 3887 on October 28th, however traders still bear the scars from that excessive and volatile move which has left the popular metal dancing in a 3% range either side of 4000.
Judging where Gold prices may move next has become more challenging with Federal Reserve policymakers trying to cool market expectations of a further interest rate cut at their next meeting in December. As a general rule, lower interest rates can help support Gold prices as it is a non-yielding asset.
Not only that, but this changing outlook from the Fed has also seen the US dollar move up to its highest level for 3 months, which has further weighed on Gold prices, as it makes the safe haven asset, which is priced in dollars, more expensive to global investors.
However, many of the drivers that attracted traders to add Gold to their portfolios remain, such as geo-political risks in Ukraine, credit risk and uncertainty regarding the direction of global economic growth.
In this type of environment paying attention to the technical outlook can be just as important as staying appraised of macro headline risk.
Technical Update: Does 3915 Mark the Extent of Corrective Moves?
Gold has corrected over 11.25% from its October 20th all-time high into last Tuesday’s October 28th session low, unwinding the possible over-extended upside conditions that built during the sharp August 20th to October 20th price advance.
The key dilemma for traders now is whether the recent weakness marks a healthy market correction or suggests a deeper shift in sentiment. If it’s the former, we could see renewed buying interest and a resumption of the broader uptrend. However, if it’s the latter, risks may lead to a further phase of price weakness.
While the next directional theme for Gold remains uncertain, technical analysis can offer potential clues. By identifying key support and resistance levels, traders can anticipate where directional risks may emerge, especially if those levels break on a closing basis. A breach of support may signal deeper corrective risk, while a close above resistance could resume positive momentum.
Potential Resistance Levels:
Gold’s 11.25% decline from the October 20th high appears to have found support at 3,915, the 61.8% Fibonacci retracement of the September 18th to October 20th advance. Price action has since stabilised around this level, suggesting potential for attempts to renew upside.
Traders may now shift focus to key resistance levels, with closing breaks above those levels needed to indicate further price strength.
With upside developing following tests of the 3915-retracement support, traders could now be monitoring the 4076 level, which is the 38.2% Fibonacci retracement of the October price weakness. Successful closing breaks above 4076 could result in tests of 4134, the 50% level, even 4192, the higher 61.8% retracement.
Potential Support Levels:
As suggested above, with the latest phase of price weakness being held by the 3915 retracement levels, traders will likely be monitoring this as the first possible support. Closing breaks under this level could be a catalyst for continued price declines.
Such moves while not a guarantee of a phase of further price weakness, could open tests of 3819, the October 2nd session low, even 3717, which is the September 24th downside extreme.
The material provided here has not been prepared accordance with legal requirements designed to promote the independence of investment research and as such is considered to be a marketing communication. Whilst it is not subject to any prohibition on dealing ahead of the dissemination of investment research, we will not seek to take any advantage before providing it to our clients.
Pepperstone doesn’t represent that the material provided here is accurate, current or complete, and therefore shouldn’t be relied upon as such. The information, whether from a third party or not, isn’t to be considered as a recommendation; or an offer to buy or sell; or the solicitation of an offer to buy or sell any security, financial product or instrument; or to participate in any particular trading strategy. It does not take into account readers’ financial situation or investment objectives. We advise any readers of this content to seek their own advice. Without the approval of Pepperstone, reproduction or redistribution of this information isn’t permitted.

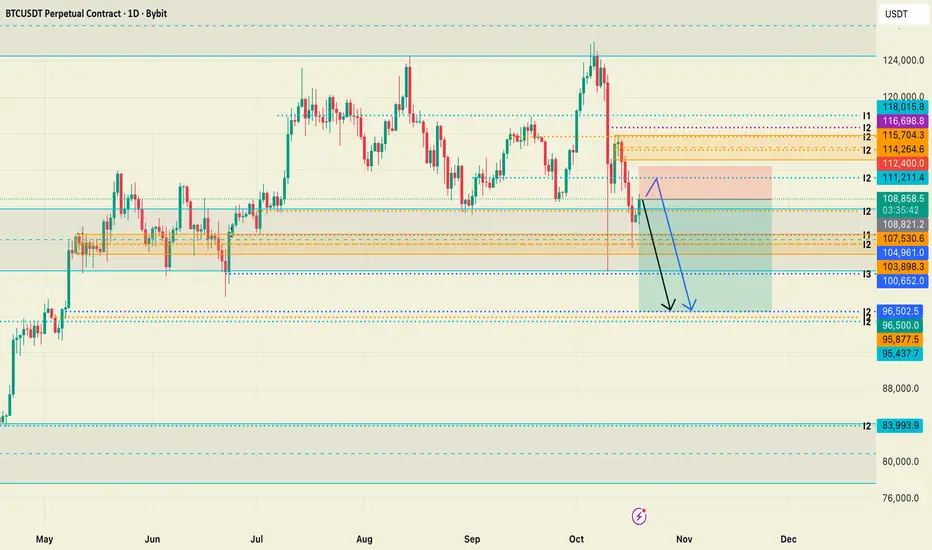
I expect a BTC drawdown on the daily timeframe.In the coming days, I expect a BTC drawdown on the daily timeframe to values of $96,500 to $95,400 from a price action perspective. I would enter a short position immediately, setting my Stop Loss (SL) above $112,400 and Take Profit (TP) at $96,500, which would represent a 3.44 Risk-Reward Ratio (RRR).
It is important to note that this is in no way financial advice, but merely my personal view on price action and my idea of where the price might go in the coming days.
PHARMA Stock @ ATH_LAURSLAbHi traders,
Currently Pharma stock closed higher with Bullish breakout with Bullflag Pattern.
Go long until it breaks previous Monthly Candle Low or Market structure.
Better time entries @ daily timeframe with Technical support and find opportunities in F&O.

AUDUSD sell setupOne of the most beautiful sell setup this week. AUDUSD swept a noticeable liquidity high at Supply level, then after CPI news yesterday confirming dollar strength, This led to clear Market structure shift (mss) on XXX/USD pairs.
Retest of the move today confirmed downward pressure on the pair. OB mitigation + imb
As far as there's a prescence of market gap below, my bearish bias is not yet invalidated.
Learn!

USDJPY LONG Market structure bullish on HTFs 3
Entry at both Weekly and Daily AOi
Weekly Rejection At AOi
Daily Rejection at AOi
Previous Daily Structure Point
Around Psychological Level 153.000
Touching EMA H4
H4 Candlestick rejection
Rejection from Previous structure
TP: WHO KNOWS!
Entry 110%
REMEMBER : Trading is a Game Of Probability
: Manage Your Risk
: Be Patient
: Every Moment Is Unique
: Rinse, Wash, Repeat!
: Christ is King.

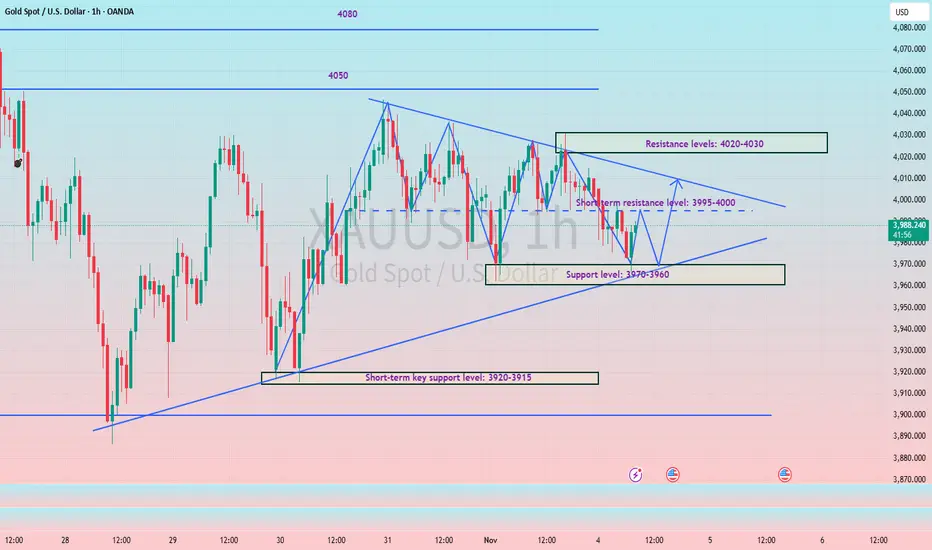
How to keep up with the rhythm of triangle pattern consolidation#XAUUSD OANDA:XAUUSD TVC:GOLD
Gold prices stalled at higher levels yesterday, mainly due to Federal Reserve officials' cautious stance on a December rate cut, which boosted the dollar and dampened enthusiasm for gold's rise. Judging from the current trend, the market is in a converging triangle pattern. The daily MA5 is around 3987, and the MA10 is around 4021. It can be seen that the range between these two points is very small, indicating that the market is also preparing to break out and choose a major direction. Once the gold price breaks out of the triangle pattern and chooses a direction, the daily chart's trendline will widen. Therefore, the key resistance level to watch is 4020-4030, while the key support level is 3970-3960. The European session is expected to trade within a range in the short term. Before a successful breakout, pay attention to the resistance level of the middle band on the hourly and 4-hour charts at 3995-4000. If the price touches the resistance level on the first attempt and fails to break through, a small short position can be considered.
Warning signs build for bullsContinued topside failures combined with an evening star pattern on the daily should have silver traders on alert for potential downside in the days ahead.
You can’t help but notice how feeble the bounce has been relative to the rout seen in October, with price consistently struggling above $49, which just happens to be the 38.2% fib retracement of the October high-low range. Five separate failures above the level were telling, perhaps explaining why we saw an eventual pullback on Monday, delivering an obvious evening star pattern on the daily that warns of downside risk. With momentum indicators turning neutral, the price signal suggests short setups may be the way to play near term.
$48.00 has seen plenty of action either side recently, making it a candidate to build a bearish setup around. Shorts could be set beneath with a stop above for protection, targeting either $46, which offered support previously, or the October 28 swing low of $45.56. In between, the 23.6% fib of the October high-low is found at $47.67. Given the price has respected other retracements, it’s a level of note. Minor support is also located 40 cents lower at $47.27. Unless you’re only interested in ultra-short-term setups, price action at these levels should be monitored rather than treated as targets for the trade.
Good luck!
DS

USD Index, AUD/USD Hint at Near Term ReversalsAs outlined in last week’s video, I suspect the US dollar may have the potential to break higher as part of its wave C before momentum realigns with its dominant bearish trend. However, Monday’s shooting star candle just below 100, coupled with an overbought RSI (2), warns of a potential pullback ahead of any breakout.
Also note that AUD/USD has formed a spinning top doji near the September low, suggesting that bearish momentum is waning despite closing lower for a fourth consecutive day.
With the RBA likely to deliver a hawkish tone when they hold rates today, there’s potential for a short-term bounce in the Australian dollar. However, if I’m right in expecting an eventual bullish breakout in the US dollar index, I’ll also be watching for evidence of a swing high on AUD/USD once that anticipated bounce is delivered.
Matt Simpson, Market Analyst at City Index

Nifty Analysis EOD – November 3, 2025 – Monday🟢 Nifty Analysis EOD – November 3, 2025 – Monday 🔴
A Day of False Breakouts — Signs of Base Building or Just Another Trap?
🗞 Nifty Summary
Nifty opened 38 points lower, quickly filled the gap in the initial move but couldn’t hold above the 25715 support zone, slipping further to mark the day’s low at 25645.50. From there, a sharp recovery of over 100 points lifted the index above the previous day’s close (PDC) to a new day high of 25761.5, forming the Initial Balance (IB) High.
After a brief retracement, a strong rally attempted to break the IB High, but the very next candle proved it a false breakout, pulling Nifty back under control of the bears. Price hovered near the IB zone, with multiple breakout attempts followed by quick rejections. A double bottom pattern emerged around the earlier swing low, which helped bulls stage another rally toward the IB High — and once again, a false breakout ensued.
Finally, around 2:10 PM, Nifty decisively broke above the IB High, rallying to the next resistance zone of 25790, where it again faced rejection but managed to close near the day’s high at 25774.3, above both CDO and PDC levels.
While the day looked random at first glance, the price behavior reflected a pattern typical of base-building phases — a mix of failed breakouts, mid-range compressions, and reactive rallies. If this indeed is a base formation, the 25700 zone must hold in coming sessions.
As highlighted in yesterday’s note, 25790 was the key level, and today’s close near it makes tomorrow’s close above 25790 crucial for bulls’ continuation. The 25700 level remains the guiding line for short-term structure.
🛡 5 Min Intraday Chart with Levels
🛡 Intraday Walk
Opened 38 points negative and tested 25715 zone.
Failed to sustain, slipped to 25645.5 marking day’s low.
Sharp 100+ point recovery to 25761.5 forming IB High.
Multiple fake breakouts above IB High followed by rejections.
Double bottom near 25650–25670 region provided strong bounce.
Final rally tested 25790 resistance; closed at 25774.3 near the high.
📉 Daily Time Frame Chart with Intraday Levels
🕯 Daily Candle Breakdown
Open: 25,696.85
High: 25,803.10
Low: 25,645.50
Close: 25,763.35
Change: +41.25 (+0.16%)
🏗️ Structure Breakdown
Type: Small-bodied bullish candle with wicks on both ends — indecision with mild bullish bias.
Range (High–Low): 157.60 points → moderate volatility.
Body: ≈ 66.50 points → limited directional strength.
Upper Wick: ≈ 39.75 points → rejection near 25,800.
Lower Wick: ≈ 51.35 points → buying support near 25,650.
📚 Interpretation
After two strong bearish days, Nifty managed to hold key supports and stage a mild comeback. Bulls defended the 25,650–25,700 zone well, though momentum above 25,800 remains lacking. The close above open signals buyer re-entry, albeit cautiously — a potential pause before reversal or consolidation.
🕯Candle Type
A Spinning Top, appearing after consecutive bearish sessions — a classic indecision candle often preceding a short-term base or pullback.
🛡 5 Min Intraday Chart
⚔️ Gladiator Strategy Update
ATR: 201.94
IB Range: 116. → Medium
Market Structure: balanced
Trade Highlights:
9:36 – Long Trade → Target Achieved (R:R 1:1.69)
10:43 – Long Trade → SL Hit
11:26 – Short Trade → Trailing SL Hit
📌 What’s Next? / Bias Direction
The short-term trend remains in flux — bulls are attempting to defend their ground, while bears continue rejecting higher zones.
A close above 25790 could confirm short-term strength and push Nifty toward 25880–25940.
If the 25700 level fails, the market may retest 25580–25550 as the next strong demand area.
📌 Support & Resistance Levels
Resistance Zones:
25790
25865 ~ 25880
25920 ~ 25944
Support Zones:
25635 ~ 25615
25585
25550
25510
25460 ~ 25440
💡 Final Thoughts
“Base-building phases test patience — not skill. The disciplined trader sees patterns where others see noise.”
✏️ Disclaimer
This is just my personal viewpoint. Always consult your financial advisor before taking any action.

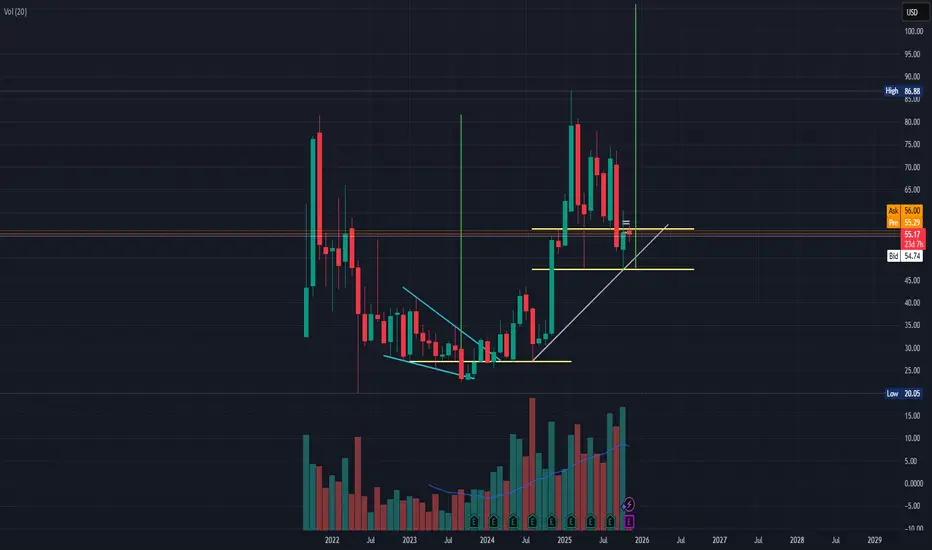
Cup & Handle - BROS (Monthly Chart)As you can see in the monthly chart of BROS, a cup and handle pattern is forming.
The price target of a cup and a handle is the depth of the cup but starting from the the handle's ending candle.
In this graph, you can see that I'm using a little conservative price target: the price target is not from the end of the handle, rather from the support around 47.
That is because the cup depth from the handle would give us 100%+, and though I like such results, I'm a little conservative when it comes to trades of above 50% gain, regardless of trade length (and it's more of personal risk management and it works for me but maybe someone else can see this as a clear sign of consistent buying until PT).
Fundamentally, the earning of 5-Nov-2025 after market, shall play a huge role in succeeding the completion of the cup and handle price target.
My short term price target is 62, and the reason for that is the 20-Aug-2025 and 15-Sep-2025 role reverse from support to resistance (Daily Chart), and considering BROS volatility, it's conservative, yet, risky in nature.
My medium term target is 77.5 which is the highest from the body candle from the left of the cup and handle and not the second one of 79.16, and again, the reason for this is because I want to take a more conservative approach as BROS volatility may hurt high risk-intolerant traders.
The long term target is 105 due to the cup and handle depth.
Generally, I'm a high risk trader. However, with current market conditions and the current phase of uncertainty in U.S. equities due to government shutdown and volatile policies (especially tariffs), one might want to seek more conservativeness in their trading.
That being said, BROS is fundamentally one of the best growth stories I've analyzed. Revenues, earnings, cash management and funding, operational execution, etc., combined they check out the marks of a good investment. Yet, also fundamentally, it has a lot of optimism priced in, and as of this writing, we are confronting investors fears from the current uncertainty, high valuations, and profit taking period. we might see some selling pressure after a strong hike (assuming positive/expectations beat in earnings) due to profit taking and uncertainty. It has a very high valuation comparing to its peers, yet, it also has great growth comparing to its peers...
Not a financial advise, just a guy behind a screen.
Please do not hesitate to share your opinions, as long as it's logical.