What Is the Evening Star Candlestick Pattern?What Is the Evening Star Candlestick Pattern?
Candlestick patterns offer traders a way to read price action and spot potential changes in momentum. One notable pattern is the evening star, a three-candle formation that signals the start of a possible downtrend. This article breaks down what the evening star looks like, how it works, and how traders typically use it.
What Is the Evening Star Candlestick Pattern?
The evening star is a three-candle pattern that traders watch for after a strong upward move. It’s considered a bearish reversal pattern, signalling that bullish momentum is fading. The setup consists of three candles:
- The first candle is a large bullish candle—it shows a clear upward direction.
- The second is much smaller. This middle candle—the star—reflects hesitation. Buyers and sellers are more balanced, and the market’s pace slows.
- The third candle acts as confirmation. It’s a solid bearish candle that closes deep into the body of the first.
The middle candle also often gaps up from the first, especially in stocks or indices, but gaps aren’t essential. What matters is the sequence: strength, indecision, reversal. The further the final candle closes into the body of the first, the stronger the pattern is considered.
Evening stars can appear on any timeframe, but many traders look for them on the daily chart where the signals tend to be clearer. It’s not a pattern to act on blindly—but in the right context, such as after a sustained bullish trend, it’s a useful sign that buyers might be losing control.
The Psychology Behind the Evening Star
It may be always useful to frame the formations like the evening star candle pattern in the context of market psychology.
Here, the first bullish candle signals buyer confidence. They drive prices higher and the candle closes strongly. The next candle is smaller, suggesting that momentum is slowing. Buyers aren’t pushing as hard, and sellers start to step in.
When the third candle closes strongly bearish, it confirms that sentiment is changing. Sellers are now in control, and previous buying strength fades. This shift often happens at the end of an extended upward movement, where fewer buyers are willing to bid the price up and begin closing positions.
How Traders May Use the Evening Star Candlestick Formation
The evening star may be a useful part of a trader’s toolkit, especially when it lines up with other pieces of analysis.
Opening and Closing a Trade
The evening star pattern candlesticks become more meaningful when they appear around known areas of resistance or previous swing highs. If the market’s been edging closer to a clear level—like a horizontal resistance line, Fibonacci retracement, or trendline—and then an evening star forms, it can add weight to the idea that the rally is weakening. Some traders also watch for patterns forming near round numbers or psychological price points.
If traders notice an evening star pattern occurring at a resistance level, they typically look for confluence using another indicator. The RSI might signal a bearish divergence, the price may be piercing an upper Bollinger Band, or it could also be bouncing from a 200-period EMA. Volume can be another factor—rising volume on the third candle can signal more participation behind the selling.
Once a trader has confidence that a bearish reversal is likely underway, they often use the candles following the third candlestick as an entry trigger. A stop loss might be set above the middle candle’s high, while take-profit targets might be placed at an area where a bullish reversal might occur, like a support level. Some might simply trail a stop to take advantage of the strong downtrend or exit when an indicator/candlestick pattern signals that bearish momentum is fading.
Marking Potential Trend Shifts
Some traders use the evening star to flag potential trend exhaustion. While they may not act on the signal (e.g. they are bullish overall and not willing to take shorts yet), the presence of an evening star can suggest the uptrend is vulnerable. They may prepare to buy a pullback, partially close an existing long position, or start watching for further bearish signals.
Example Trades
In the example above, we see a slight rally in AUD/USD in a broader downtrend (off-screen). Price initially pierces the upper Bollinger Band, with slight rejections visible in the upper wicks. After a brief dip, the market retests highs and finds resistance. At this point, the pattern forms, with confirmation coming from relatively weak candles afterwards. Price then closes through the midline of the Bollinger Bands, providing full confirmation of a bearish reversal.
In this second example, we can see a failed evening star. Here, Amazon (AMZN) gaps up over two consecutive days. That leads the 50-period EMA to slope up and cross above its 200-period counterpart—a clear bullish signal.
In this context, it may be better to ignore the signal. The market continues to move higher in an uptrend with consecutive bullish gaps, confirmed by the EMA crossover, indicating a lower probability the pattern will work successfully. Like any pattern, the evening star is expected to be more reliable when contextual factors align, such as in the AUD/USD example.
Strengths and Limitations of the Evening Star
The evening star has its strengths and limitations. To rely on the evening star in trading, it’s worth being aware of both sides.
Strengths
- Clear visual structure: The three-candle formation is straightforward, especially on higher timeframes.
- Logical: The pattern reflects an evident change in momentum that shifts from buying to selling pressure.
- Useful in a wider toolkit: When combined with other forms of analysis (resistance levels, overbought signals, strong volume), it can help traders pinpoint potential turning points and offer an entry.
Limitations
- Requires confirmation: On its own, the pattern doesn’t confirm a downtrend. It’s a potential signal, but not a guarantee.
- Less reliable in choppy markets: In sideways or low-volume markets, evening stars usually produce false signals.
- Subject to interpretation: Candle size, wicks, and placement can vary, which means not every setup is clean or tradable.
The Bottom Line
The evening star pattern offers traders a structured way to identify potential turning points in the market. Its three-candle formation makes it popular among those seeking greater confirmation than single-candle patterns.
FAQ
What Does an Evening Star Candle Pattern Mean?
It’s a three-candle formation that appears at the end of a solid uptrend. An evening star in trading indicates a potential bearish reversal or a short-term downward movement depending on market conditions and the timeframe used.
Is the Evening Star Bullish or Bearish?
The evening star is considered a bearish pattern that shows buyer exhaustion. A third long bearish candle reflects a change in the market sentiment.
How Do an Evening Star and a Hanging Man Differ?
The evening star is a three-candle pattern showing a gradual change in momentum. The hanging man is a single-candle pattern, with a small body and long lower wick. Both are bearish reversal signals, but the hanging man typically requires greater confirmation.
How Do a Shooting Star and an Evening Star Differ?
The shooting star is a one-candle pattern with a long upper wick and a small body that signals rejection at higher prices. The evening star is a three-candle pattern. Both formations reflect a shift from bullish to bearish sentiment.
This article represents the opinion of the Companies operating under the FXOpen brand only. It is not to be construed as an offer, solicitation, or recommendation with respect to products and services provided by the Companies operating under the FXOpen brand, nor is it to be considered financial advice.
Candlestickformations
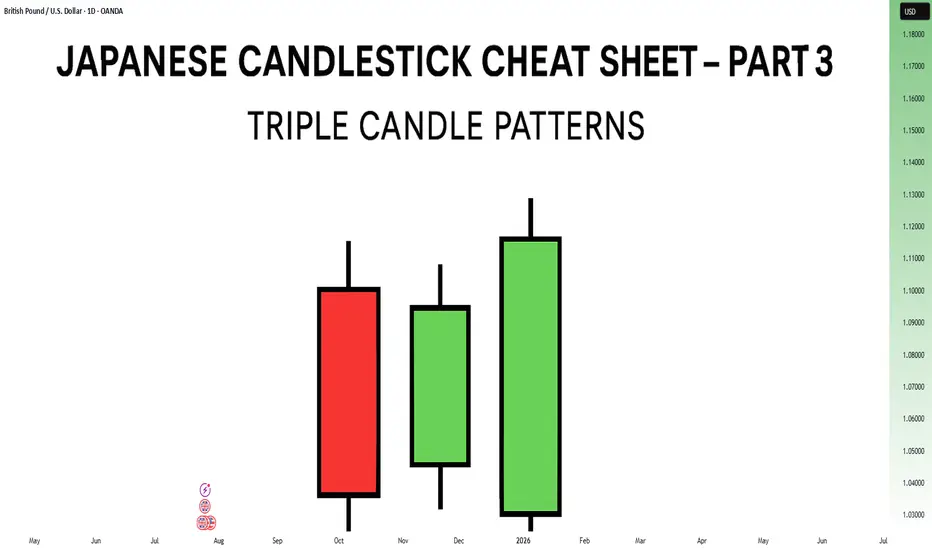
Japanese Candlestick Cheat Sheet – Part Three- 3 candle patternsSo far in this series, we've broken down single candle formations ( Part 1 ) and explored double candle signals ( Part 2 ) — the kind of patterns that give you quick, often powerful hints about the market’s mood.
But now it’s time to go a step further.
👉 In Part 3, we dive into triple candlestick formations — patterns that take more time to form, but often offer stronger confirmation and a more reliable narrative.
They’re like reading three full sentences from the market instead of just one or two words.
If you’re ready to spot momentum shifts (not noise), this lesson is for you.
Let’s decode the story behind formations like Morning Star, Three White Soldiers, and so on.
MORNING STAR
Bias: Bullish
What is the Morning Star pattern?
The Morning Star pattern consists of a bearish candle, a small-bodied middle candle, and a bullish candle, forming at the end of a downtrend to signal potential reversal. This pattern reflects a shift from seller dominance to buyer strength, as the middle candle marks a pause before a reversal. The Morning Star is a reliable signal that buyer interest is reemerging.
Understanding Morning Stars helps traders anticipate shifts in momentum, providing valuable entry points for new uptrends.
Meaning:
Found in downtrends; signals potential bullish reversal as buyers gain control, with strength confirmed by the third candle closing above the first.
BULLISH ABANDONED BABY
Bias: Bullish
What is the Bullish Abandoned Baby pattern?
The Bullish Abandoned Baby is a rare but powerful reversal pattern that consists of a bearish candle, a gapped doji, and a bullish candle. The middle doji reflects indecision, while the third bullish candle confirms the reversal. This pattern highlights a dramatic shift in sentiment, showing that buyers are prepared to take control.
Recognizing the Bullish Abandoned Baby can offer traders insights into pivotal market shifts.
Meaning:
Appears in downtrends; suggests a strong bullish reversal, as the middle doji shows indecision, with confirmation by a strong bullish move.
THREE WHITE SOLDIERS
What is the Three White Soldiers pattern?
The Three White Soldiers pattern consists of three consecutive bullish candles, each closing higher than the last, often appearing in downtrends to signal a potential bullish reversal. This pattern reflects sustained buying pressure, indicating that buyer sentiment is strong. Psychologically, it shows that buyers are steadily gaining confidence, pushing prices upward.
For traders, Three White Soldiers provide a clear signal of momentum, ideal for capturing emerging trends.
Meaning:
Found in downtrends; signals potential trend reversal, showing sustained buying strength, often signaling the start of a bullish trend.
MORNING DOJI STAR
What is the Morning Doji Star pattern?
The Morning Doji Star pattern is similar to the Morning Star, but with a doji as the middle candle, indicating greater indecision before a reversal. This pattern consists of a bearish candle, a doji, and a bullish candle, highlighting a transition from bearish to bullish sentiment. The doji reflects a moment when market sentiment is balanced, but the third candle confirms a bullish shift.
Interpreting Morning Doji Stars can help traders identify turning points in downtrends, providing valuable entry opportunities.
Meaning:
Appears in downtrends; signals potential bullish reversal, with indecision from the doji and confirmation by a strong bullish candle.
EVENING STAR
What is the Evening Star pattern?
The Evening Star is a three-candle pattern that appears at the top of an uptrend, signaling a potential bearish reversal. It consists of a bullish candle, a small-bodied middle candle, and a bearish candle, showing a transition from buyer control to seller strength. This pattern often appears at market peaks, where optimism is giving way to caution.
Understanding the Evening Star pattern helps traders anticipate downtrend formations, allowing them to time their exits.
Meaning:
Found in uptrends; signals potential bearish reversal as sellers gain control, confirmed if the third candle closes below the first.
BEARISH ABANDONED BABY
What is the Bearish Abandoned Baby pattern?
The Bearish Abandoned Baby is the bearish counterpart to the Bullish Abandoned Baby and consists of a bullish candle, a gapped doji, and a bearish candle. This pattern reveals a dramatic shift in sentiment from bullish to bearish, highlighting a sudden reversal at the top of an uptrend.
Recognizing the Bearish Abandoned Baby can offer traders insight into market tops and impending trend changes.
Meaning:
Appears in uptrends; indicates strong bearish reversal, as indecision in the doji is followed by selling strength.
THREE BLACK CROWS
What is the Three Black Crows pattern?
The Three Black Crows pattern consists of three consecutive bearish candles, each closing lower than the last, appearing in uptrends to signal potential reversal. This pattern reflects sustained selling pressure, indicating that sellers are gaining control. The Three Black Crows highlight a moment when buyer confidence wanes, marking the beginning of downward momentum.
For traders, this pattern provides a clear signal to avoid buying into weakening trends or even entering short trades.
Meaning:
Found in uptrends; signals potential bearish reversal, with sustained selling pressure often marking the start of a downtrend.
EVENING DOJI STAR
What is the Evening Doji Star pattern?
The Evening Doji Star is similar to the Evening Star, but with a doji as the middle candle, highlighting greater indecision. This pattern consists of a bullish candle, a doji, and a bearish candle, indicating a shift from bullish to bearish sentiment. The doji suggests that buyers are losing control, with sellers prepared to reverse the trend.
Understanding Evening Doji Stars allows traders to recognize market tops, helping them avoid overextended trends.
Meaning:
Appears in uptrends; signals potential bearish reversal, as the doji suggests indecision, confirmed by strong selling on the third candle.
What Is a Morning Star Pattern & How Can You Use It in Trading?What Is a Morning Star Pattern, and How Can You Use It in Trading?
The morning star candlestick is a popular price action pattern that technical analysts and traders use to identify potential trading opportunities. It indicates a reversal from a bearish to a bullish trend and is a valuable addition to any trader's toolkit. In this article, we will cover all the technical aspects of the morning star candlestick pattern.
What Is the Morning Star Candlestick Pattern?
The morning star in technical analysis is a reversal formation that appears at the end of a downtrend and signals a trend reversal. It consists of three candles.
To identify it on the chart, you should look for the following:
1. Downtrend: The market should be in a downtrend, and the first candle should be long and bearish.
2. Indecision: The second candle is usually expected to have a gap down, but gaps are uncommon in forex. Therefore, a small-bodied candle is considered sufficient. It's worth noting it can be either bullish or bearish, but if it’s bullish, the signal is stronger.
3. Significant increase: The third candle should be strong and bullish and close above the midpoint of the first bearish one. If it forms with a gap up, the buy signal is considered stronger.
When Morning Star Candlestick Patterns Occur
Traders can identify the morning star candlestick pattern in stocks, forex pairs, commodities, and cryptocurrencies*. It may also be observed across various timeframes, from minutes to weeks.
Generally speaking, a morning star pattern can be considered more reliable when it appears on a higher timeframe. For instance, a morning star candlestick pattern has more significance when it occurs over three days vs three minutes, given the increased amount of price action and market participation reflected over longer periods.
Psychology Behind the Pattern
The morning star reversal pattern reflects a shift in market sentiment from bearish to bullish. Initially, a strong bearish candle indicates prevailing selling pressure. The second candle, with its small body, suggests indecision as the market stabilises and neither bulls nor bears dominate. This pause indicates that sellers are losing momentum. The third morning star candle, a strong bullish one, confirms the shift as buyers take control, driving prices higher. This pattern signals that the downtrend is likely exhausted, and a potential reversal is underway due to increasing buyer confidence.
Trading with the Morning Star
Traders can use the following steps to trade this setup:
1. Identify the setup: Look for a setup on the chart formed after a solid downtrend.
2. Confirmation: After identifying the formation, traders should confirm it before entering a long position.
3. Enter a long position: Consider entering a long position once the formation is confirmed.
4. Determine a take-profit target: Although candlesticks don’t provide specific entry and exit points, traders may consider the closest resistance level to take potential profit.
5. Monitor the trade: Continuously monitor the trade and adjust the stop-loss and take-profit levels as needed based on market conditions.
What Is the Morning Star Candlestick Strategy?
The morning star trading strategy leverages the formation's ability to signal a bullish reversal after a downtrend. The formation's reliability increases when it occurs at a support level and is confirmed by a momentum indicator like the RSI or MACD.
Entry:
- Traders look for the full morning star to form at a support level.
- They then look for a confirmatory bullish signal from a momentum indicator, such as RSI showing oversold conditions, a bullish MACD crossover, or a bullish divergence in either.
- Traders may wait for additional confirmation, like RSI moving back above 30, or enter on the close of the third candle in the pattern.
Stop Loss:
- A stop loss might be set below the swing low of the setup.
- Alternatively, traders may place the stop loss beyond the lower boundary of the established support level.
Take Profit:
- Profits might be taken at a predetermined risk-reward ratio, like 2:1 or 3:1.
- Traders also often aim for an opposing resistance level where a further reversal might occur.
Morning Star and Other Formations
Traders should not confuse the morning star candle formation with other formations, such as the evening star, which is the complete opposite.
Doji Morning Star
In a traditional morning star reversal pattern, the candle that appears in the middle of the formation has a small real body, meaning there is a clear difference between the opening and closing prices.
In a morning doji star formation, the second candlestick has characteristics of a doji, where the opening and closing prices are very close to each other, resulting in a very small real body. This reflects the indecision as neither bulls nor bears can take control of the market.
The doji setup is less common than the traditional formation, but it still signals a potential upward movement after a prolonged downtrend.
Evening Star
In contrast to a morning setup, an evening star is a bearish setup occurring after an uptrend. It also consists of three candles – a long bullish one, a small-body one (it can also be a doji), and a long bearish one that closes below the midpoint of the first bullish candle. This suggests that the market is about to turn down.
Benefits and Limitations of the Morning Star Candle
The morning star is a useful tool for traders seeking to identify potential market reversals, but it does come with some benefits and limitations.
Benefits
- Strong Reversal Signal: Indicates a bullish reversal after a downtrend, helping traders anticipate upward moves.
- Broad Applicability: Effective across various financial instruments such as forex, stocks, commodities, and cryptocurrencies*.
- Timeframe Flexibility: It can be observed on different timeframes, from intraday to weekly charts.
Limitations
- False Signals: Like all patterns, it can produce false signals, especially in volatile markets.
- Confirmation Needed: A morning star pattern entry requires confirmation from additional indicators or formations to improve accuracy.
- Experience Required: Identifying the formation correctly and interpreting its signals requires experience and a good understanding of price action.
Final Thoughts
While candlestick formations such as the morning star can be useful for traders to identify potential trading opportunities, it is crucial to remember that they are not foolproof and should not be the sole choice of market participants when making their trading decisions. Traders should also incorporate technical indicators and develop risk management techniques to potentially minimise losses.
FAQ
What Is a Morning Star in Trading?
The meaning of a morning star in trading refers to a bullish reversal formation consisting of three candles. It appears at the end of a downtrend, indicating a potential shift to an uptrend. The setup includes a long bearish candle, a small-bodied candle, and a long bullish candle.
Is the Morning Star Bullish or Bearish?
It is a bullish candlestick pattern that indicates a potential reversal from a downtrend to an uptrend in the market. It suggests that the selling pressure is subsiding, and buying pressure is beginning to take over.
What Does the Morning Star Pattern Indicate?
It is a three-candle price action, often indicating a bullish reversal in the market. It suggests that selling pressure has been exhausted, and buyers are starting to gain control of the market.
How Do You Read the Morning Star Pattern?
To read the morning star formation, traders should look for the following characteristics: a long bearish candle formed in a solid downtrend and followed by a bullish or bearish candle with a small real body, which in turn is followed by a long bullish candle closing above the midpoint of the first one.
What Is the Opposite of Morning Star?
The opposite of a morning star is the evening star, a bearish reversal pattern. It appears at the end of an uptrend, signalling a potential shift to a downtrend. The morning and evening stars are similar, except the latter mirrors the former, consisting of a long bullish candle, a small-bodied candle, and a long bearish candle.
*Important: At FXOpen UK, Cryptocurrency trading via CFDs is only available to our Professional clients. They are not available for trading by Retail clients. To find out more information about how this may affect you, please get in touch with our team.
This article represents the opinion of the Companies operating under the FXOpen brand only. It is not to be construed as an offer, solicitation, or recommendation with respect to products and services provided by the Companies operating under the FXOpen brand, nor is it to be considered financial advice.

NZDUSD - Bullish SharkThat is why the Shark Pattern and the Crab Pattern is the toughest harmonic pattern to trade. And that is also why we must ensure that our students are well-versed with Harmonic Patterns and have profited from other Harmonic Patterns before we teach these bad boys.
We are back into the waiting phase; I'm waiting for a 3-bar reversal pattern to engage the trade.

Top candlestick Patternshello everyone.
we have the more important candlestick patterns here.
these patterns are powerful when occur in 2 situation together:
1)on top or bottom of a trend
2)when we are at an important support or resistance level.
combination of these patterns with other technical patterns and tools
can be very useful and powerful also.
hope have good trades.

SHORT ON GOLD - SUPPLY & DEMANDGOLD is currently at a key supply zone, marked out on the 30M timeframe. Previously, GOLD has rejected this zone with strong momentum, and we can already see strong selling pressure at this zone.
We've just seen a huge bearish engulfing candle formed the 30M timeframe, creating a new lower low. I am now looking for GOLD to come up to supply once more to complete the head & shoulder pattern making that lower high which so happens to line up with the 61.8 Fibonacci level.
I personally believe GOLD is heading higher into the 1800 (Golden zone) where we have another supply zone, however GOLD has started to reject the 30M supply zone instead but please do trade with caution!
Long-term- I believe GOLD is going to break out of this range and head up to the mid-1800 area in the next few weeks/months. This idea is fuelled by the high inflation rate around the world, specifically the US where they are at a 38 year high of 6.8%. GOLD is seen as a hedge against inflation and with concerns over the new Covid variant, investors may start moving their money into safer assets such as GOLD / US Dollar / Japanese Yen.
This is merely a possibility and a trading idea so please do trade with caution and ensure correct risk management is implemented.
Good luck and let me know your thoughts!

There should probably be an opportunity to buyFibo Retracement levels combination, key zone, weekly candle stick formation (parents with doji)
In case of pull back please notice the targets that I have provided.
Good luck

AMZN Rounding Top Hits SupportAmazon bounced off of support, after falling quickly at a steep Angle of Descent™, and the bounce has not reversed the trend. Support is weaker due to candlestick formations.
