BTC/USDT | BTC Eyes a New Rally After $116K Pullback! (READ)By analyzing the Bitcoin (BTC) chart on the 12-hour timeframe, we can see that after reaching $116,000, the price partially filled the Fair Value Gap (FVG) we were watching and then started a correction. Currently, BTC is trading around $111,700.
If the price can hold above the $110K support level, we can expect another bullish move toward higher levels.
The next potential upside targets are $113,800, $116,000, $119,600, and $120,800.
Please support me with your likes and comments to motivate me to share more analysis with you and share your opinion about the possible trend of this chart with me !
Best Regards , Arman Shaban
Cardano

Cardano Inflows Jump To 3-Month High As Holders Rescue ADA PriceCardano’s price currently hovers above the $0.66 support level but risks slipping below it if bearish momentum continues. A drop under this line could push ADA down to $0.60 in the coming days.
Continued whale selling could exacerbate downward pressure even if inflows remain strong. Persistent profit-taking from large holders would make sustained recovery more difficult.
However, if ADA manages to hold $0.66 and attract renewed buying interest, the altcoin could rise above $0.69 and potentially reach $0.75. Such a move would invalidate the bearish outlook and mark the start of a short-term rebound.

ADA Price Target 2025 We’re currently moving within a narrowing triangle pattern. If the altcoin season continues without any major black-swan events, geopolitical tensions, or Fed actions that trigger public fear and institutional exits, we could see potential upside moves toward ~$1.2 first, and then ~$2.0 as a secondary target.
The breakout could be even stronger, but once large buyers start to quiet down ( SELL ), it’s usually wise to lock in profits and protect gains.

BTC/USD | BTC Crashes to $102K, Then Bounces Back – Still UnstabBy analyzing the Bitcoin (BTC) chart on the 12-hour timeframe, we can see that last night, following Trump’s tweet, the market faced a sharp sell-off, with BTC dropping all the way down to $102,000. After hitting this key demand zone, Bitcoin bounced back strongly, rallying up to $115,000, and is now trading around $110,000.
However, BTC still looks unstable, struggling to hold steady — to continue its bullish trend, it must stay above $110K. If it fails to hold this level, we could see the price dip below $100K again. This analysis will be updated soon as the market develops.
Please support me with your likes and comments to motivate me to share more analysis with you and share your opinion about the possible trend of this chart with me !
Best Regards , Arman Shaban

LTC/USDT | Litecoin’s 30% Rise Marks the Start of a Bigger Move!By analyzing the Litecoin (LTC) chart on the weekly (logarithmic) timeframe, we can see that the price started rising from around $115 after the last analysis and has now reached $133, marking a solid gain of over 30% so far!
If the current momentum continues, we could see Litecoin moving even higher. The next bullish targets are $155, $200, and $268.
Please support me with your likes and comments to motivate me to share more analysis with you and share your opinion about the possible trend of this chart with me !
Best Regards , Arman Shaban

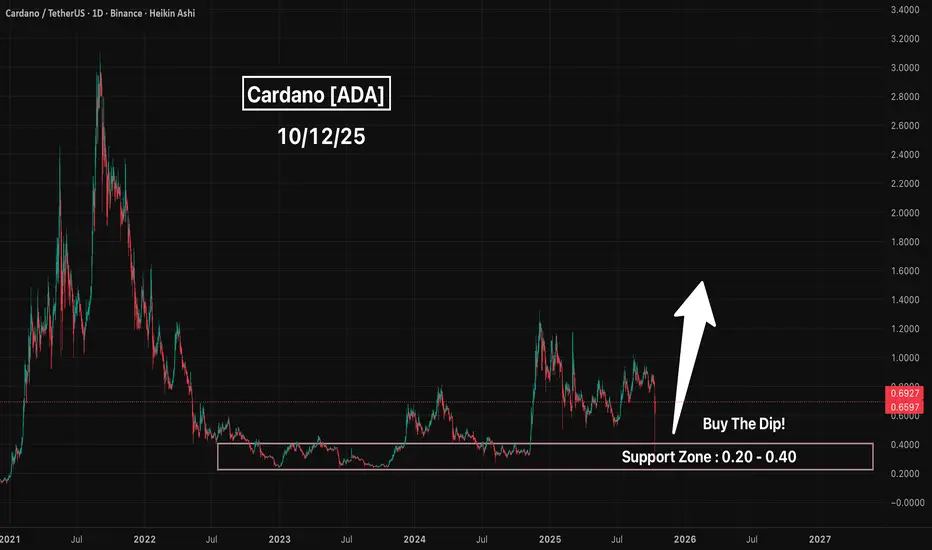
Cardano (ADA) - Price Action Looking Strong Bullish! Cardano (ADA) — Price Action Looking Strong 👀
Cardano just had a huge dip into the support zone. That’s exactly what you want to see from a healthy market setup.
This move likely cleared out weak hands and filled some serious buy orders in that $0.34–$0.36 range. The bounce that followed shows there’s still strong demand sitting underneath.
If ADA can hold above this zone, I wouldn’t be surprised to see it build momentum in the coming weeks as Bitcoin continues to push higher. Historically, ADA tends to lag a bit, but once it catches fire, it runs fast.
This might honestly be one of the last chances to grab ADA cheap before a bigger breakout move.
Key areas I’m watching:
🔹 Support: $0.20–$0.40 (liquidity sweep zone)
🔹 Next resistance: $1.33+ (psychological and structural breakout zone)
🔹 Bigger breakout target: $3.00-$5.00+ (breaking previous ATH if BTC keeps leading)
Not financial advice, but the setup looks clean. Structure’s shifting, liquidity’s cleared, and sentiment’s turning — this is where smart money usually starts paying attention.
ADA/USDT - IdeaCardano chart analysis shows a bullish trend, though it’s complex due to significant liquidity at the bottom. The price may experience a short-term drop to around 0.45 USD, followed by a bullish move targeting 1.10–1.25 USD.

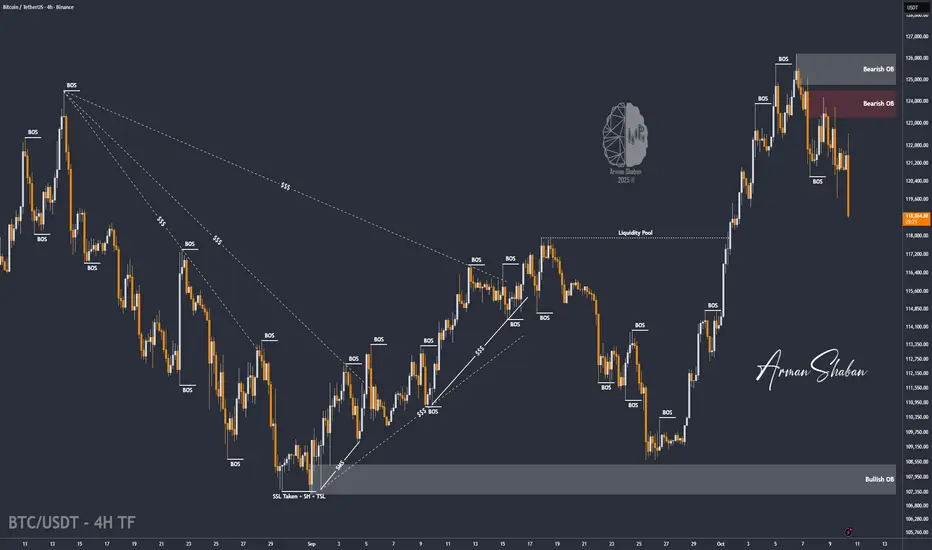
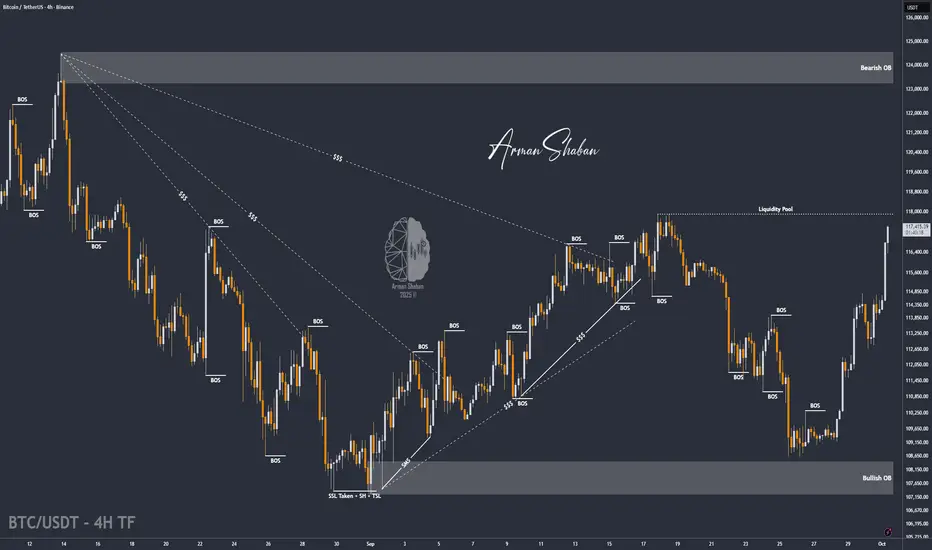
BTC/USDT | BTC Correction in Play – Will $117K Hold the Line?By analyzing the Bitcoin (BTC) chart on the 4-hour timeframe, we can see that after rallying up to $126,000 and setting a new all-time high (ATH), the price faced a sharp correction and is now trading around $119,000.
This drop could extend further toward $117,000, which is a key level to watch closely. If Bitcoin manages to hold above this zone, we could see the next bullish wave begin. Otherwise, the next major demand zones are at $115,000, $113,500, and $112,120.
Please support me with your likes and comments to motivate me to share more analysis with you and share your opinion about the possible trend of this chart with me !
Best Regards , Arman Shaban
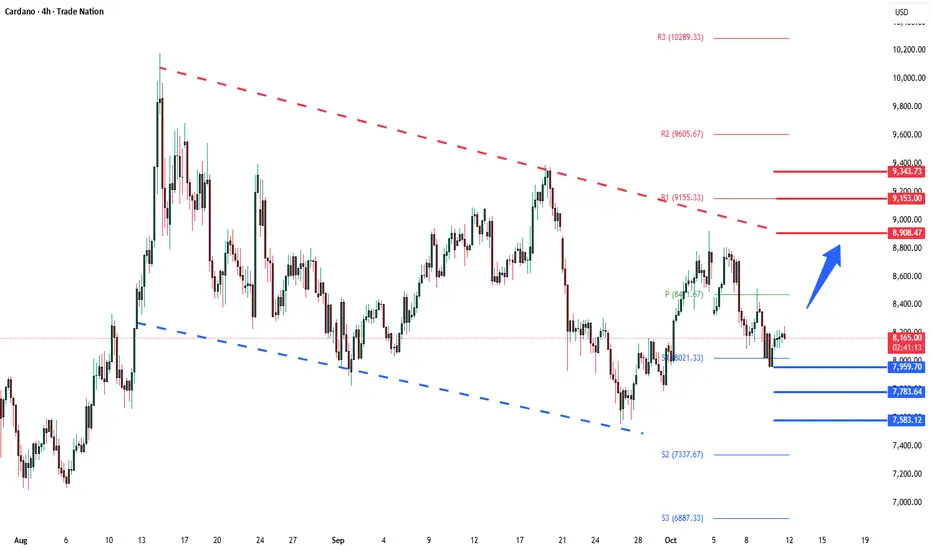
ADAUSD support at 7960The ADAUSD remains in a bullish trend, with recent price action showing signs of a breakout within the broader uptrend.
Support Zone: 7960 – a key level from previous consolidation. Price is currently testing or approaching this level.
A bullish rebound from 7960 would confirm ongoing upside momentum, with potential targets at:
8908 – initial resistance
9153 – psychological and structural level
9344 – extended resistance on the longer-term chart
Bearish Scenario:
A confirmed break and daily close below 7960 would weaken the bullish outlook and suggest deeper downside risk toward:
7784 – minor support
7584 – stronger support and potential demand zone
Outlook:
Bullish bias remains intact while the ADAUSD holds above 7960. A sustained break below this level could shift momentum to the downside in the short term.
This communication is for informational purposes only and should not be viewed as any form of recommendation as to a particular course of action or as investment advice. It is not intended as an offer or solicitation for the purchase or sale of any financial instrument or as an official confirmation of any transaction. Opinions, estimates and assumptions expressed herein are made as of the date of this communication and are subject to change without notice. This communication has been prepared based upon information, including market prices, data and other information, believed to be reliable; however, Trade Nation does not warrant its completeness or accuracy. All market prices and market data contained in or attached to this communication are indicative and subject to change without notice.
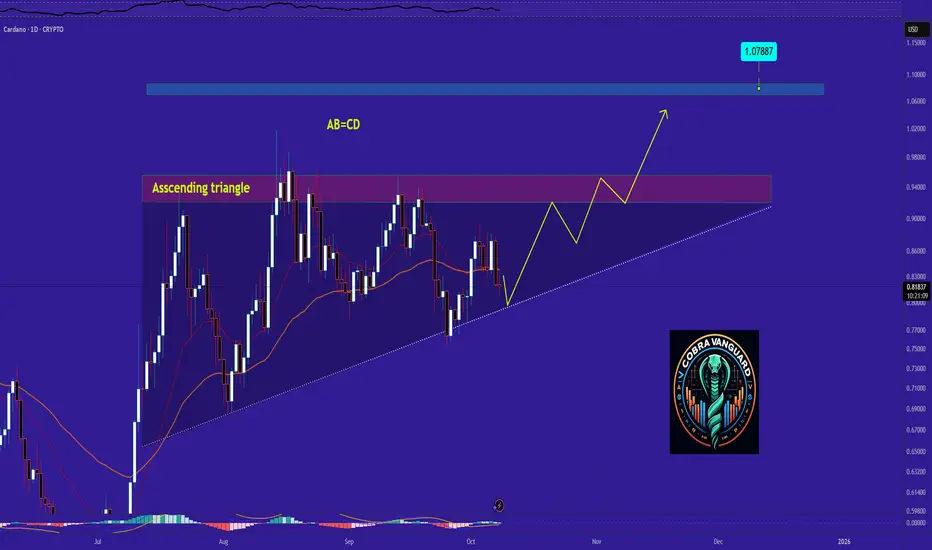
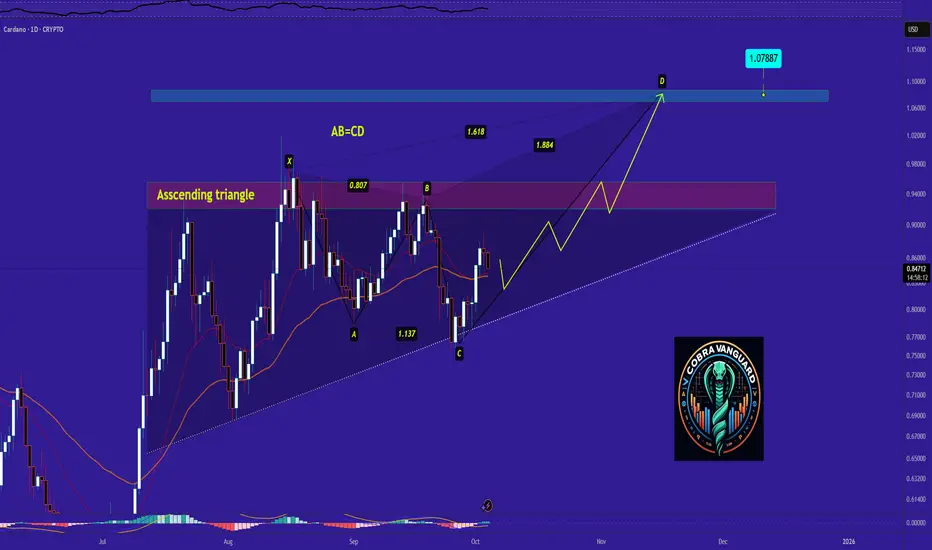
Cardano's situation+ Target PredictionCurrently, ADA is forming an ascending triangle, indicating a potential price increase. It is anticipated that the price could rise, aligning with the projected price movement (AB=CD).
However, it is crucial to wait for the triangle to break before taking any action.
Best regards CobraVanguard.💚
IAGON has huge potentialIAGON has huge upside potential, it’s a very undervalued DePIN project on Cardano. They have a collaboration with the Würth Group that brings revenue to node operators and stakers, along with two upcoming CEX listings and a pilot with a Fortune 50 company on IAG. Breaking the black line is the trigger for another uptrend , and as you can see, it’s ready to go parabolic, especially if we see an alt season after the Clarity Act passes in 2025.

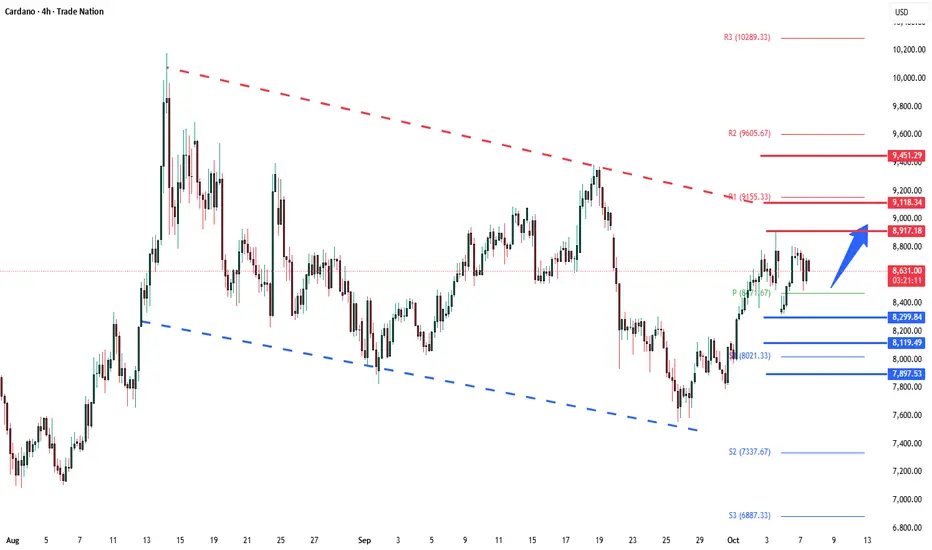
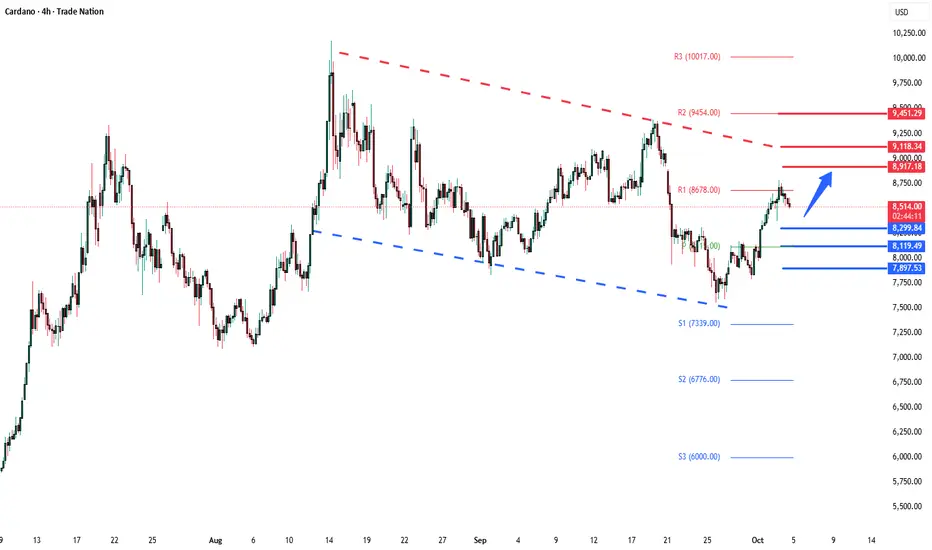
Cardano ADAUSD sideways consolidation supported at 8300The ADAUSD remains in a bullish trend, with recent price action showing signs of a breakout within the broader uptrend.
Support Zone: 8300 – a key level from previous consolidation. Price is currently testing or approaching this level.
A bullish rebound from 8300 would confirm ongoing upside momentum, with potential targets at:
8920 – initial resistance
9120 – psychological and structural level
9450 – extended resistance on the longer-term chart
Bearish Scenario:
A confirmed break and daily close below 8300 would weaken the bullish outlook and suggest deeper downside risk toward:
8120 – minor support
8900 – stronger support and potential demand zone
Outlook:
Bullish bias remains intact while the ADAUSD holds above 8300. A sustained break below this level could shift momentum to the downside in the short term.
This communication is for informational purposes only and should not be viewed as any form of recommendation as to a particular course of action or as investment advice. It is not intended as an offer or solicitation for the purchase or sale of any financial instrument or as an official confirmation of any transaction. Opinions, estimates and assumptions expressed herein are made as of the date of this communication and are subject to change without notice. This communication has been prepared based upon information, including market prices, data and other information, believed to be reliable; however, Trade Nation does not warrant its completeness or accuracy. All market prices and market data contained in or attached to this communication are indicative and subject to change without notice.
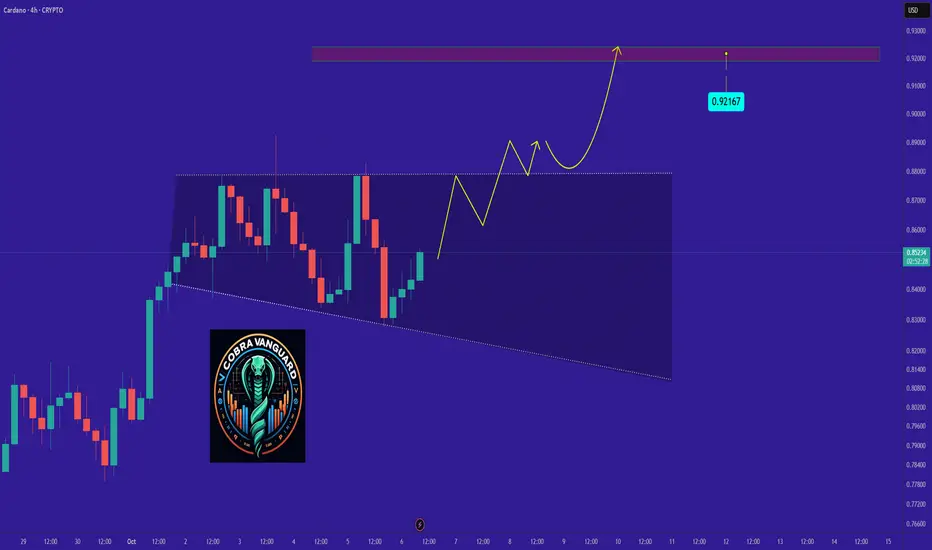
Cardano Price Gains Capped by Long-Term Holder PressureCardano’s price currently trades at $0.87, hovering just below its immediate resistance of $0.88. The token remains approximately 14% away from the psychologically important $1.00 level, a threshold that could reignite market enthusiasm if successfully breached.
Given the mixed outlook from investors and technical indicators, ADA is likely to continue its sideways movement. The cryptocurrency may remain rangebound between $0.83 and $0.88 until decisive buying volume emerges.
However, if long-term holders pause their selling and market sentiment improves, ADA could break past the $0.88 barrier and rise toward $0.93. Such a move would restore bullish confidence and potentially pave the way for a broader recovery phase in the weeks ahead

ADA Multi-Year Downtrend Nearing EndCardano CRYPTOCAP:ADA is forming higher lows and looks ready for a big breakout once it moves above the red resistance line. Price is currently in the accumulation zone, which means smart money might be loading up here.
Plan:
Buy Zone: Between 0.75 and 0.88
Stop Loss: Below 0.66 (if it drops there, the setup fails)
Targets:
TP1: 1.09
TP2: 1.35
TP3: 1.70
TP4: 2.18
TP5: 3.10
Strategy:
Start with a small position here. Add more only after a confirmed breakout above 0.90.
Once the first target hits, book some profits and move your stop loss to entry.
Note:
This is a long-term setup, could take several months to play out. Always do your own research (DYOR).

BNB/USDT | BNB Smashes $1200 Target – Momentum Remains Strong!By analyzing the BNB (Binance Coin) chart on the weekly timeframe, we can see that the price continued its bullish rally exactly as expected, breaking multiple new all-time highs (ATHs) and hitting the $1200 target.
It’s now trading around $1220, and the previous analysis remains valid. The next upside targets are $1400 and $1550, while the main support and demand zone lies between $980–$1050.
This setup has delivered over 30% profit so far — hope you made the most of it!
Please support me with your likes and comments to motivate me to share more analysis with you and share your opinion about the possible trend of this chart with me !
Best Regards , Arman Shaban

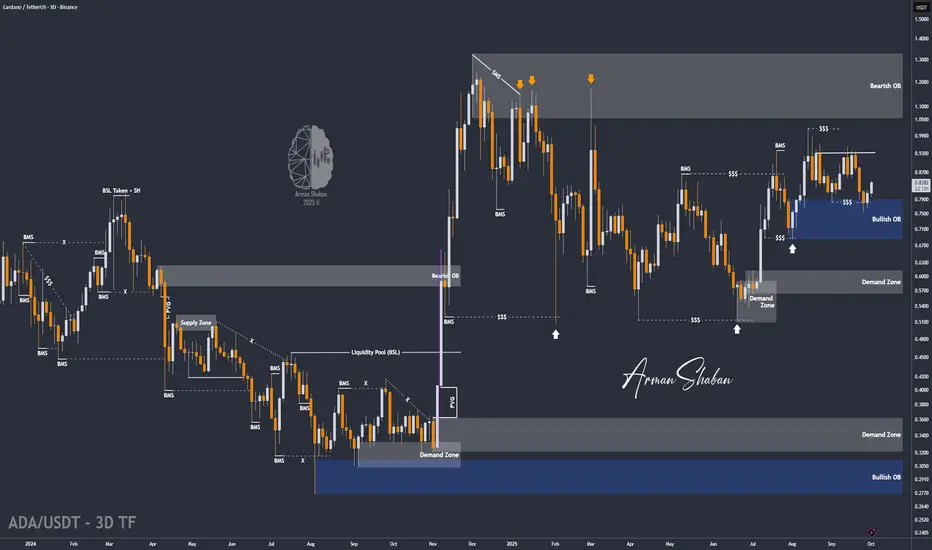
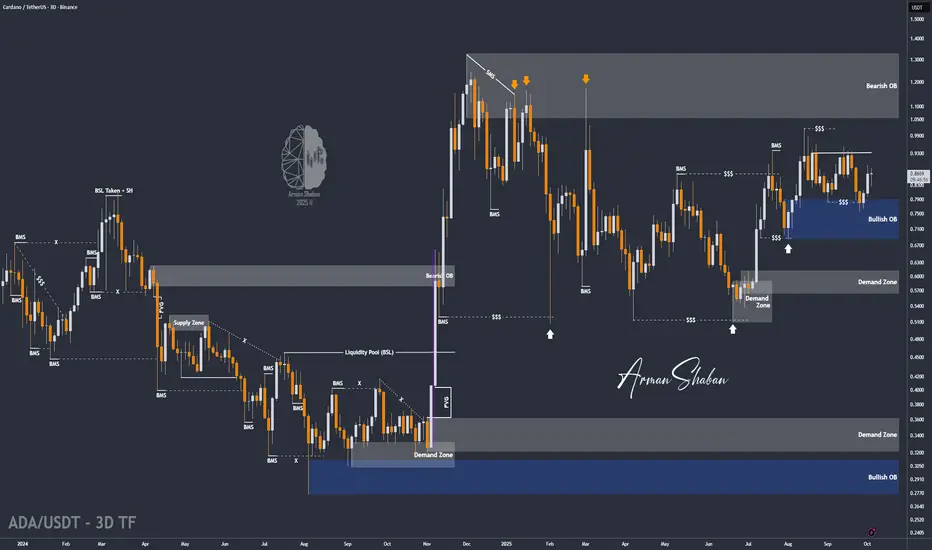
ADA/USDT | ADA Keeps Rising – Ready for the $1 Breakout?By analyzing the Cardano (ADA) chart on the 3-day timeframe, we can see that the price has continued its strong upward move as expected and is now trading around $0.87, just a step away from hitting the next target at $0.95.
The momentum remains strong, and I expect to see even more bullish movement soon.
Short-term upside targets are $1.00, $1.05, $1.17, and $1.33.
Please support me with your likes and comments to motivate me to share more analysis with you and share your opinion about the possible trend of this chart with me !
Best Regards , Arman Shaban
Why ADA Remains Bullish and Its Next Potential Move !The ETH will increase 3 CENTS and reach to the top of the wedge .
We can be hopeful that after breaking out of the wedge, we will see significant price growth.
Best regards CobraVanguard.💚
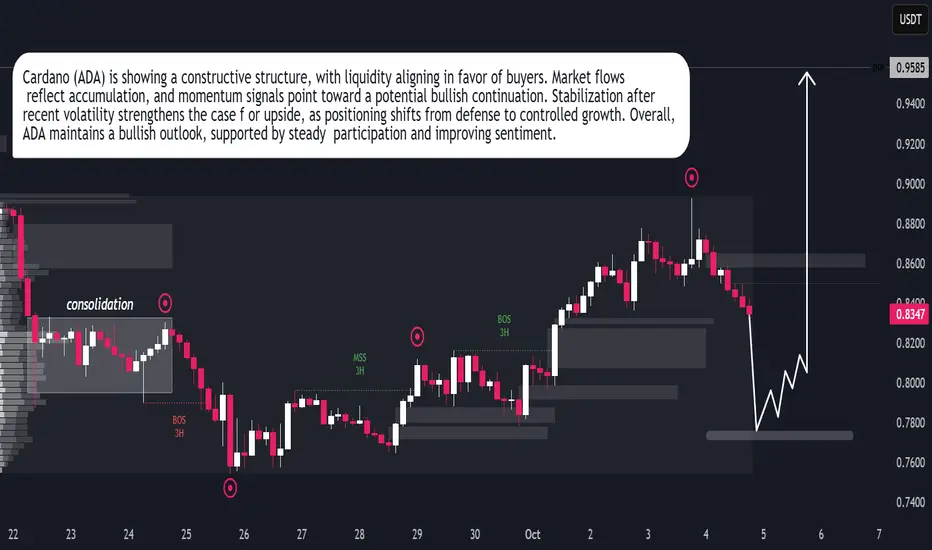
Cardano (ADA) Ready for Bullish ExpansionCardano (ADA) Ready for Bullish Expansion
Cardano (ADA) is building strength as market conditions favor accumulation over distribution. Liquidity behavior shows steady inflows, suggesting participants are positioning for upward continuation. The recent stability reflects confidence, with sentiment gradually tilting toward growth. Momentum indicators align with this view, reinforcing the prospect of a bullish expansion phase. ADA’s structure signals resilience, and the market tone supports the case for sustained upside in the near term.
Cardano's situation+ Target PredictionCurrently, ADA is forming an ascending triangle, indicating a potential price increase. It is anticipated that the price could rise, aligning with the projected price movement (AB=CD).
However, it is crucial to wait for the triangle to break before taking any action.
Best regards CobraVanguard.💚
Cardano bullish breakout continuationThe ADAUSD remains in a bullish trend, with recent price action showing signs of a breakout within the broader uptrend.
Support Zone: 8300 – a key level from previous consolidation. Price is currently testing or approaching this level.
A bullish rebound from 8300 would confirm ongoing upside momentum, with potential targets at:
8920 – initial resistance
9120 – psychological and structural level
9450 – extended resistance on the longer-term chart
Bearish Scenario:
A confirmed break and daily close below 8300 would weaken the bullish outlook and suggest deeper downside risk toward:
8120 – minor support
8900 – stronger support and potential demand zone
Outlook:
Bullish bias remains intact while the ADAUSD holds above 8300. A sustained break below this level could shift momentum to the downside in the short term.
This communication is for informational purposes only and should not be viewed as any form of recommendation as to a particular course of action or as investment advice. It is not intended as an offer or solicitation for the purchase or sale of any financial instrument or as an official confirmation of any transaction. Opinions, estimates and assumptions expressed herein are made as of the date of this communication and are subject to change without notice. This communication has been prepared based upon information, including market prices, data and other information, believed to be reliable; however, Trade Nation does not warrant its completeness or accuracy. All market prices and market data contained in or attached to this communication are indicative and subject to change without notice.
ETH/USDT | ETH Weekly Setup – Strong Demand Pushes Toward $6K!By analyzing the Ethereum chart on the weekly timeframe, we can see that after entering the $3,800 demand zone, ETH gained strong buying pressure and reached the $4,200 and $4,600 targets.
Currently, Ethereum is trading around $4,500, up about 19%, and I expect further bullish movement soon. The next upside targets are $4,950, $5,500, and $6,000.
THE LATEST TA :
Please support me with your likes and comments to motivate me to share more analysis with you and share your opinion about the possible trend of this chart with me !
Best Regards , Arman Shaban

BTC/USDT | BTC Rally +7% Gains – Bulls Still in Control (READ)By analyzing the Bitcoin chart on the 4-hour timeframe, we can see that the price continued its rally as expected, hitting the $115K target and now reaching up to $117,200, just one step away from the next target at $118K. So far, this analysis has delivered more than 7% gains. I hope you made the most out of it!
Please support me with your likes and comments to motivate me to share more analysis with you and share your opinion about the possible trend of this chart with me !
Best Regards , Arman Shaban
ADA/USDT | ADA Breakout Setup – More Upside AheadBy analyzing the Cardano (ADA) chart on the 3-day timeframe, we can see that the price has started to rise as expected and is now close to the first target at $0.85, giving us more than 11% gains from the previous analysis so far.
All other points from the last analysis remain valid. The next short-term targets are $0.95 and $1.00, while the mid-term targets are $1.05, $1.17, and $1.33.
Please support me with your likes and comments to motivate me to share more analysis with you and share your opinion about the possible trend of this chart with me !
Best Regards , Arman Shaban