BTC/USDT | Bitcoin Rally Setup – Next Stops: $116.7K and Beyond!By analyzing the Bitcoin chart on the 4-hour timeframe, we can see that the price is currently trading around $115,500. As long as it holds above the key support zone of $113,700–$115,300, I expect Bitcoin to continue its bullish move toward higher levels.
The next possible upside targets are $116,700, $117,450, and $118,600. Longer-term targets will be shared in future updates!
Please support me with your likes and comments to motivate me to share more analysis with you and share your opinion about the possible trend of this chart with me !
Best Regards , Arman Shaban
Cardano

ADA/USDT | Cardano Targets $1 – Pump Ahead? Let's See!By analyzing the Cardano (ADA) chart on the 3-day timeframe, we can see that after our last analysis, the price corrected down to $0.78. Then, with renewed demand, it started rising again and has so far reached $0.89.
Based on the price action, if ADA can hold above $0.85, we could see a strong rally or even a pump. The possible bullish targets are $0.93, $1.00, and $1.05.
Please support me with your likes and comments to motivate me to share more analysis with you and share your opinion about the possible trend of this chart with me !
Best Regards , Arman Shaban

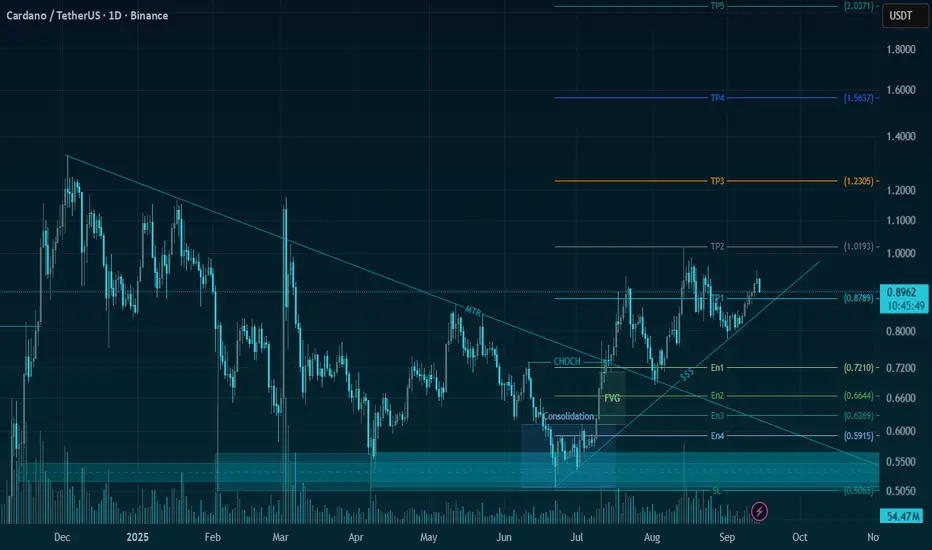
ADA/USDT | Low-Risk Swing Setup with 215%+ Upside Potential🚀 Trade Setup Details:
🕯 #ADA/USDT 🔼 Buy | Long 🔼
⌛️ TimeFrame: 1D
--------------------
🛡 Risk Management (Example):
🛡 Based on $10,000 Balance
🛡 Loss-Limit: 1% (Conservative)
🛡 The Signal Margin: $463.61
--------------------
☄️ En1: 0.721 (Amount: $46.36)
☄️ En2: 0.6644 (Amount: $162.26)
☄️ En3: 0.6269 (Amount: $208.62)
☄️ En4: 0.5915 (Amount: $46.36)
--------------------
☄️ If All Entries Are Activated, Then:
☄️ Average.En: 0.6458 ($463.61)
--------------------
☑️ TP1: 0.8789 (+36.09%) (RR:1.67)
☑️ TP2: 1.0193 (+57.84%) (RR:2.68)
☑️ TP3: 1.2306 (+90.55%) (RR:4.2)
☑️ TP4: 1.5637 (+142.13%) (RR:6.59)
☑️ TP5: 2.0372 (+215.45%) (RR:9.99)
☑️ TP6: Open 🔝
--------------------
❌ SL: 0.5065 (-21.57%) (-$100)
--------------------
💯 Maximum.Lev: 3X
⌛️ Trading Type: Swing Trading
‼️ Signal Risk: 🙂 Low-Risk! 🙂
--------------------
🔗 www.tradingview.com
❤️ Your Like & Comments are valuable to us ❤️
SOL/USDT | SOL Breaks 7-Month High – Still Bullish Above $218!By analyzing the Solana chart on the daily timeframe, we can see that the price is still pushing toward higher targets based on the main analysis. It has reached its highest level in the past 7 months and is currently trading around $225.
If the price holds above the key $218 level, we can expect further growth toward levels above $245. This analysis will be updated again. So far, the return from this setup has been more than 52% — I hope you’ve made the most of it!
Please support me with your likes and comments to motivate me to share more analysis with you and share your opinion about the possible trend of this chart with me !
Best Regards , Arman Shaban

DOGE/USDT | Dogecoin Bulls Eye $0.287, $0.32, and Beyond! (READ)By analyzing the Dogecoin chart on the daily timeframe, we can see that, as expected, the price was supported around $0.21, which brought strong demand. This move gave nearly a 20% return, hitting the target at $0.24, and the momentum is still strong. I believe the next target at $0.287 could be reached soon.
The key supply zones are $0.264–$0.289 and $0.305–$0.34. Based on the main analysis, the next possible targets are $0.287, $0.32, $0.41, and even $0.70.
Please support me with your likes and comments to motivate me to share more analysis with you and share your opinion about the possible trend of this chart with me !
Best Regards , Arman Shaban

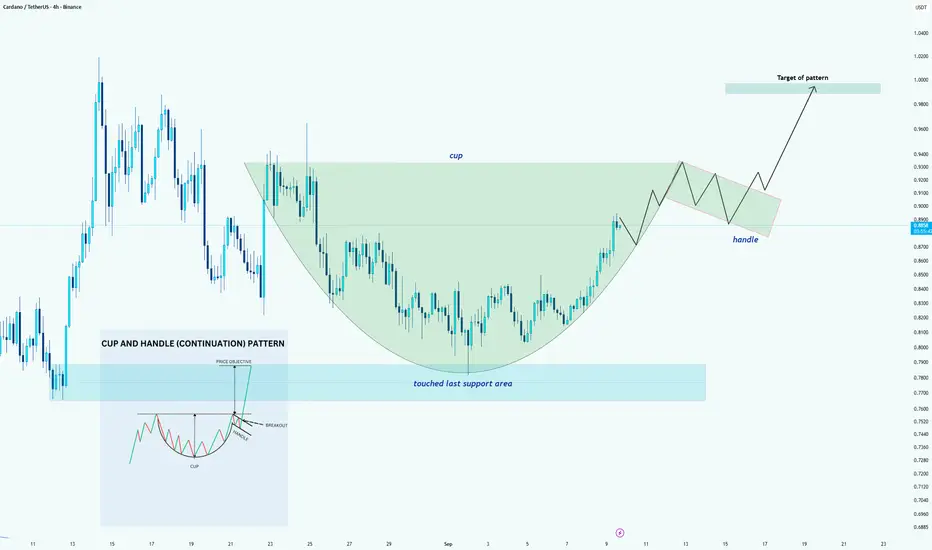
ADA/USDT – Cup & Handle PerspectiveHello guys!
Currently, the chart is showing the formation of a potential cup and handle pattern. The rounded bottom of the cup has already developed, suggesting that market participants are gradually regaining buying interest after the recent decline.
However, it’s important to note that:
The handle has not yet formed, and
A breakout confirmation is still missing.
This means the pattern is not yet validated —> it’s only a perspective and assumption at this stage. For the setup to confirm, we would need:
A consolidation forming the handle, and
A clean breakout above the neckline area.
If the breakout occurs with solid volume, the measured target of the pattern could push the price toward the $1.00 level, which also aligns with psychological resistance.
ETH/USDT | Ethereum Eyes $5,100, $5,500 & $6,000 – New ATH AheadBy analyzing the Ethereum chart on the weekly timeframe, we can see that the price is still trading around $4,400. If it holds above the $3,900 level, I expect a strong bullish wave toward new targets and fresh all-time highs.
Given the current momentum, this bullish move could start soon, with possible targets at $5,100, $5,500, and $6,000.
Please support me with your likes and comments to motivate me to share more analysis with you and share your opinion about the possible trend of this chart with me !
Best Regards , Arman Shaban

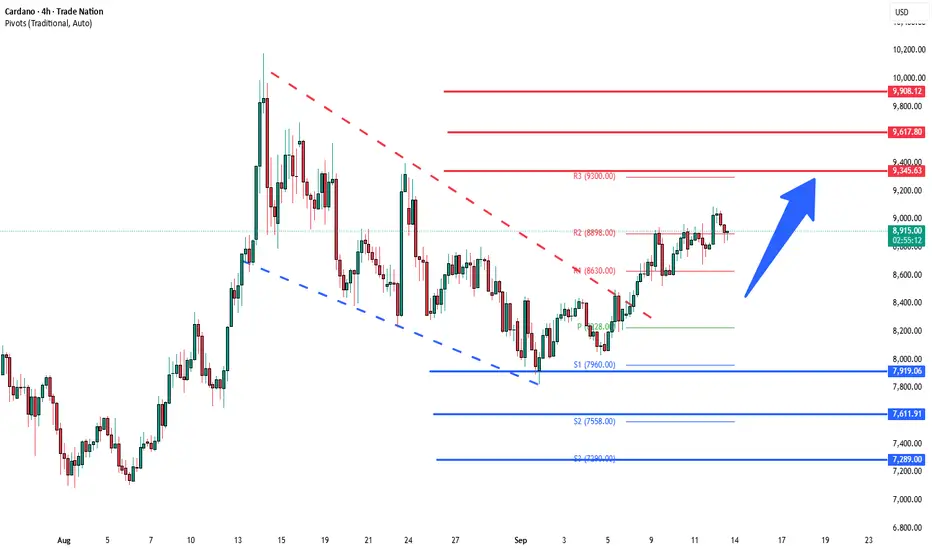
Cardano initial support at 8,220The ADAUSD remains in a bullish trend, with recent price action showing signs of a corrective pullback within the broader uptrend.
Support Zone: 7920 – a key level from previous consolidation. Price is currently testing or approaching this level.
A bullish rebound from 7920 would confirm ongoing upside momentum, with potential targets at:
9345 – initial resistance
9617 – psychological and structural level
9900 – extended resistance on the longer-term chart
Bearish Scenario:
A confirmed break and daily close below 7920 would weaken the bullish outlook and suggest deeper downside risk toward:
7611 – minor support
7290 – stronger support and potential demand zone
Outlook:
Bullish bias remains intact while the ADAUSD holds above 7920. A sustained break below this level could shift momentum to the downside in the short term.
This communication is for informational purposes only and should not be viewed as any form of recommendation as to a particular course of action or as investment advice. It is not intended as an offer or solicitation for the purchase or sale of any financial instrument or as an official confirmation of any transaction. Opinions, estimates and assumptions expressed herein are made as of the date of this communication and are subject to change without notice. This communication has been prepared based upon information, including market prices, data and other information, believed to be reliable; however, Trade Nation does not warrant its completeness or accuracy. All market prices and market data contained in or attached to this communication are indicative and subject to change without notice.
ADA – Cardano Swing Long IdeaADA – Cardano Swing Long Idea
📊 Market Sentiment
Market sentiment remains strongly bullish as the FED is expected to deliver a 0.25% rate cut, with speculation building for a possible 0.5% cut in September. Monetary policy shifts are being driven by both inflation trends and weakening labor market data. The latest August and September job reports were soft, signaling that the economy is cooling rapidly. This environment continues to fuel expectations for a major bullish run in the weeks ahead.
📈 Technical Analysis
Price found support on September 1st at the bullish HTF trendline and has been moving upward since.
Price is currently at the HTF Key Resistance level, showing accumulation rather than sharp rejection, with deviations pushing upward. This indicates strength and a bias toward higher prices.
📌 Game Plan
1)Watch for a daily close above the bearish trendline.
2)Look for the HTF Key Resistance to be broken and confirmed with a daily close above.
🎯 Setup Trigger
Entry after the retest of the HTF Key Resistance level ($0.885).
📋 Trade Management
Stoploss: Daily close below HTF Key Level ($0.85 area)
Targets:
TP1: $0.96
TP2: $1.02
💬 Like, follow, and comment if you find this setup valuable!
⚠️ Disclaimer: This content is for informational and educational purposes only and does not constitute financial, investment, or trading advice. Always do your own research before making any financial decisions.

ADA analysis.Give me some energy !!!The price on the daily timeframe is within an ascending triangle, which can be promising. If the price breaks this pattern with bullish candles, it could easily rise by the distance of AB=CD .
Best regards CobraVanguard.💚

ADA/USDT – 5th Wave Breakout or Extended 4th Wave?KUCOIN:ADAUSDT might have completed its 4th wave of the larger 5 wave structure, but confirmation depends on breaking out of the current channel.
The daily RSI is nearing overbought, so there’s still a chance for a minor dip before continuation. Current upside target sits between 1.085 -1.20 USDT , aligning with the larger channel and forming a higher high. If this plays out, it likely completes a first wave of a bigger five-wave structure, followed by a cooldown.

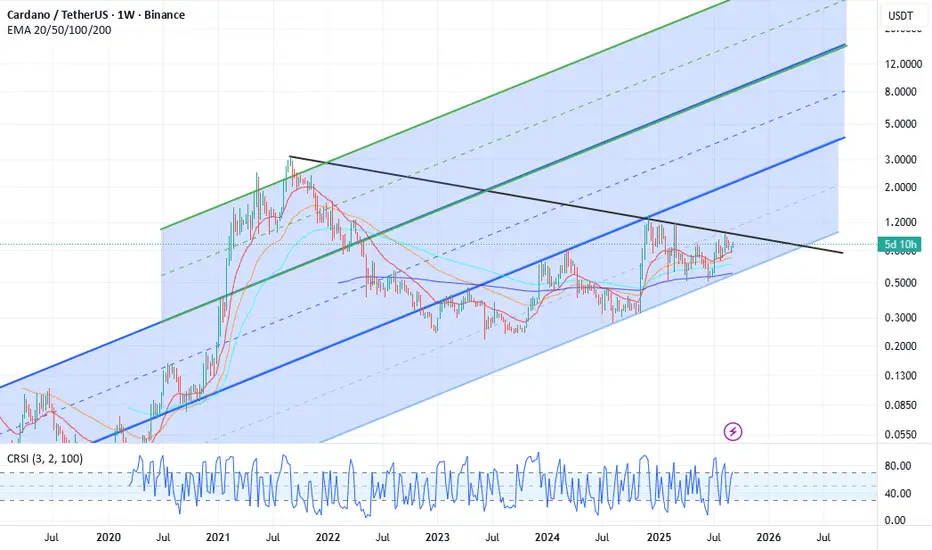
CARDANO Bullish Leg to $1.075 has just started.Cardano (ADAUSD) is on a strong rebound following the September 01 Low, which was a technical Higher Low at the bottom of the Channel Up that started on the June 22 bottom.
That pattern managed to break last month above the 8-month Lower Highs trend-line of the massive mid-Cycle correction that ADA had. This Channel Up has priced its two Higher Highs so far just above the 1.236 Fibonacci extension.
As a result, we expect the current Bullish Leg to reach at least $1.0750.
-------------------------------------------------------------------------------
** Please LIKE 👍, FOLLOW ✅, SHARE 🙌 and COMMENT ✍ if you enjoy this idea! Also share your ideas and charts in the comments section below! This is best way to keep it relevant, support us, keep the content here free and allow the idea to reach as many people as possible. **
-------------------------------------------------------------------------------
💸💸💸💸💸💸
👇 👇 👇 👇 👇 👇

Cardano Ready for a Major Move – Huge Potential for $ADACardano has significant potential, but from a technical perspective we still need to see a decisive confirmation candle above the black trend line before a sustained breakout can be confirmed. If we break this trend line with strong momentum, the next mid-term targets are $1.20 and $1.60.
On the fundamental side, there is a strong pipeline of catalysts: BTC DeFi on Cardano enabled by its shared UTXO structure, the upcoming Leios upgrade for scalability, Hydra L2 for faster transactions, and the launch of the first Cardano partner chain Midnight, which focuses on privacy and selective disclosure to meet enterprise demand.
Looking further ahead, the possible targets for 2026 are in the $3 to $8 range, which align with the mid-line of the second ascending channel.
Considering both the technical setup and the fundamentals, I see substantial upside potential for Cardano in late 2025 and into 2026, with the possibility of outperforming BTC, ETH, and SOL as adoption and utility expand.
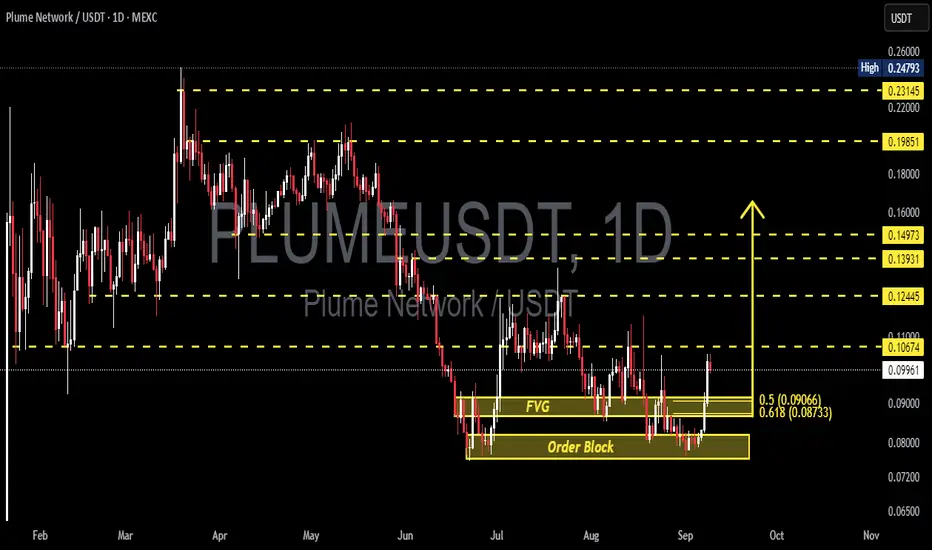
PLUME/USDT (1D) — Decision: Major Reversal or Deeper Correction?🔎 Technical Outlook
PLUME is currently at a critical stage after months of decline since April. The price has found a strong demand zone around 0.076–0.082, aligned with a daily Order Block, reinforced by a Fair Value Gap (FVG) highlighting an imbalance zone that often acts as a turning point.
From this zone, PLUME bounced sharply toward 0.100–0.106, which now stands as the first key resistance. This strong reaction suggests accumulation by larger players — but the real battle begins here: will PLUME break above 0.10674 to confirm a bullish reversal, or face rejection and revisit the demand zone?
---
🟢 Bullish Scenario
1. Upside Confirmation:
A daily close above 0.10674 would signal short-term bullish momentum. Breakout could open the path toward higher resistance levels:
Target 1: 0.12445
Target 2: 0.13931
Target 3: 0.14973
Major Upside Zone: 0.19851 → 0.23145
2. Entry Ideas:
Conservative: wait for a retest at 0.090–0.092 (FVG) with stop-loss below 0.078.
Aggressive: buy after a daily close above 0.10674 with volume confirmation.
3. Why Bullish Could Work:
Strong bounce from demand zone.
FVG often gets filled before continuation.
Breaking 0.10674 would form a higher high and signal structure shift.
---
🔴 Bearish Scenario
1. Rejection at Resistance:
If the price fails to break 0.10674, PLUME is likely to revisit:
The FVG area (0.087–0.091).
The Order Block (0.076–0.082).
2. Breakdown of Demand Zone:
Losing this support zone could send PLUME lower toward 0.065.
3. Short Setup Idea:
Entry: rejection near 0.105–0.107 with bearish confirmation.
Stop-loss: above 0.112.
Take-profit: first at 0.087–0.091, then 0.076–0.082.
---
📌 Pattern in Play
Order Block + FVG: strong demand zone overlap.
Potential Reversal Zone: could mark a major turning point.
Key Pivot: 0.10674 — breakout or rejection here will define the next trend.
---
📝 Conclusion
PLUME is at a make-or-break moment:
Bullish Valid: daily close above 0.10674 → opens the way to 0.124–0.149 and potentially higher.
Bearish Valid: rejection at resistance and breakdown of the Order Block → downside risk toward 0.065.
The 0.076–0.091 demand zone is the last line of defense for buyers.
⚠️ Always apply strict risk management, as this setup is highly prone to false breakouts and fake pumps.
---
#PLUME #PLUMEUSDT #Crypto #TechnicalAnalysis #Altcoin #OrderBlock #FVG #PriceAction #CryptoTrading #SupplyDemand
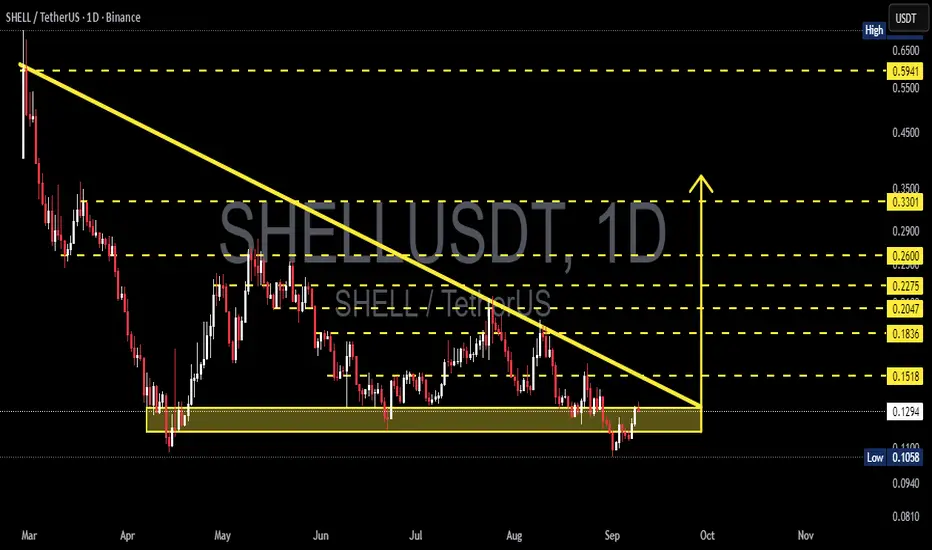
SHELL/USDT — Decision Point at the Edge of Descending TriangleCurrently, SHELL/USDT (1D) is at a critical stage after a prolonged downtrend since March. The chart clearly shows a Descending Triangle pattern, with strong support around 0.1058 – 0.1350.
Each time price dips into this zone, buyers step in for a rebound — yet sellers consistently push lower highs, forming a descending trendline. This signals the market is in a consolidation phase before a major decision: either a breakout to the upside or a breakdown to the downside.
---
🔎 Pattern and Chart Structure
Main pattern: Descending Triangle (default bias = bearish).
Strong support: 0.1058 – 0.1350 (demand zone, tested multiple times).
Dynamic resistance: Descending trendline (~0.1518 now).
Key levels to watch:
Resistance: 0.1836 → 0.2047 → 0.2275 → 0.2600 → 0.3301 → 0.5941.
Support: 0.0940 → 0.0810 (if breakdown).
---
🚀 Bullish Scenario
Bullish momentum may emerge if there’s a daily close above 0.1518 with strong volume, signaling buyers breaking through the descending pressure.
Initial target: 0.1836.
Mid targets: 0.2047 – 0.2275.
Extended targets: 0.2600 → 0.3301 → potentially 0.5941 if momentum accelerates.
Strategy: Enter after breakout confirmation, stop loss below 0.1300 or below 0.1058 for full invalidation.
---
🐻 Bearish Scenario
If price fails at the trendline and instead breaks down below 0.1058 on a daily close, the descending triangle plays out as a bearish continuation.
First target: 0.0940.
Next target: 0.0810.
Strategy: Enter short/re-entry on breakdown, with stop loss above 0.1200–0.1300.
---
📌 Conclusion: “Decision Zone”
SHELL/USDT is at a critical decision zone. Buyers are defending support, while sellers continue pressing down with lower highs.
Breakout above trendline → potential trend reversal.
Breakdown below support → bearish continuation.
Traders should avoid FOMO and wait for clear confirmation (breakout or breakdown). Risk management is essential: use stop loss and proper position sizing.
---
#SHELL #SHELLUSDT #Crypto #TechnicalAnalysis #SupportResistance #Breakout #DescendingTriangle #CryptoTrading
INIT/USDT — The Big Battle at the Trendline!Is it time for a breakout and reversal, or just another false hope before the downtrend continues?
---
🔎 Overview
INIT/USDT is currently trading around 0.3626 USDT, after a prolonged downtrend since its peak in May. Price has formed a series of lower highs & lower lows, with the yellow descending trendline acting as the main “wall” suppressing every rally.
Interestingly, the market is now approaching a critical test at the trendline. From here, the market will reveal its true intention:
If it breaks above, a major reversal could begin.
If it fails and gets rejected, the downtrend may continue, retesting lower supports.
---
🧩 Pattern Analysis
1. Dominant Descending Trendline
The psychological barrier for sellers since the top.
As long as this trendline holds, the primary trend remains bearish.
2. Local Base / Consolidation
Price has recently formed a local bottom around 0.28–0.32.
This zone serves as the current foundation for potential upside.
3. Key Horizontal Levels (Dashed Lines)
0.4053 → nearest resistance and first “gate” to bullish bias.
0.4782 → next resistance, momentum confirmation.
0.5317 & 0.5799 → mid-term upside targets.
0.7972 → key psychological area if a full reversal unfolds.
---
🚀 Bullish Scenario
Key trigger: Daily close above trendline + 0.4053.
Confirmation: Breakout supported by higher volume + successful retest of trendline as new support.
Upside targets:
0.4782 → +31.9% from current price.
0.5317 → +46.6%.
0.5799 → +59.9%.
Longer-term potential: If momentum builds, price could aim for 0.7972 up to 1.1662.
---
🩸 Bearish Scenario
Rejection at the trendline: Reversal candles here would signal sellers remain in control.
Downside targets:
Retest support at 0.32–0.28.
If this zone breaks, likely move down to historical low at 0.20 (−44.8% from current price).
False breakout risk: A breakout without volume could turn into a bull trap.
---
📌 Strategy & Risk Management
Conservative entry (low risk): Wait for daily close above 0.4053 + retest → enter with staged profit-taking.
Aggressive entry: Buy directly on breakout above trendline with tight stop-loss under recent swing low.
Short plan: Enter on strong rejection at the trendline, with first target near 0.28 support.
Stop-loss: Always place SL based on structure (e.g., under 0.28 for longs, above rejection high for shorts).
Money management: Risk ≤ 1–2% of capital per trade.
---
⚖️ Conclusion
INIT is at a critical juncture.
Breakout above the trendline + 0.4053 = early reversal signal with multi-stage upside potential.
Rejection at trendline = continuation of downtrend toward 0.28–0.20 support.
In this condition, discipline is key: don’t FOMO, wait for confirmation, and stick to strict risk management.
---
#INIT #INITUSDT #CryptoAnalysis #TechnicalAnalysis #Breakout #SupportResistance #Trendline #CryptoTrading #MarketUpdate

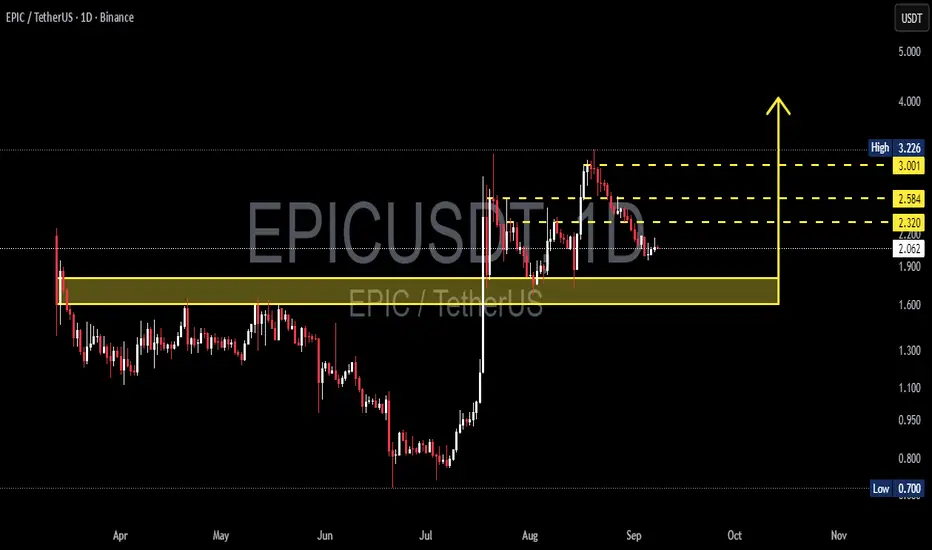
EPIC/USDT — Post-Breakout Distribution & Key Decision Levels!
🔎 Chart Summary
EPIC/USDT is currently in a distribution phase after a strong parabolic rally during mid-July – August. After hitting a local high of 3.22, price started forming lower highs, showing gradual selling pressure, and is now trading around 2.06.
The key battleground lies in the 1.55–1.75 demand zone (yellow box) — this zone will decide whether price consolidates for another leg up, or breaks down for a deeper correction.
---
🔑 Key Technical Levels
Current Price: 2.065
Immediate Resistances: 2.320 → 2.584 → 3.001 → 3.226 (High)
Major Support (Demand Zone): 1.55 – 1.75
Extreme Long-Term Support: 0.700 (historical low)
---
📌 Pattern & Market Structure
Pre-rally phase: Sideways accumulation (March – June) around 1.0–1.7.
July → August: Parabolic breakout with massive impulse.
After the pump: Market entered distribution/sideways range between ~1.9–3.2, with multiple rejections near 3.0+.
Current daily candles show lower highs, indicating weakening bullish momentum.
Overall, the setup resembles a distribution range rather than a clean bullish continuation, leaving the market in a neutral-to-bearish bias unless confirmed otherwise.
---
🟢 Bullish Scenario
Confirmation: Daily close above 2.32 + successful retest as support.
Targets:
TP1: 2.58
TP2: 3.00
TP3: 3.22 (previous high)
Invalidation: Daily close back below 1.95 or breakdown under 1.75.
Reasoning: Breakout above 2.32 signals buyers regaining control, opening room to retest major resistance zones.
---
🔴 Bearish Scenario
Confirmation: Daily close below 1.90, followed by a breakdown of the 1.55–1.75 demand zone.
Targets:
TP1: 1.20–1.10
TP2: 0.70 (in case of a full capitulation)
Invalidation: Price regains 2.32 with strong volume confirmation.
Reasoning: Failure to hold the demand zone confirms distribution phase is over, leading into a markdown phase.
---
📈 Strategy & Risk Management
Use 2.32 (resistance) and 1.75 (demand zone) as decision points.
Wait for confirmed breakout/retest before entering — avoid chasing price.
Risk only 1–2% per trade and size positions accordingly.
Use partial take-profit strategy: lock gains at 2.58, let runners ride to 3.0+.
Always track volume: weak breakouts without volume = high risk of false moves.
---
🧩 Conclusion
EPIC/USDT is at a critical crossroads:
Holding above 1.75 and breaking 2.32 would trigger a bullish continuation towards 2.58–3.00.
Losing the 1.55–1.75 demand zone could drag the market back to 1.20 or even 0.70.
This is a decisive moment for swing traders and mid-term investors to watch closely.
---
#EPIC #EPICUSDT #CryptoAnalysis #Altcoin #SwingTrading #TechnicalAnalysis #CryptoBreakout #PriceAction #SupportResistance
ADA Battles $0.82 – Can Bulls Break $0.87 Resistance?Cardano (ADA) is trading around $0.82–$0.83 on the 4H chart, holding above its key support but still capped under resistance. In today’s video, I focus only on the short-term price structure: support at $0.8157–$0.8014, deeper levels at $0.7724 and $0.7620, and resistance at $0.8484, $0.8710, and $0.9347. A breakout above $0.8710 would be a key step for ADA to confirm recovery momentum.
The mid-term bias remains for more upside, but ADA must prove strength step by step. With Bitcoin showing bullish signals this morning and today’s NFP release increasing volatility, ADA’s reaction at these levels will define whether bulls can take control or if we see another retest of support.

Cardano (ADAUSD) key support at 7920The ADAUSD remains in a bullish trend, with recent price action showing signs of a corrective pullback within the broader uptrend.
Support Zone: 7920 – a key level from previous consolidation. Price is currently testing or approaching this level.
A bullish rebound from 7920 would confirm ongoing upside momentum, with potential targets at:
9345 – initial resistance
9617 – psychological and structural level
9900 – extended resistance on the longer-term chart
Bearish Scenario:
A confirmed break and daily close below 7920 would weaken the bullish outlook and suggest deeper downside risk toward:
7611 – minor support
7290 – stronger support and potential demand zone
Outlook:
Bullish bias remains intact while the ADAUSD holds above 7920. A sustained break below this level could shift momentum to the downside in the short term.
This communication is for informational purposes only and should not be viewed as any form of recommendation as to a particular course of action or as investment advice. It is not intended as an offer or solicitation for the purchase or sale of any financial instrument or as an official confirmation of any transaction. Opinions, estimates and assumptions expressed herein are made as of the date of this communication and are subject to change without notice. This communication has been prepared based upon information, including market prices, data and other information, believed to be reliable; however, Trade Nation does not warrant its completeness or accuracy. All market prices and market data contained in or attached to this communication are indicative and subject to change without notice.

ADA Buy/Long Setup (1D)Cardano, in our view, is currently within a major bullish structure, with wave D having just completed.
It now appears that the price is inside bullish wave E.
We have identified two specific entry levels for re-entering Cardano. At each entry level, you can take one step into a buy position.
The target is around \$1.20.
Please note that this analysis is based on the daily timeframe, so it may take some time to play out.
The invalidation level is the same as our stop loss. If this level is reached, the setup will be invalidated.
For risk management, please don't forget stop loss and capital management
Comment if you have any questions
Thank You

ETH/USDT | Hits $4950 ATH After 130% Rally – More Gains Ahead?By analyzing the Ethereum (ETH) chart on the weekly timeframe, we can see that, as expected, price has continued its bullish rally since our last analysis — successfully hitting all three targets at $4000, $4400, and $4900. With a remarkable 130% growth in just 77 days, Ethereum finally printed a new ATH at $4950!
Currently, ETH is trading around $4300, and as long as the price holds above the $3330–$3950 support zone, we can expect another strong bullish wave in the near future.
This analysis will be updated — stay tuned for the next move!
Please support me with your likes and comments to motivate me to share more analysis with you and share your opinion about the possible trend of this chart with me !
Best Regards , Arman Shaban

ADA Double BottomADA gets a double bottom signal from early April to mid June. The chart momentum broke the neckline twice, confirming the double bottom signal, promising a break to the upside. (LONG) I'm hoping for a break at $1.01.

SIGN/USDT – Critical Accumulation Zone Before the Next Big Move!📊 Detailed Analysis of SIGN/USDT
Currently, SIGN/USDT is moving within a prolonged consolidation phase, with the key demand zone at 0.06700 – 0.07000 USDT (highlighted in yellow). This zone has acted as a strong base since mid-June, repeatedly rejecting downside pressure, and can be considered a major accumulation area.
---
🔎 Market Structure & Pattern
1. Sideways Accumulation
The price is forming a sideways base within the range of 0.067 – 0.078 USDT. Such structures often precede a significant move, either a breakout to the upside or a breakdown lower.
2. Strong Support Zone
Primary Support: 0.06700 – 0.07000 USDT
Next Supports: 0.06300 – 0.05950 USDT, if breakdown occurs.
3. Layered Resistance (Supply Zones)
R1: 0.07382 – 0.07814 USDT
R2: 0.08532 – 0.08938 USDT
R3: 0.09576 – 0.10137 USDT
This structure signals that the price is currently at a decision point, awaiting confirmation of the next big move.
---
✅ Bullish Scenario
As long as price holds above 0.06700, this zone can serve as a strong rebound point.
A breakout above 0.07382 – 0.07814 will open the way toward 0.08532 – 0.08938.
Further bullish momentum above 0.09576 may push the price to 0.10137 USDT, which is the major resistance zone.
If sustained, this could evolve into an Ascending Accumulation Pattern, strengthening the bullish outlook.
---
❌ Bearish Scenario
If the price breaks below 0.06700, a drop toward 0.06300 – 0.05950 becomes highly likely.
A confirmed daily close below this support would shift the structure into a downtrend continuation, possibly extending losses toward 0.05650.
This scenario would reinforce bearish momentum and invalidate the current accumulation zone.
---
🎯 Key Takeaway
0.06700 – 0.07000 USDT is the make-or-break zone.
Holding above it keeps the bullish rebound potential alive, while a breakdown will accelerate the bearish trend.
For traders, this level can act as a strategic entry point with strict risk management, as the market is preparing for its next decisive move.
#SIGNUSDT #CryptoAnalysis #PriceAction #SupportResistance #CryptoTrading #Altcoins #ChartAnalysis #BullishScenario #BearishScenario
