CASH

BCH to around 1500 a real possibility! Traces of trend reversalWeekly candle charts are more accurate than daily candle charts, monthly are better than weekly and so on and so forth. Here we are looking at the monthly. We see something very nice. We see higher lows! It looks like we are on our way to retest 517 (our previous high) If we go over 517 or rather 520 (the crowd likes nice round numbers) then according to the monthly chart we don't have much stopping us getting to the price of between 1348 & 1842. Which would be an insane price jump. Higher lows is good but not a guarantee that the we are in an upwards trend, higher high is a better indicator so we shall wait and see. With the bitcoin halving coming up I speculate we will see a nice jump over that 520 mark and then whatever happens, happens. There is a natural resistance at the 1000 mark. I'm aware of that. Can't wait to see what unfolds.
As always! These are all probabilities and possibilities. Just like in holdem poker AA doesn't always win! But looking at this, I feel like I have a nice hand where Im willing gamble with it. If it doesn't pan out I take a tiny loss and live to play and wait for my next good hand.
Good luck! Be smart and always protect your money at all costs! It is the most important thing you need to learn.

BitcoinCash will crashBitcoin Cash (BCH) experienced a serious mining anomaly today. The network failed to produce a single block in a five-hour period and it didn’t even cause a significant transaction backlog.
***Bitcoin Cash usage is still lagging, show the latest blockchain event, where miners were unable to discover a block for hours. The Bitcoin Cash network returned to regular block production as of 8:00 UTC on Thursday, with a five-hour gap in block production. The event happened after block 620025, and the next block number, 620026, took more than five hours to discover and propagate.***
Are this opportunity for miners to change the game ? To share Mining power to some other networK? Jes it is, if this block lag continue the price will fall down 100%
Short I starts form 395-385
Short II starts from 375-370
LASTCHANCE starts from 355-345
Target price is 300-290
**STOP IT IF PRICE BRAKE 400**
This is not financial advice this is just idea


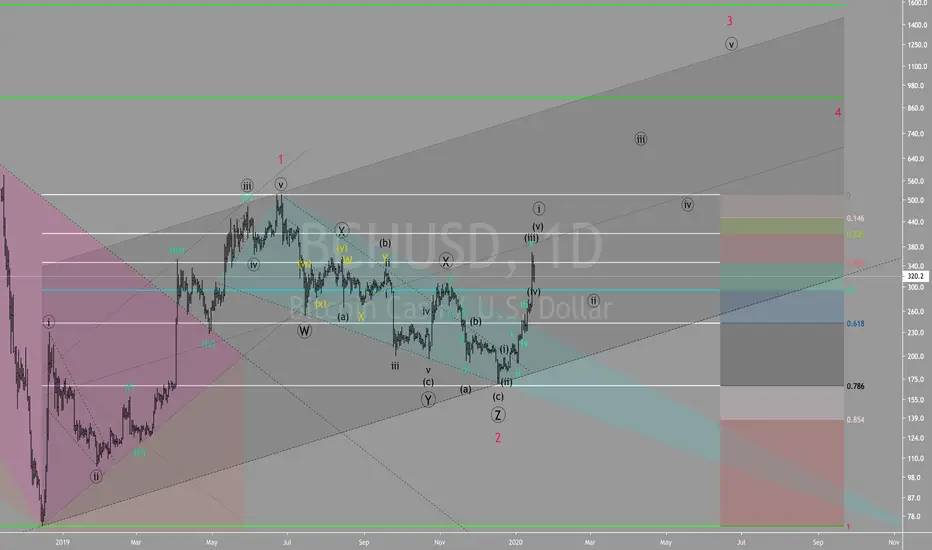
#BCH - Bitcoin Cash - CleanestBeen a while since I took a look at $BCH but it seems that this one is currently one of the cleanest counts out there.
Here is are my short term and long term counts for #BCH.
Will we see a bull market until the second half of 2020?
#CRYPTO #BCH

Great opportunity coming up Teva is going to hit a major resistance line causing a bounce back making two very high-profit scenarios that can be taken advantage of. I would recommend a entry of $8.50 or higher and an exit with your own judgment and stop losses.


Is bitcoin totally breaking out right now?What do you think the odds are for that lower low at around 5.7k?
i still think there is a chance it could happen, but at this very moment it seems more likely then not to be actually breaking out of the large scale correction, and this could cause massive pumps in the days and weeks to come..
it could also dump very hard right now if this is all just a fake break..
i still hold many long positions with most liquidations set below 5.7.

Gold going UPPPPP!!!!After months of gold trying to hit that 0.382 fibonacci retracement it finlly hit it and it hit our target aswell, after analysing gold again for some day, I have observed that gold formed an rever head and shoulders which would indicate that the gold will sky rocket, we have multiple confirmations now is a great time to but gold. Don't miss out :D!!! Remember to trade safe don't risk more than you can actually loose!!!

ADA RECHARGE?Description in the chart. Never trade with more than you are willing to lose, this is not financial advice.

DASH/USD Bullish ChartFirst let's take a look at the EMAs, we have a golden cross (50 EMA crossed above the 200 EMA) and our candles are above the 21 EMA = bullish. We will also have the 100 EMA cross above the 200 EMA soon which would be great also. Next lets take a look at the other indicators, our RSI has room to grow pointing upward as if to suggest that it wants to push into the power range above 70. The MACD is showing a little selling pressure but that can change especially with all the other indicators looking so great. Of course we must state the obvious, BTC controls this market and as long as BTC stays stable and or moves up DASH should also. What makes this even more interesting is the break out play that is building up, specifically the pattern that is possibly being created. I've drawn up an ascending triangle which looks to be forming, if we measure the triangle we look to have a possible breakout to around/between 213.00 - 224.00 dollar area. By looking left we can see that, that dollar area lines up with former resistance also, furthering the confluence and idea that this projects value may break upward.

SQ Climbing To $160 Before 2020. 100% Gains From Current Levels.NYSE:SQ Is heading to $160. A take over is possible by Facebook. Great business and is in tune with future payment methods, i.e. cryptocurrencies.


BCH.BTC (Prj.Y19.P2.E2).Buy ZoneIn short,
Many of the ALTs have reached what seems to be the bottom, and an expected bounce.
However we are not sure as we don't have enough data \ history to make this conclusion.
Many of the ALTs what I believe are still in the BEAR market and are still looking for the bottom, whereas BTC has and is in a bull trend\market.
BCH did well before BTC found its momentum. Question is will it do it again.
Hence my approach is, prove it and I will buy in.
I would like to see a day candle open and close at the target.
Cheers,
S.Sari / CryptoProspa
Previous post
Daily chart > 200 EMA to be overcome.


BCH (Prj.2019.P02.E01).MACRO.Level.H&SAs per Peter Brandt's tweet, and this chart, we see a Head and Shoulders formation. The target is $127.
My thoughts:
> One would expect at least 1 other level of consolidation on the way down before hitting the final target, as per the chart
> The 2x HULL moving average along with the Daily RSI chart, gives us an overview with the price movement and corresponding key indicators as to what's next
a) The reversal at the top was noted along with the cross over of the 2x Hull MA.
b) Anything below the 52.21 RSI on the Daily is viewed as a bearish trend and hence if the 2x Hull lines cross over along with the RSI crossing the 52% RSI, will give some sort of extra confirmation to go long
c) Fib. Fan along with noted support and resistance lines will also help identify when to go long.
d) Expecting a bounce around $172 price level for a short
Closeup view on the daily


Bitcoin Cash - Vital Area This area for Bitcoin Cash in USD is massive this could drop a lot if failure to hold. It has had a good amount of growth over the year but this could really ruin the statistics.

Support MAsthis is long term MA support on BTC each band is around 2.5x the next band, so it will fall to one, stall for a while, then fall to the next
looking like 7000 and then 5000 maybe in a couple months

BCHUSD 300% Parabolic Move Some thoughts and highlighted trendlines regarding Bitcoin Cash's quiet sideways movement, perhaps we'll see some movement from alts into 2020 now that attention is on Bitcoin. We have a head and shoulders possibility here to send us down, but I think that is already invalidated. H&S usually don't hold much weight in crypto.
Keep an eye on it!

Bitcoin Cash - Buy when it's cheap and sell when it's high.Hi friends, looking at the chart Bitcoin Cash price was playing in the range between two horizontal lines. And recently in med-term (4H timeframe I mean), it drew Falling wedge, and broke up finally.
So what can we do at current minor signal of altseason?
Binance coin finally got golden cross (50EMA, 200EMA). and the price is at the support line I think.
And why I think it's cheap, is my RSI pivot support/resistance line says it's oversold, and SToch also oversold.
Enjoy the trading with strict risk management.
Please press like button if my analysis is helpful.
Thank you guys!
