CCL: Buy, sell, hold or wait? A Triple Time Frame Analysis.Hello traders and investors! For the first time, I’ll do a public analysis on CCL. This stock is starting to get very popular (the 8th most active stock in the US today), so, let’s talk about it, and do a complete Multi Time Frame Analysis (MTFA) by looking the hourly, daily and weekly charts, and in the end, we’ll see if CCL is a buy or not.
First, in the 1h chart we have a breakout from the previous resistance level at $ 28.19 (green line), and the trend is still clearly bullish. At any moment CCL did lower lows, although it did a quick congestion last week, with no new highs.
Maybe we had something like a Cup and Handle , and if that’s the case, more upside will come.
But now, the 21 ema is pointing back up, and it is defeating the previous resistance. Now, let’s see the daily chart:
The volume increased a lot during the last bullish leg, which is a true sign of buy force. We could see a pullback to the 21 ema or to the green line at $ 24.38 and this wouldn’t ruin the bull trend, and only then we could see an opportunity to buy.
What’s more, CCL did an Inverted Head and Shoulders chart pattern, which is interesting to notice. Now, let’s see the weekly chart:
The trend is very strong here, and the $ 25.01 could work as a support level in the weekly chart. If you are looking for swing or position trade, this is the point where you should buy.
But now it feels like it is a little late to buy. For instance, I gave a call to the members of our community in my weekly newsletter a buy call when it did the “ Gift ” pattern seen in the chart. That was a good point to buy. Now it is going up almost 40% since then, so keep in mind that if you want to buy it, you may buy from those who want to book their profits and re-buy near a support level.
Now it is not the time to buy, neither to short, but to manage positions, and if you are out, just wait for a better opportunity and never buy near top levels . So far, there is no sell signal in CCL, so if you are in, you may just hold it.
If you liked this analysis, remember to follow me to keep in touch with my daily updates, and please, support this idea if it helped you!
Be careful and take care.
CCL


Price may continue to march toward 10days MA28-02-2021
Heading towards 100days MA at around $29
Travel stocks is going to boom once economy reopen.
Not to surprise if CCL revisit $22.
$18 is well supported

How I simplified IchimokuI've been a student and trader of Ichimoku for over 8 years. It has been the foundation of my trading strategies which have evolved over time. A few years ago I wanted to simplify my charts so I distilled down the essence of the indicator to 50% retracement levels. In this video I show examples of using either Ichimoku or it's fundamental premise of retracement levels to find trading opportunities and hedge against market corrections.

CCL Swing PlayCCL is up on nice volume. Its next resistance has a good profit margin. Here is my swing play idea:
Entry Price: 25.28
Target: 39.72
Stoploss: 22.85

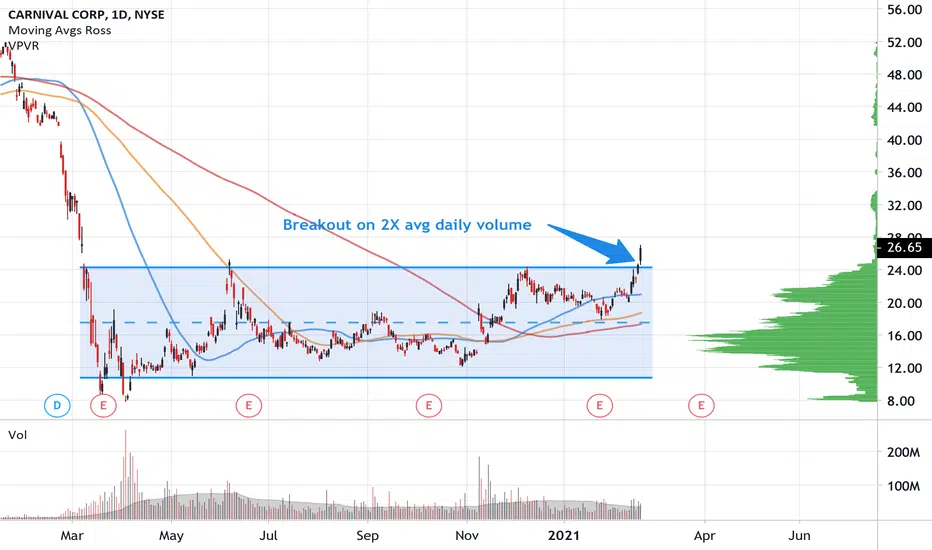
Breakout long in CCLCarnival Cruise Lines, along with the other major cruise carriers, fell sharply during the COVID selloff for obvious reasons.
CCL has been consolidating for almost a year to create a new price acceptance zone.
But the stock is now breaking out on high volume.
Look for a continuation higher on sustained volume as it enters price discovery mode toward higher prices.
CCL LongCCL @ 24.60 48 shares
Stop is set to 21.75.
Target is 27.35.
I will move my stop and double down at 27.35 and pyramid into my trade adding 48 more shares with the same stop target at 29.99 or higher I will sell part of my trade.
Trend following trade. I want to practice holding long and being patient.
Target exit is 2 months.

CCL possible breakout? Lets seeCCL could break out here to 26 and fill the gap that it failed to fill earlier in 2020.
However, it clearly rejected the gap fill on Friday. Time will tell what happens here. If we don't see a breakout next week this is a short to support.

Calls on CCLI like the pullback this morning on CCL to do an Ichimoku cloud pullback. Looking at the April 22.5 Calls.

NCLH is primed... $38+ incomingSimilar to my post in $CCL... Giant Cup & Handle, Bull Flag, Inverse H&S, overall bullish momentum in economy stocks... cruises are the last to ride, but we can still catch it.
Has a chance to fill the gap to $48+ by summer. Entered in $23s.

It is written - CCL to $31+Draw whatever targets you prefer. Cup & Handle, Bull Flag,Inverse H&S, you name it. Excited on this one, entered in 21s.
All else aside, people want to cruise. Combine business fundamentals with technicals (including CCL $8B+ in cash as of 9/30/20) this could be a home run.


Carnival Cruise Line - "Megaphones"Currently, I'm still looking for the best price to enter a long-term investment. The technical analysis gives a hint that it possible for CCL to recover. We can see a potential Golden cross on the daily time-frame and a Broadening Wedge Patterns or "Megaphones" on the weekly.
Sooner or later, the business and tourism will be back to normal. Carnival will be on my watchlist for a long-term investment.
Here's below the "Megaphones"
Catalyst:
- Golden Cross
- Megaphones

$CCL 4h Swing #UOACurrent Swing on CCL 25C 2/19. Entered with 20 calls with a great entry and trimmed 10 calls with around a 30 percent and each contract. I will cut contracts if we drop below 19 and may average down with more contracts with a closer strike if buyers step in

$CCL Few will understandFEW WILL UNDERSTAND!!!! Watch this play out. Gray boxes are load up zones once broken. And IT HIT BOTTOM!! counter trade me if you think otherwise.


Carnival plc. The Sweet Buy Opportunity you Should not Miss Carnival plc has been in a pull back. The pull back is over, now it's herding north. Keep an eye for any update. Thank you for the support.


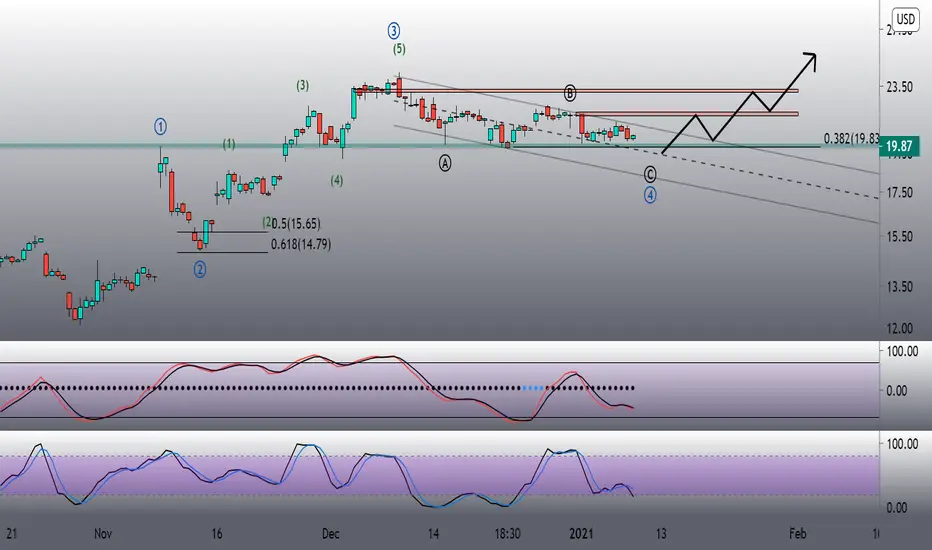
CCL Wave 5Surprisingly Carnival Cruise popped up on my scanner and has a good Elliott Wave count. The ABC correction is following parallel channel and demand zone lines up with the mid-line of the parallel channel. Wave 2 and Wave 4 are alternating and the 0.382 lines up with the demand zone. Looking for a play after earnings report this week.

THE WEEK AHEAD: FDX, LEN, MU, CCL EARNINGS; XOP/XLE, IWM/RUTEARNINGS ANNOUNCEMENT-RELATED VOLATILITY CONTRACTION PLAYS (IN ORDER OF ANNOUNCEMENT):
Here are the options-liquid underlyings announcing next week that I've culled down to 30-day >50% as candidates for volatility contraction plays:
LEN (21/49/11.6%),* announcing Wednesday after market close
MU (24/52/12.2%), announcing Wednesday (no time specified)
FDX (29/53/11.9%), announcing Thursday after market close
CCL (27/91/21.1%), announcing Friday (no time specified)
Pictured here is a January 15th 17.5/27.5 short strangle in CCL which announces Friday, paying 1.36 as of Friday close with delta/theta of -4.86/4.84 with break evens wide of 2 times the expected move on the call side, and between the 1 and 2 x on the put. Although no time is currently specified, it is likely to announce before market open (because who, like, announces after Friday close?), so would look to put on a play in the waning hours of Thursday's session if you want to take advantage of Friday's post-announcement volatility contraction.
EXCHANGE-TRADED FUNDS RANKED BY BANG FOR YOUR BUCK:
XOP (21/60/16.3%)**
GDXJ (15/44/12.9%)
XLE (30/45/12.5%)
KRE 924/41/11.1%)
SLV (25/40/11.2%)
GDX (16/38/10.7%)
EWZ (15/39/10.6%)
XBI (24/38/10.0%)
BROAD MARKET EXCHANGE-TRADED FUNDS:
IWM (25/30/7.8%)
QQQ (23/30/7.6%)
DIA (16/23/6.0%)
SPY (16/23/5.6%)
EFA (20/24/5.1%)
TREASURY/BOND FUNDS:
Adding a little bond/treasury section to here since I occasionally park what would otherwise be idle cash in short puts (See Post Below).
TLT (11/15/3.99%) (1.609% yield)
HYG (11/11/2.41%) (4.917% yield)
EMB (5/9/--)*** (4.024% yield)
AGG (29/8/--)*** (2.252% yield)
* -- The first metric is the implied volatility rank or percentile (i.e., where 30-day implied is relative to where it's been over the last 52 weeks); the second, 30-day implied volatility; and the third, what the January 15th at-the-money short straddle is paying as a function of stock price.
** -- Here, I'm using the short straddle price nearest 45 days until expiry to calculate the "bang for your buck" percentage, which would be the January 29th weekly.
*** -- EMB and AGG don't have weeklies nearest 45 days.

Carnival Stock Forecastccl - Carnival NYSE:CCL
The idea is to hold and go long only if the resistance level 25 USD will be broken

Carnival Corp w49 2020. Long from 17-19 TP 30Monthly
Downtrend reversal
Weekly
Restoration like aviation industry
Daily
Open 17.82
SL 14.5
TP 30
RR 3.65
