XAUUSD | Gold Signal |Dec 2,2025BUY TREND TARGET FOR TODAY 📊
The market is pricing in a near-certain rate cut in December. Dovish comments from Fed officials from Waller to Williams, coupled with weak manufacturing data, reinforce the argument that growth risks are rising faster than inflation risks. Gold reacted sensitively to this backdrop, with the dollar falling to a two-week low before recovering slightly. I believe the gold-silver market is entering a period of high volatility, but the bullish structure remains intact.
Rate cut expectations, a weaker dollar, and weak economic data continue to be the three main pillars supporting prices. However, rising bond yields and uncertainty over Fed leadership mean the rally could be interrupted in the short term. Powell’s speech this week will play a guiding role, especially on Q1 2026 interest rate expectations.1
Strategically, investors should keep a close eye on employment, PCE, and bond developments. In an environment where the monetary policy cycle is pivoting, gold plays the role of portfolio insurance, while silver continues to be the asset that responds most strongly to market sentiment and macro expectations, with higher returns but also greater risk.1% The main trend of gold remains bullish in structure.
♾️Gold BUY @ 4215- 4220
💰TP1 - 4225
💰TP1 - 4230
🚨Sl: 4210
Centered Oscillators

Estimated Bullish Probability: 80%
Weekly: Hammer+ → Light Green (strong weekly bullish hammer)
Daily: Hammer → Light Green (bullish daily hammer)
4H: Rising Three Soldiers+ → Light Red (bullish candlestick pattern, but 4H MACD is a short-term pullback)
Step 1 — base MACD color probability
Row Weekly Light Green / Daily Light Green / 4H Light Red → Low–Moderate (55–65%).
Use the midpoint for calculation:
Base MACD probability = 60%.
(Arithmetic check: 55 + 65 = 120; midpoint = 120 ÷ 2 = 60.)
Step 2 — adjust for candlestick patterns (how strong each pattern is on its timeframe)
Weekly Hammer+ (strong weekly bullish hammer) → +10% (weekly patterns carry heavy weight).
Daily Hammer (daily bullish hammer) → +8% (meaningful daily confirmation).
4H Rising Three Soldiers but MACD = Light Red → the candle is bullish, but the MACD color is a short-term pullback, so we give a small +2% (pattern helps, but momentum mismatch reduces its effect).
Step 3 — digit-by-digit arithmetic (exact)
Start with base: 60
Add Weekly hammer+: 60 + 10 = 70
Add Daily hammer: 70 + 8 = 78
Add 4H rising three soldiers (small bump): 78 + 2 = 80
Final result = 80%
Final answer
➡️ Estimated Bullish Probability: 80%
Quick interpretation / trade guidance
Weekly + Daily both show bullish hammers → strong higher-timeframe bias is up.
4H shows a bullish candle pattern (Rising Three Soldiers) but MACD is Light Red — that indicates a short-term pullback or consolidation. The candlestick pattern reduces the risk of immediate reversal but the MACD color suggests waiting for a 4H flip to green for the cleanest entry.
Practical entries: scale in on strength, or wait for 4H Light Red → Light Green flip (or a strong bullish 4H close). Use a stop below the 4H structure; consider a larger position if 4H confirms.
Rocket boost this content to learn more.
Warning!! Trading is risky please use a simulation trading account before you trade with real money

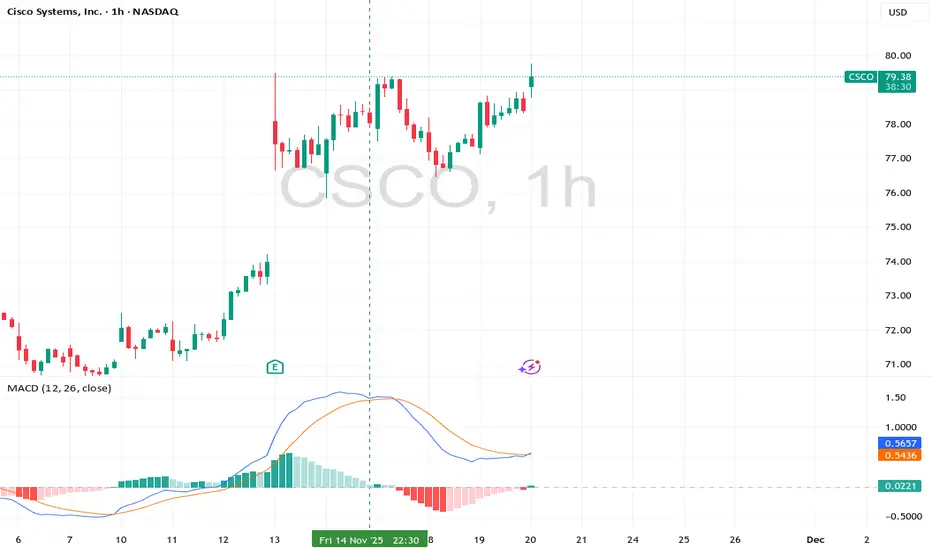
Stock Alert #2:CSCO-You only have about 20 mins to buy Right NowThis is another pullback entry
look at the MACD
i have been waiting for this entry for about 5 days.
Waiting for this entry
was not easy but here you
look at the chart the MACD on the 1h
Time frame is showing you that the entry
is nice and ripe for your trading.
Is there a reason why Thursday seems
to be a good day to trade?
Am not sure either way.
You only have about 20 mins to enter this trade
before its gone so hurry up
Below is the trading analysis i took about 5 days ago
before this pullback
read this below.
Step 1 — Interpret MACD Colors Only (Bullish Table)
Given:
• Daily: Dark Green 🟢 + Rising 3 Soldiers
• 4H: Dark Green 🟢 + Rising 3 Soldiers
• 1H: Light Green 🟢 + Inverted Hammer
From the Bullish MACD Table:
Daily
4H
1H
Interpretation
Probability
🟢 Dark Green
🟢 Dark Green
🟢 Light Green
Strong higher trend, brief 1H pause, 4H resumes uptrend
🟠 80-90%
MACD-only base probability: 80-90% (High)
Step 2 — Add Candlestick Patterns
Given Patterns:
• Daily: Rising 3 Soldiers + Dark Green MACD
• 4H: Rising 3 Soldiers + Dark Green MACD
• 1H: Inverted Hammer + Light Green MACD
From Bullish Candlestick Table:
Daily - Rising 3 Soldiers + Dark Green:
Three White Soldiers + 🟢 Daily + 🟢 4H + 🟢 1H → 95% base → 99% final
4H - Rising 3 Soldiers + Dark Green:
Same as above → 99% final
1H - Inverted Hammer + Light Green:
Inverted Hammer + 🟢 1H + 🟢 4H → 85% base → 89% final
Step 3 — Combine for Final Probability
This is an exceptionally powerful bullish setup:
Strengths:
• Strong MACD alignment: Daily & 4H Dark Green (maximum momentum), 1H Light Green (bullish)
• Two powerful bullish patterns: Rising 3 Soldiers on both Daily & 4H
(maximum confirmation)
• 1H shows early bullish signal: Inverted Hammer with Light Green MACD
• Perfect higher timeframe confluence
Final Probability:
🔥 95-98% (Very High)
Trade Insight:
This represents an extremely high-probability bullish continuation setup because:
• Daily & 4H show maximum bullish momentum with Rising 3 Soldiers (strongest pattern)
• 1H shows early bullish reversal signal (Inverted Hammer) with confirming Light Green MACD
• Perfect alignment of the strongest bullish pattern across two key timeframes
• All timeframes aligned bullish with powerful pattern confirmation
Action:
Ideal long entry - excellent for:
• Entering on break above 4H Rising 3 Soldiers high
• Using any 1H pullback as additional entry opportunity
• Placing stops below Daily Rising 3 Soldiers low
• Expecting strong upward momentum continuation
This is one of the strongest possible bullish setups with multiple high-probability confirmations across timeframes. The dual Rising 3 Soldiers pattern is exceptionally powerful.
Rocket boost this content to learn more.
Warning!! Trading is risky please use a simulation trading account before you
trade with real money
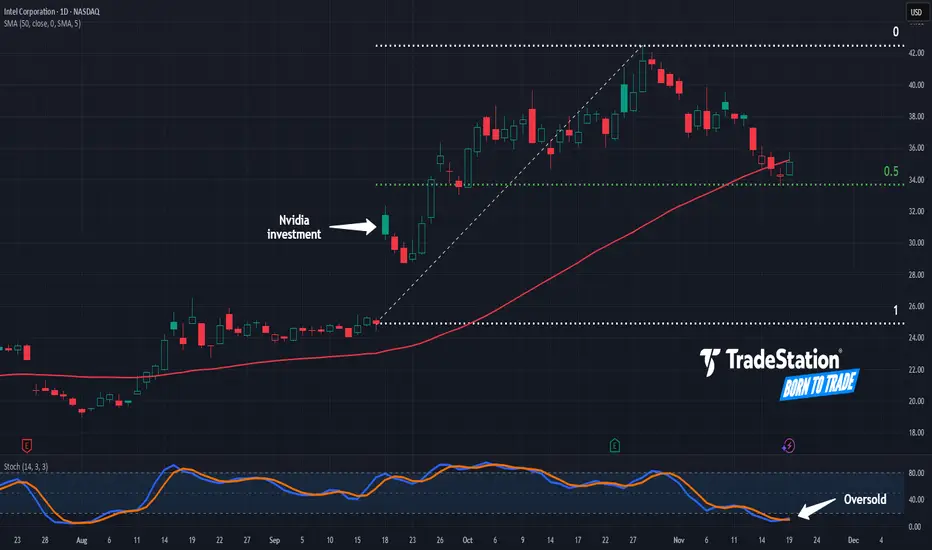
Intel Rallied and Now It’s Pulled BackIntel had a dramatic rally in recent months, and now it has pulled back.
The first pattern on today’s chart is the gap on September 18 after the chipmaker received an investment from Nvidia. INTC pulled back to hold a 50 percent retracement of that move, which may confirm its upward direction remains intact.
Second, prices are near the rising 50-day simple moving average. That may be consistent with a bullish intermediate-term trend.
Next, stochastics have dipped to an oversold condition.
Finally, INTC is an active underlier in the options market. That may help traders take positions with calls and puts.
TradeStation has, for decades, advanced the trading industry, providing access to stocks, options and futures. If you're born to trade, we could be for you. See our Overview for more.
Past performance, whether actual or indicated by historical tests of strategies, is no guarantee of future performance or success. There is a possibility that you may sustain a loss equal to or greater than your entire investment regardless of which asset class you trade (equities, options or futures); therefore, you should not invest or risk money that you cannot afford to lose. Online trading is not suitable for all investors. View the document titled Characteristics and Risks of Standardized Options at www.TradeStation.com . Before trading any asset class, customers must read the relevant risk disclosure statements on www.TradeStation.com . System access and trade placement and execution may be delayed or fail due to market volatility and volume, quote delays, system and software errors, Internet traffic, outages and other factors.
Securities and futures trading is offered to self-directed customers by TradeStation Securities, Inc., a broker-dealer registered with the Securities and Exchange Commission and a futures commission merchant licensed with the Commodity Futures Trading Commission). TradeStation Securities is a member of the Financial Industry Regulatory Authority, the National Futures Association, and a number of exchanges.
Options trading is not suitable for all investors. Your TradeStation Securities’ account application to trade options will be considered and approved or disapproved based on all relevant factors, including your trading experience. See www.TradeStation.com . Visit www.TradeStation.com for full details on the costs and fees associated with options.
Margin trading involves risks, and it is important that you fully understand those risks before trading on margin. The Margin Disclosure Statement outlines many of those risks, including that you can lose more funds than you deposit in your margin account; your brokerage firm can force the sale of securities in your account; your brokerage firm can sell your securities without contacting you; and you are not entitled to an extension of time on a margin call. Review the Margin Disclosure Statement at www.TradeStation.com .
TradeStation Securities, Inc. and TradeStation Technologies, Inc. are each wholly owned subsidiaries of TradeStation Group, Inc., both operating, and providing products and services, under the TradeStation brand and trademark. When applying for, or purchasing, accounts, subscriptions, products and services, it is important that you know which company you will be dealing with. Visit www.TradeStation.com for further important information explaining what this means.
"Rising 3 Soldiers on 4H indicates sustained buying pressure"Notice where the horizontal line is appearing?
Its at the top of the price action strength.
This is called the bull trap.
But the good thing
about silver is that
even in a bull trap
It still help up strong against the short selling
pressure..
When i took it upon my self to
take on this analysis - it was a bold move
because honestly am not sure
if my trading analysis skills
are good enough
to trade silver.
right now we are in a state
of correction
But the analysis below
is about the time
it happened before the
correction entry
that you are seeing
right now.
This correction entry showed
"strong upward continuation as Daily momentum"
This continuation appeared as a morning star
candlestick pattern.
Read my analysis for silver
below.
Thanks.
Step 1 — Interpret MACD Colors Only (Bullish Table)
Given:
• Daily: Light Green 🟢
• 4H: Dark Green 🟢 + Rising 3 Soldiers
• 1H: Dark Green 🟢
From the Bullish MACD Table:
Daily
4H
1H
Interpretation
Probability
🟢 Light Green
🟢 Dark Green
🟢 Dark Green
Daily regaining strength, intraday momentum accelerating
🟠 75-85%
MACD-only base probability: 75-85% (High)
Step 2 — Add Candlestick Pattern
Given Pattern:
• 4H: Rising 3 Soldiers + Dark Green MACD
From Bullish Candlestick Table:
4H - Rising 3 Soldiers + Dark Green:
Three White Soldiers + 🟢 4H + 🟢 1H → 95% base → 99% final
The Rising 3 Soldiers pattern on the 4H timeframe with perfect Dark Green MACD alignment on both 4H and 1H significantly boosts the probability.
Step 3 — Combine for Final Probability
This is a very strong bullish setup:
Strengths:
• Strong MACD alignment: 4H & 1H Dark Green (maximum momentum), Daily Light Green (bullish momentum building)
• Powerful bullish pattern: Rising 3 Soldiers on 4H (one of the strongest patterns)
• Lower timeframes show maximum momentum (4H & 1H Dark Green)
• Excellent confluence across all timeframes
Final Probability:
🔥 90-95% (Very High)
Trade Insight:
This represents a high-probability bullish continuation setup because:
• 4H shows maximum bullish momentum with the strongest pattern (Rising 3 Soldiers)
• 1H confirms with maximum bullish momentum (Dark Green)
• Daily shows building bullish momentum (Light Green)
• Rising 3 Soldiers on 4H indicates sustained buying pressure
• Perfect setup for upward momentum acceleration
Action:
Excellent long entry - strong setup:
• Enter on break above 4H Rising 3 Soldiers high
• Add positions on any 1H pullback
• Place stops below the 4H Rising 3 Soldiers pattern low
• Expect strong upward continuation as Daily momentum builds toward Dark Green
This is a high-confidence bullish trade with strong pattern and momentum alignment, particularly on the lower timeframes where the Rising 3 Soldiers provides exceptional bullish conviction.
Rocket boost this content to learn more.
Disclaimer:Trading is risky
please use a simulation trading account before you trade with real money and learn risk management and profit taking strategies.

How To Catch The Pullback - Part 1Forex ticker: OANDA:EURJPY OANDA:USDJPY OANDA:AUDJPY OANDA:CADJPY
Step 1 — Interpret MACD Colors Only (Bullish Table)
Given:
• 1H: Light Green 🟢
• 4H: Light Green 🟢
• Daily: Dark Green 🟢 + Rising Three Soldiers
From the Bullish MACD Table:
Daily
4H
1H
Interpretation
Probability
🟢 Dark Green
🟢 Light Green
🟢 Light Green
Daily regaining strength, intraday momentum accelerating
🟠 75-85%
MACD-only base probability: 75-85% (High)
Step 2 — Add Candlestick Pattern
Given Pattern:
• Daily: Rising Three Soldiers + Dark Green MACD
From Bullish Candlestick Table:
Daily - Rising Three Soldiers + Dark Green:
Three White Soldiers + 🟢 Daily + 🟢 4H + 🟢 1H → 95% base → 99% final
Since your 4H and 1H are Light Green (not full Dark Green), the probability
adjusts slightly but remains very high due to the strength of the Rising Three Soldiers pattern.
Step 3 — Combine for Final Probability
This is a very strong bullish setup:
Strengths:
• Strong MACD alignment: Daily Dark Green (maximum momentum), 4H & 1H Light Green (bullish momentum building)
• Powerful bullish pattern: Rising Three Soldiers on Daily (strongest pattern in your system)
• Good confluence across all timeframes
• All timeframes aligned bullish
Final Probability:
🔥 90-95% (Very High)
Trade Insight:
This represents a high-probability bullish continuation setup because:
• Daily shows maximum bullish momentum with the strongest pattern (Rising Three Soldiers)
• 4H and 1H confirm with bullish momentum (Light Green)
• Rising Three Soldiers indicates sustained buying pressure across multiple
sessions
• Perfect setup for continued upward movement
Action:
Excellent long entry - strong setup:
• Enter on any pullback toward Daily Rising Three Soldiers support
• Add positions on break above recent highs
• Place stops below the Daily Rising Three Soldiers pattern low
• Expect strong upward continuation
This is a high-confidence bullish trade with the strongest pattern (Rising Three Soldiers) aligned with solid momentum across all timeframes. The Daily pattern
provides exceptional bullish conviction that overrides the slightly weaker momentum on lower timeframes.
Rocket Boost this content to learn more
Warning! : Trading is risky please learn risk management and profit
taking strategies
also use a simulation trading account
before you trade with real money

$QQQ Strong momentum down- Watch your assetsTake profit, enter Sell mode! All risk factors in my indicator I made are showing large amounts of risk in holding long positions. Sell!
Market structure has broken down

Rising 3 Soldiers + Rocket Booster Strategy Am at a low low point right now.
Am trying to launch a business
but the banker is giving me a difficult time
My marketing skills are on point and
i understand how to collect leads
with FREE Offers.
Also am ready to build and nature my leads,
or potential
customers because i love communicating with
people.
So instead
something in my spirit
told me to apply
for a potential position
in a fast food chain
restaurant industry
as a general worker
Just incase i will need some survival income
Being humble for me is something
i dont take lightly
its very important to be humble and
plan for your next exit
This is why i don't trade any setup until
i see a candlestick
formation on atleast one time frame
Because the candlestick formation give
me a stop loss level to expect
incase the trade doesn't
go my way..
This means the stop loss is telling me
"How much are you willing to lose?"
Remember to always have a mental stop loss
this is what i Iearnt
from Tim Sykes..
have a mental stop loss
I always ignore stop losses because
i dont like risk management
But you need to master seeing the stop loss
I use candlestick patterns to see the stop loss
because i am not good with numbers
when it comes to trading..
Remember to use a simulation trading
account to practise seeing your stop loss trades
My next goal is to use Fibonacci to
see where to take profit..
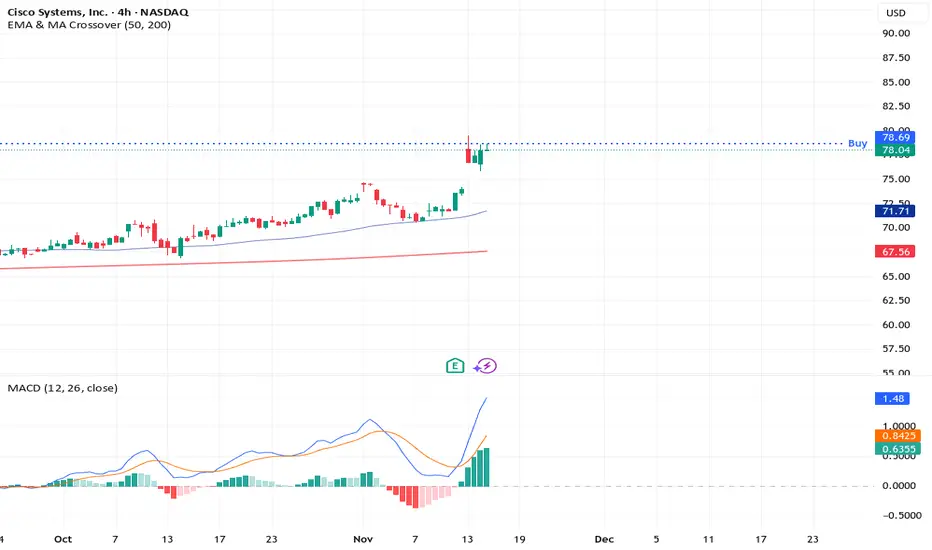
Below is the trade analysis for this stock: NASDAQ:CSCO
Read below
Enjoy!
Stock: NASDAQ:CSCO
Step 1 — Interpret MACD Colors Only (Bullish Table)
Given:
Daily: Dark Green 🟢 + Rising 3 Soldiers
4H: Dark Green 🟢 + Rising 3 Soldiers
1H: Light Green 🟢 + Inverted Hammer
From the Bullish MACD Table:
Daily 4H 1H Interpretation Probability
🟢 Dark Green 🟢 Dark Green 🟢 Light Green
Strong higher trend, brief 1H pause, 4H resumes uptrend 🟠 80-90%
MACD-only base probability: 80-90% (High)
Step 2 — Add Candlestick Patterns
Given Patterns:
Daily: Rising 3 Soldiers + Dark Green MACD
4H: Rising 3 Soldiers + Dark Green MACD
1H: Inverted Hammer + Light Green MACD
From Bullish Candlestick Table:
Daily - Rising 3 Soldiers + Dark Green:
Three White Soldiers + 🟢 Daily + 🟢 4H + 🟢 1H → 95% base → 99% final
4H - Rising 3 Soldiers + Dark Green:
Same as above → 99% final
1H - Inverted Hammer + Light Green:
Inverted Hammer + 🟢 1H + 🟢 4H → 85% base → 89% final
Step 3 — Combine for Final Probability
This is an exceptionally powerful bullish setup:
Strengths:
Strong MACD alignment: Daily & 4H Dark
Green (maximum momentum), 1H Light Green (bullish)
Two powerful bullish patterns: Rising
3 Soldiers on both Daily & 4H (maximum confirmation)
1H shows early bullish signal: Inverted
Hammer with Light Green MACD
Perfect higher timeframe confluence
Final Probability:
🔥 95-98% (Very High)
Trade Insight:
This represents an extremely high-probability
bullish continuation setup because:
Daily & 4H show maximum bullish momentum with
Rising 3 Soldiers (strongest pattern)
1H shows early bullish reversal signal (Inverted Hammer)
with confirming Light Green MACD
Perfect alignment of the strongest bullish
pattern across two key timeframes
All timeframes aligned bullish with powerful
pattern confirmation
Action:
Ideal long entry - excellent for:
Entering on break above 4H Rising 3 Soldiers high
Using any 1H pullback as additional entry opportunity
Placing stops below Daily Rising 3 Soldiers low
Expecting strong upward momentum continuation
This is one of the strongest possible bullish setups
with multiple high-probability confirmations across
timeframes. The dual Rising 3 Soldiers pattern
is exceptionally powerful.
Rocket boost this content to learn more.
Disclaimer:Trading is risky please
use a simulation trading account before you
trade with real money
Earnings,MACD,And Candlesticks-Top 3 Catalysts That Give SignalsSo in this chart NYSE:DIS we are using
👉MACD
👉Earnings Report
👉Multi-time frame
👉Candlestick Analysis
What you need know:
-
Earnings are a catalyst to price gaps also MACD shows you buying momentum.
-
Also understand candlesticks give early signals.
-
The problem is the the light green MACD histogram on the 1H chart.
-
Also another challenge will be the broker executing the buy limit order.
-
If the broker doesn't execute your limit order don't try to. Hsse the position just let it go.
Because a buying opportunity is just around the corner.
If the price goes in the opposite direction, make you reserve 50% of your capital when you enter your
Trade .For example is you have $100 only trade $50.
This is part of risk management later when you gain experience you can increase your position size.
Am using Candlesticks, MACD, and MACD histogram.
This is my trading system.
Questions 🤔
👉What are multi time frame trading strategies?
👉What makes earnings report catalysts?
👉What is the MACD Histogram?
Leave your answers below..
Disclaimer ⚠️ Trading is risky please learn about risk management and profit taking strategies.
Also feel free to use a simulation trading account before you use real money.

Disbelief Rally Time?A lot of extreme bearish exuberance, but fundamentals continue to go up on the Ethereum network: lower gas fees, record transactions, record stable coin and real-world asset volume (digital treasuries, digital gold, etc). Recipe for a disbelief rally given extreme low sentiment.
Bullish catalysts:
- Fusaka upgrade go-live
- Tariff SCOTUS reversal odds
- Government reopening
- Clarity act progress
- New record network stats
- New dovish economic reports

Top 3 Lessons From Trading Since 2017In life you have to know the following:
Learn to keep secrets.
This is very hard especially if you are a leader
i see many many influences make this mistake
Even i myself i have made
this mistake so many times.
Some topics are just to sensitive to share.
Its a sad reality that some people
don't want to know the truth
even if the truth is going to help them.
If you have a business
learn to give your employees more details
The more details you give employees
the more they can help you out.
This also applies to leadership positions.
If you are leader of a group
you have to try your best to give more
details.
Now this does not mean give them
all the details at once
it just means learn to understand
if they did not understand the first time
they did the task you
asked them to do.Be patient with
your employees they are not
perfect give them
time to digest information.
This wont be easy because some employees
dont follow instructions.
Learn to respect monetary limits.
In as much as you want to show off
like every person i know.
You have to hold back and learn to reserve your capital
This is a very powerful lesson that
you can apply
to your trading knowledge as well.
Capital reserving is part of risk management
Look at the MACD indicator on the daily chart
the histogram is Dark green
this is the highest probability of trading that you
could wish for.Of course seeing
such a trade doesn't mean you will
always find good trades
The MACD Histogram is
my favourite indicator
learn more about it
Rocket boost this content to learn more.
Trade safe.
Disclaimer: Trading is risky learn risk management and profit
taking strategies.
Please use a simulation trading account
before oyu trade with real money.

META Crashed By -12% Should You Buy It?Am so humbled because i believe
i have learned how to find
the best opportunities to trade.
But i have to tell you that these
trading ideas are not
a promise for you to make money
The reason i have to tell you this
is because the spirit of becoming a trader
comes with a lot of humility.
You will notice the "gurus"
marketing to you."How to make $$$"
this is a trap dont fall for it.
It has taken me 8 years!! to master trading
and let me tell you
am still learning
Let me tell you why am still learning
its called risk management
every time the economy is doing bad
the banks decide to increase the cost
of borrowing capital.
This means if you where used to risking
only lets say -10%
after the banks increase the price of borrowing you may
have to adjust your emotions to be ready to risk
-20% per trade. Thats the reason why
you have to be humble no matter
what you are going through.
As you begin your trading journey.
It wont be easy,
Another thing that will keep you humble
is dealing with lagging indicators.
This will mean sometimes you will
have to hold your position during consolidation
periods. or flat markets.
developing your own trading skill
will be the key to your trading journey
but learning from other traders and
not to copy them will help you as well.
am always scared to share my ideas
because i dont know if you will understand
and if you will use the proper risk management
strategies.
One time i spoke with a friend of mine
and every time i spoke to him about trading i left with
a bad feeling...this is why i dont tell
people about trading anymore.
If they ask i always try to change the topic
to business such as becoming a marketeer
on the streets or market place.
I usually say this.
"Am like a marketeer the only
difference is that am using a computer."
I dont give stock tips
or what to buy...nothing!!
i just say that
and leave them hanging in the air.
i want to protect my trading mindset
and am not going to allow
anyone inside this mind including you
the only thing i
can safely show you
is the MACD indicator its my safety net.
its not my main tool but
it shows you that the buyers are stepping.
This price action you are seeing
on this hourly chart is called the
morning star pattern.
This crash is an opportunity to buy this
stock at a discount.
Full disclosure am not participating in this
buying of NASDAQ:META
This idea is just a personal analysis of the price action.
Trade safe.
Rocket boost this content to learn more.
Disclaimer: Trading is risky please learn risk
management and profit taking strategies.
Also feel free to use a simulation trading
account before you trade with real money.

Meta Could Be OversoldMeta Platforms plunged after its last quarterly report on October 29, but some traders may think the social-media giant is oversold.
The first pattern on today’s chart is the May 23 weekly close of $627.06. Prices tested and held the level on Tuesday and Wednesday, which could make some traders think support is emerging.
Second, stochastics recently fell to its lowest level since February 2022. Wilder’s Relative Strength Index (RSI) reached its lowest level since November 2022. Those readings may suggest that oversold conditions have occurred.
Third, the stock is below its 200-day simple moving average (SMA) for the first time since May 1.
Finally, META is an active underlier in the options market. That could help traders take positions with calls and puts.
TradeStation has, for decades, advanced the trading industry, providing access to stocks, options and futures. If you're born to trade, we could be for you. See our Overview for more.
Past performance, whether actual or indicated by historical tests of strategies, is no guarantee of future performance or success. There is a possibility that you may sustain a loss equal to or greater than your entire investment regardless of which asset class you trade (equities, options or futures); therefore, you should not invest or risk money that you cannot afford to lose. Online trading is not suitable for all investors. View the document titled Characteristics and Risks of Standardized Options at www.TradeStation.com . Before trading any asset class, customers must read the relevant risk disclosure statements on www.TradeStation.com . System access and trade placement and execution may be delayed or fail due to market volatility and volume, quote delays, system and software errors, Internet traffic, outages and other factors.
Securities and futures trading is offered to self-directed customers by TradeStation Securities, Inc., a broker-dealer registered with the Securities and Exchange Commission and a futures commission merchant licensed with the Commodity Futures Trading Commission). TradeStation Securities is a member of the Financial Industry Regulatory Authority, the National Futures Association, and a number of exchanges.
Options trading is not suitable for all investors. Your TradeStation Securities’ account application to trade options will be considered and approved or disapproved based on all relevant factors, including your trading experience. See www.TradeStation.com . Visit www.TradeStation.com for full details on the costs and fees associated with options.
Margin trading involves risks, and it is important that you fully understand those risks before trading on margin. The Margin Disclosure Statement outlines many of those risks, including that you can lose more funds than you deposit in your margin account; your brokerage firm can force the sale of securities in your account; your brokerage firm can sell your securities without contacting you; and you are not entitled to an extension of time on a margin call. Review the Margin Disclosure Statement at www.TradeStation.com .
TradeStation Securities, Inc. and TradeStation Technologies, Inc. are each wholly owned subsidiaries of TradeStation Group, Inc., both operating, and providing products and services, under the TradeStation brand and trademark. When applying for, or purchasing, accounts, subscriptions, products and services, it is important that you know which company you will be dealing with. Visit www.TradeStation.com for further important information explaining what this means.

How to Trade with MACD in TradingViewMaster the MACD indicator using TradingView’s charting tools in this comprehensive tutorial from Optimus Futures.
The Moving Average Convergence Divergence (MACD) is a momentum and trend-following indicator that helps traders identify shifts in market direction and momentum strength. It measures the relationship between two exponential moving averages (EMAs) to reveal when momentum may be building or fading.
What You’ll Learn:
Understanding MACD as a tool that tracks the convergence and divergence of moving averages
How the MACD line is calculated as the difference between the 12-period and 26-period EMAs
How the Signal line acts as a 9-period EMA of the MACD line and serves as a trigger for potential buy or sell signals
How the Histogram visualizes the distance between the MACD line and Signal line to show momentum strength
Recognizing bullish and bearish crossovers between the MACD and Signal lines
How to interpret the Zero Line as a momentum baseline — above zero suggests an uptrend, below zero suggests a downtrend
Identifying bullish and bearish divergences between MACD and price to anticipate potential reversals
Why crossovers and divergences should be confirmed with price action and trend structure, not used in isolation
How to add MACD to a TradingView chart via the Indicators menu
Understanding the default settings (12, 26, 9) and how adjusting them changes responsiveness
Practical examples on the E-mini S&P 500 futures chart to illustrate MACD signals in real market conditions
Applying MACD across multiple timeframes — daily, weekly, or intraday — for higher-confidence confirmations
This tutorial will benefit futures traders, swing traders, and technical analysts who want to incorporate MACD into their trading process.
The concepts covered may help you identify trend changes, momentum shifts, and potential entry or exit points across different markets and timeframes.
Learn more about futures trading with TradingView:
optimusfutures.com
Disclaimer
There is a substantial risk of loss in futures trading. Past performance is not indicative of future results. Please trade only with risk capital. We are not responsible for any third-party links, comments, or content shared on TradingView. Any opinions, links, or messages posted by users on TradingView do not represent our views or recommendations. Please exercise your own judgment and due diligence when engaging with any external content or user commentary.
This video represents the opinion of Optimus Futures and is intended for educational purposes only.
Chart interpretations are presented solely to illustrate objective technical concepts and should not be viewed as predictive of future market behavior. In our opinion, charts are analytical tools — not forecasting instruments.

Tesla: Potential Breakout Coming?Tesla has consolidated for more than two months, and some traders may think a breakout is coming.
The first pattern on today’s chart is the $436.23 level, a previous record weekly close from December. The EV maker has fluctuated on either side of that price since late September without backing down. Is long-term resistance fading?
Second, TSLA has made higher highs and mostly higher lows since October 10. (The only exception came on October 23 following quarterly results. Even then, prices quickly recovered from the opening drop.)
Third, the 8-day exponential moving average (EMA) has stayed above the 21-day EMA. That may reflect a bullish short-term trend.
Next, Wilder’s Relative Strength Index (RSI) has moderated from above 80 while staying over 50. That may suggest an overbought condition has faded without direction turning south.
Finally, TSLA is an active underlier in the options market. (Its average volume of 2.3 million contracts per session ranks second in the S&P 500, according to TradeStation data.) That could help traders take positions with calls and puts.
TradeStation has, for decades, advanced the trading industry, providing access to stocks, options and futures. If you're born to trade, we could be for you. See our Overview for more.
Past performance, whether actual or indicated by historical tests of strategies, is no guarantee of future performance or success. There is a possibility that you may sustain a loss equal to or greater than your entire investment regardless of which asset class you trade (equities, options or futures); therefore, you should not invest or risk money that you cannot afford to lose. Online trading is not suitable for all investors. View the document titled Characteristics and Risks of Standardized Options at www.TradeStation.com . Before trading any asset class, customers must read the relevant risk disclosure statements on www.TradeStation.com . System access and trade placement and execution may be delayed or fail due to market volatility and volume, quote delays, system and software errors, Internet traffic, outages and other factors.
Securities and futures trading is offered to self-directed customers by TradeStation Securities, Inc., a broker-dealer registered with the Securities and Exchange Commission and a futures commission merchant licensed with the Commodity Futures Trading Commission). TradeStation Securities is a member of the Financial Industry Regulatory Authority, the National Futures Association, and a number of exchanges.
Options trading is not suitable for all investors. Your TradeStation Securities’ account application to trade options will be considered and approved or disapproved based on all relevant factors, including your trading experience. See www.TradeStation.com . Visit www.TradeStation.com for full details on the costs and fees associated with options.
Margin trading involves risks, and it is important that you fully understand those risks before trading on margin. The Margin Disclosure Statement outlines many of those risks, including that you can lose more funds than you deposit in your margin account; your brokerage firm can force the sale of securities in your account; your brokerage firm can sell your securities without contacting you; and you are not entitled to an extension of time on a margin call. Review the Margin Disclosure Statement at www.TradeStation.com .
TradeStation Securities, Inc. and TradeStation Technologies, Inc. are each wholly owned subsidiaries of TradeStation Group, Inc., both operating, and providing products and services, under the TradeStation brand and trademark. When applying for, or purchasing, accounts, subscriptions, products and services, it is important that you know which company you will be dealing with. Visit www.TradeStation.com for further important information explaining what this means.

All Priced In - Selling to CommenceFundamentals all baked in with price to sales ratio at previous 2021 post-covid highs will push to profit locking and selling pressure.
NASDAQ:GOOGL price target in the ~$230 range.
RSI weekly divergence and upper log line hit confluence with top fundamental ratios.

Retest 100K?I want to be bullish on Bitcoin. We have a rate cutting environment, skyrocketing sovereign US debt, potential rotation from gold into bitcoin.
But the technicals right now are ugly and bearish:
1. Right shoulder formation
2. Stochastic reversion
3. Unbroken downward channel
Recipes for another flash crash or sell off back to the unbearable 100K level IMO. Sellers are still in control regardless of the fundamental backdrop.

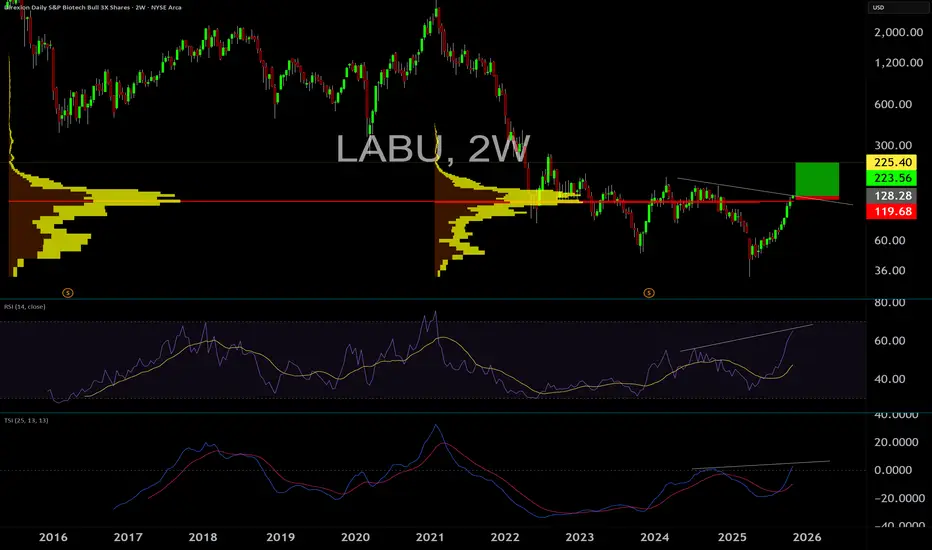
LABU breaks above long term POCLong LABU on gapping above long term POC
Bullish divergence in several indicators.
SL 50% of the gap $119.7
TP at confluence of LVN and pivot (fractal) $223
Coinbase May Be CoilingCoinbase Global has done little as the broader market climbs, but some traders may expect the cryptocurrency exchange to start moving.
The first pattern on today’s chart is the series of higher lows since early September. Those may suggest that buyers are lurking.
Second, COIN’s 50-day simple moving average (SMA) had a “golden cross” above the 200-day SMA in late June. Is the long-term trend getting bullish?
Third, the 8-day exponential moving average (EMA) just crossed back above the 21-day EMA. That may reflect an increasingly positive short-term trend.
Next, stochastics are rebounding from an oversold condition.
Finally, COIN is an active underlier in the options market. (Its average daily volume of 249,000 contracts in the last month ranks 15th in the S&P 500, according to TradeStation data.) That could help traders take positions with calls and puts.
TradeStation has, for decades, advanced the trading industry, providing access to stocks, options and futures. If you're born to trade, we could be for you. See our Overview for more.
Past performance, whether actual or indicated by historical tests of strategies, is no guarantee of future performance or success. There is a possibility that you may sustain a loss equal to or greater than your entire investment regardless of which asset class you trade (equities, options or futures); therefore, you should not invest or risk money that you cannot afford to lose. Online trading is not suitable for all investors. View the document titled Characteristics and Risks of Standardized Options at www.TradeStation.com . Before trading any asset class, customers must read the relevant risk disclosure statements on www.TradeStation.com . System access and trade placement and execution may be delayed or fail due to market volatility and volume, quote delays, system and software errors, Internet traffic, outages and other factors.
Securities and futures trading is offered to self-directed customers by TradeStation Securities, Inc., a broker-dealer registered with the Securities and Exchange Commission and a futures commission merchant licensed with the Commodity Futures Trading Commission). TradeStation Securities is a member of the Financial Industry Regulatory Authority, the National Futures Association, and a number of exchanges.
Options trading is not suitable for all investors. Your TradeStation Securities’ account application to trade options will be considered and approved or disapproved based on all relevant factors, including your trading experience. See www.TradeStation.com . Visit www.TradeStation.com for full details on the costs and fees associated with options.
Margin trading involves risks, and it is important that you fully understand those risks before trading on margin. The Margin Disclosure Statement outlines many of those risks, including that you can lose more funds than you deposit in your margin account; your brokerage firm can force the sale of securities in your account; your brokerage firm can sell your securities without contacting you; and you are not entitled to an extension of time on a margin call. Review the Margin Disclosure Statement at www.TradeStation.com .
TradeStation Securities, Inc. and TradeStation Technologies, Inc. are each wholly owned subsidiaries of TradeStation Group, Inc., both operating, and providing products and services, under the TradeStation brand and trademark. When applying for, or purchasing, accounts, subscriptions, products and services, it is important that you know which company you will be dealing with. Visit www.TradeStation.com for further important information explaining what this means.

Price Change:-0.03% + Gravestone Doji💀 Gravestone Doji.
That's the name of the candlestick pattern.
It has appeared on a downtrend.
Yesterday i was standing while a man in a car stopped he began shouting at me.
"Hey f#@#! u! - get out !! what do you do for living?"
I froze. I stayed calm.
I didn't know how to respond he offered me a drink, I refused.
Managing your emotions is important especially in trading.
The confrontation happened so fast.I only had a split second to think and control my emotions.
When I look at this chart I had to check the weekly time frame to make sure it's trending with this sell signal.
I had to confirm my sell signal.
He then asked me,
"What's wrong with this girl? She is delaying to see me ..doe she have a boyfriend?"
I told him that he communicate what he wants and how he feels she should treat him.
The conversation cooled down.
I tried to balance to make sure it didn't turn into an argument.
The rate of change indicator is an argument it's giving you a buy signal but if you change the timeframe
To a weekly chart it's giving you a sell signal.
In this story I was the weekly chart the man was a daily chart.
I corrected him with a calm response.
Trading forex on the weekend is better for my psychology because the market is closed.
When do you feel is the best time to trade during the week or weekend?
Monday entries feel more disciplined in forex trading for me.
Rocket 🚀 Boost This Content To Learn More.
Check out the
Trading Secrets Series below 👇 for a full break down of how this strategy works.
Trade safe .
Disclaimer ⚠️ Trading is risky please learn about risk management and profit taking strategies. Also feel free to use a simulation trading account before you use real money.

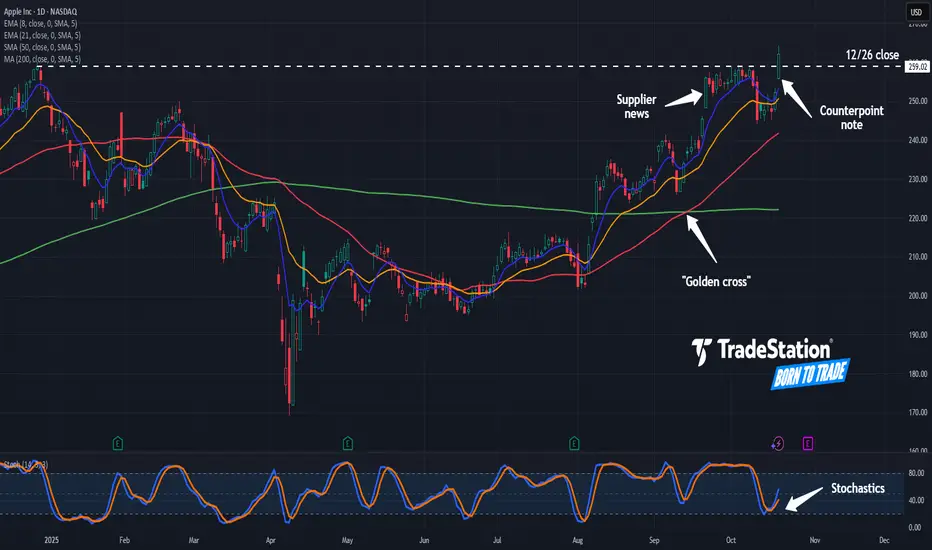
Potential Breakout in Apple Apple has been trapped as the broader Nasdaq rallies, but that might have changed yesterday.
The first pattern on today’s chart is the December 26 closing price of $259.02. AAPL paused near that level in early October but closed above it yesterday. That may be viewed as a potentially bullish breakout.
Second, the tech giant surged on September 22 after The Information reported suppliers were told to increase component production. That was the first clue of strong demand for the iPhone 17. Another report from Counterpoint Research on Monday noted strong early sales of the new handset.
Third, the 50-day simple moving average (SMA) had a bullish “golden cross” above the 200-day SMA last month. That may suggest its longer-term trend is getting more bullish.
Fourth, the 8-day exponential moving average (EMA) is above the 21-day EMA. That may reflect a bullish short-term trend.
Next, stochastics recently turned up from an oversold condition.
Finally, AAPL is a highly active underlier in the options market. (Its average daily volume of 790,000 contracts ranks fifth in the S&P 500, according to TradeStation data.) That could help traders take positions with calls and puts.
TradeStation has, for decades, advanced the trading industry, providing access to stocks, options and futures. If you're born to trade, we could be for you. See our Overview for more.
Past performance, whether actual or indicated by historical tests of strategies, is no guarantee of future performance or success. There is a possibility that you may sustain a loss equal to or greater than your entire investment regardless of which asset class you trade (equities, options or futures); therefore, you should not invest or risk money that you cannot afford to lose. Online trading is not suitable for all investors. View the document titled Characteristics and Risks of Standardized Options at www.TradeStation.com . Before trading any asset class, customers must read the relevant risk disclosure statements on www.TradeStation.com . System access and trade placement and execution may be delayed or fail due to market volatility and volume, quote delays, system and software errors, Internet traffic, outages and other factors.
Securities and futures trading is offered to self-directed customers by TradeStation Securities, Inc., a broker-dealer registered with the Securities and Exchange Commission and a futures commission merchant licensed with the Commodity Futures Trading Commission). TradeStation Securities is a member of the Financial Industry Regulatory Authority, the National Futures Association, and a number of exchanges.
Options trading is not suitable for all investors. Your TradeStation Securities’ account application to trade options will be considered and approved or disapproved based on all relevant factors, including your trading experience. See www.TradeStation.com . Visit www.TradeStation.com for full details on the costs and fees associated with options.
Margin trading involves risks, and it is important that you fully understand those risks before trading on margin. The Margin Disclosure Statement outlines many of those risks, including that you can lose more funds than you deposit in your margin account; your brokerage firm can force the sale of securities in your account; your brokerage firm can sell your securities without contacting you; and you are not entitled to an extension of time on a margin call. Review the Margin Disclosure Statement at www.TradeStation.com .
TradeStation Securities, Inc. and TradeStation Technologies, Inc. are each wholly owned subsidiaries of TradeStation Group, Inc., both operating, and providing products and services, under the TradeStation brand and trademark. When applying for, or purchasing, accounts, subscriptions, products and services, it is important that you know which company you will be dealing with. Visit www.TradeStation.com for further important information explaining what this means.
Stay Away from OKLO - For NowOKLO bearish divergence on RSI followed by a bearish candle top a few days later has played out the last time RSI was above 70. Just stay away for now... too much bull leverage on this one.

The Accumulation Before $5KAccumulation of Ethereum under $4000 by DATs will keep the trend line intact. I see a low-risk entry to climb back to ATH and test $5K while under $4K.
This is a 6hr chart showing a nice hesitant but steady bottoming seen in similar local bottoms in 2025.
Fundamentally we have the fed rate cut in late October along with the Fusaka upgrade as near-term catalysts for bullish momentum.
