Best Buy Bounces Toward GapBest Buy has rebounded from last month’s sharp drop, but some traders may expect another push to the downside.
The first pattern on today’s chart is the price zone between $67.16 and $73.28. That matches the bearish price gap on April 3, one day after hefty tariffs were announced.
The electronics retailer’s recent peak has also occurred at its trough last May, which was the low for all of 2024. Has old support become new resistance?
Next, the stochastic oscillator is turning down from an overbought condition.
Third, BBY is near its 21-day exponential moving average. Slipping below it could suggest the short-term direction is getting less bullish.
Finally, the 50-day simple moving average (SMA) had a “death cross” below the 200-day SMA in January and has remained there since. Such an alignment may be consistent with a longer-term downtrend.
TradeStation has, for decades, advanced the trading industry, providing access to stocks, options and futures. If you're born to trade, we could be for you. See our Overview for more.
Past performance, whether actual or indicated by historical tests of strategies, is no guarantee of future performance or success. There is a possibility that you may sustain a loss equal to or greater than your entire investment regardless of which asset class you trade (equities, options or futures); therefore, you should not invest or risk money that you cannot afford to lose. Online trading is not suitable for all investors. View the document titled Characteristics and Risks of Standardized Options at www.TradeStation.com . Before trading any asset class, customers must read the relevant risk disclosure statements on www.TradeStation.com . System access and trade placement and execution may be delayed or fail due to market volatility and volume, quote delays, system and software errors, Internet traffic, outages and other factors.
Securities and futures trading is offered to self-directed customers by TradeStation Securities, Inc., a broker-dealer registered with the Securities and Exchange Commission and a futures commission merchant licensed with the Commodity Futures Trading Commission). TradeStation Securities is a member of the Financial Industry Regulatory Authority, the National Futures Association, and a number of exchanges.
TradeStation Securities, Inc. and TradeStation Technologies, Inc. are each wholly owned subsidiaries of TradeStation Group, Inc., both operating, and providing products and services, under the TradeStation brand and trademark. When applying for, or purchasing, accounts, subscriptions, products and services, it is important that you know which company you will be dealing with. Visit www.TradeStation.com for further important information explaining what this means.
Centered Oscillators

Crude Oil 4h time frame , potential double bottom🛢️ WTI Crude Oil (WTI3!) 4H Chart Analysis – May 5, 2025
🧠 Technical Snapshot:
Market Structure:
Clear downtrend from late April into early May.
Price recently found support at $54.38, a level that previously held as demand in early April.
Current Price Action:
Strong bullish reaction from the $54.38–54.16 zone.
Breakout attempt forming a higher low after retesting the lows, suggesting a potential bullish reversal or range play.
Trade Setup Observed:
Entry: ~$56.08
Stop-Loss: ~$54.17
Take-Profit: ~$63.50
Risk-to-Reward: ≈ 1:3.5 — excellent setup from a reward perspective.
🔍 Bias: Bullish (Short-term to Mid-term Reversal)
Why?
Price bounced from key support zone where price also previously reversed in early April.
Bullish engulfing candle suggests buyer interest.
Entry aligned with a potential double-bottom formation.
📍 Key Technical Levels:
Support:
$54.38 (Major swing low support)
$54.16 (Stop zone)
Resistance:
$63.50 (Major horizontal resistance zone)
Above $63.50 = Potential trend reversal confirmation
🔔 Strategy Suggestion:
A pullback entry toward $55.50–$56.00 may offer a better risk-adjusted entry.
Close partial profits near $60.00 if momentum slows before final TP.

$100k Bitcoin IMMINENT? Price Ignites After Major Surge!The cryptocurrency market is once again crackling with energy, and at the heart of the storm stands Bitcoin (BTC). The world's largest and original cryptocurrency is staging a remarkable comeback, shattering recent resistance levels and reigniting fervent speculation about its potential to not only revisit but decisively conquer the psychologically potent $100,000 milestone. Following a period of consolidation and downward pressure, a powerful surge has propelled Bitcoin to its highest price point in over ten weeks, signaling a potential paradigm shift in market sentiment and trading behavior.
The Breakout: Shaking Off Recent Slumber
The recent price action has been decisive. Bitcoin climbed as much as 3.1% to achieve a weekly high of $97,483. This marks the most robust price level observed since February 21st, representing a significant break from the sideways and sometimes downward trajectory that characterized parts of the preceding weeks. The memory of Bitcoin crossing the $100,000 threshold on February 7th is still fresh, adding weight to the current push towards that level.
This upward momentum provides a stark contrast to the market conditions seen earlier. There is downward pressure attributed to geopolitical factors and economic policies, such as potential tariff implementations, which had previously triggered sell-offs impacting both traditional stock markets and the digital asset space. Furthermore, the market had to digest a significant correction following Bitcoin's earlier peak. While the specifics of past peaks can be debated based on different exchange data, the narrative of a significant pullback followed by the current strong recovery is clear. Bitcoin weathered a period where it seemed momentum might stall, but the bulls have evidently returned with renewed vigor.
Shifting Market Dynamics: From Macro-Driven to Momentum-Fueled
Perhaps one of the most crucial insights from the current rally is the apparent shift in what's driving price action. For much of the past year or two, Bitcoin's price movements often seemed heavily correlated with macroeconomic factors – inflation data releases, central bank interest rate decisions, geopolitical tensions, and regulatory pronouncements. While these factors undoubtedly still play a role, the current surge suggests a transition towards a market more heavily influenced by internal dynamics: spot market demand and trading momentum.
There are traders who are increasingly reacting to price action itself, buying into strength and potentially creating a self-reinforcing cycle. The focus is less on predicting the next Federal Reserve move and more on the immediate supply and demand dynamics visible on exchanges.
Bitcoin isn't entirely decoupled from macro trends, but its internal market structure, particularly the influence of new financial instruments like ETFs and strong spot buying, is asserting greater influence on short-to-medium term price discovery.
The ETF Factor: Opening the Floodgates for Capital
The launch and subsequent success of spot Bitcoin ETFs in the United States have been a game-changer, and their impact is arguably a primary catalyst for the current bullishness. These regulated investment vehicles provide traditional investors and institutions with a familiar and accessible way to gain exposure to Bitcoin without directly holding the underlying asset. The result has been a torrent of new capital flowing into the market.
There has been a staggering inflow of over $3.2 billion entering Bitcoin and Ethereum tracking ETFs in the preceding week alone. BlackRock's Bitcoin Trust ETF (IBIT), a major player in the space, recorded nearly $1.5 billion in inflows during that period, marking its highest weekly intake for the year according to Bloomberg data.
These inflows are not just numbers on a spreadsheet; they translate directly into buying pressure in the spot market. ETF issuers must purchase actual Bitcoin to back the shares they issue to investors. This sustained, large-scale buying provides a powerful tailwind for the price, absorbing sell orders and driving the market upwards. The success of these ETFs also lends legitimacy to Bitcoin as an asset class, potentially encouraging further adoption and investment from previously hesitant institutional players. The "demand" aspect of the current rally is heavily underpinned by this ongoing ETF phenomenon.
Options Market Signals: Betting Big on $100,000
Further evidence of the bullish sentiment surrounding Bitcoin, particularly the $100,000 target, comes from the derivatives market, specifically options trading. Options contracts give traders the right, but not the obligation, to buy (call option) or sell (put option) an asset at a specific price (strike price) before a certain expiration date.
According to data from Coinglass and the major crypto options exchange Deribit, demand for upside options has surged. Notably, call options with a $100,000 strike price exhibit the most significant open interest across various expiration dates. Open interest represents the total number of outstanding contracts that have not yet been settled. High open interest in $100k call options indicates that a large number of traders are positioning themselves to profit from Bitcoin reaching or exceeding this level. While options data reflects expectations rather than guarantees, such concentrated betting on a specific upside target underscores the powerful psychological pull of the $100k mark and the conviction held by a significant segment of the market.
Warming Up: Reading the Technical and On-Chain Pre-Rally Signals
Beyond the ETF flows and options market sentiment, analysts are pointing to various technical and on-chain indicators suggesting Bitcoin is indeed "warming up" for a potentially larger move, exhibiting signals seen before previous major breakouts. This aligns with the theme of "Bitcoin Flashing Pre-Rally Signals Seen Before Major 2024 Breakouts."
• Technical Analysis:
o Breaking Resistance: The surge above the 10-week high ($97,483) was a critical technical breakout, overcoming a level that had previously capped price advances. Holding above this level turns former resistance into potential support.
o Moving Averages: Traders watch moving averages closely. A "Golden Cross" (where a shorter-term moving average, like the 50-day, crosses above a longer-term one, like the 200-day) is often considered a strong long-term bullish signal. While specific configurations vary, bullish alignment of key moving averages often precedes sustained rallies.
o Momentum Indicators: Indicators like the Relative Strength Index (RSI) and Moving Average Convergence Divergence (MACD) can signal building momentum. An RSI breaking above key levels without yet reaching extremely overbought territory, or a bullish MACD crossover, can suggest further upside potential.
o Volume Confirmation: Crucially, significant price breakouts should ideally be accompanied by strong trading volume, indicating conviction behind the move. Analysts look for volume confirmation to validate the strength of the rally.
• On-Chain Analysis: On-chain data provides insights into the behavior of Bitcoin holders and network activity.
o Exchange Outflows: Sustained periods where more Bitcoin is withdrawn from exchanges than deposited often suggest investors are moving coins to private wallets for long-term holding ("HODLing"), reducing the immediately available supply for sale.
o Accumulation Trends: Metrics tracking the behavior of large holders ("whales") and long-term holders can reveal accumulation patterns. Increased buying from these cohorts is typically seen as bullish.
o Supply Dynamics: Indicators looking at the supply held by short-term versus long-term holders, or metrics like the Long-Term Holder Spent Output Profit Ratio (LTH-SOPR), can gauge whether significant profit-taking is occurring that could stall a rally. A low LTH-SOPR might suggest long-term holders are not yet selling aggressively.
o Funding Rates: In the perpetual futures market, positive funding rates generally indicate that traders holding long positions are paying those holding short positions, suggesting a bullish bias in the derivatives space.
When multiple technical and on-chain indicators align, as some analysts suggest is happening now, it builds a stronger case that the market is preparing for a significant move, lending credence to the "pre-rally signals" narrative.
Mapping the Path to $100k and Beyond: Three Potential Scenarios
While the current momentum is palpable, the path forward is never certain. Analysts are mapping various possibilities, acknowledging both the bullish potential and the inherent risks. Here are three broad scenarios that could unfold:
1. The Momentum Continuation Scenario: Fueled by continued strong ETF inflows, positive market sentiment amplified by the $100k narrative, and potentially favorable (or at least neutral) macroeconomic developments, Bitcoin continues its ascent relatively unimpeded. It decisively breaks the $100,000 barrier, potentially triggering a wave of Fear Of Missing Out (FOMO) from retail investors and further institutional interest. In this scenario, the market quickly looks towards higher targets, exploring price discovery in uncharted territory above $100k (or above its previous ATH depending on the data source used). Key challenges would be maintaining buying pressure and overcoming psychological resistance levels beyond $100k.
2. The Consolidation and Recharge Scenario: Bitcoin's rally meets significant resistance near or just below the $100,000 level. Profit-taking increases, and early ETF buyers might look to secure gains. Instead of a sharp rejection, the price enters a period of consolidation – trading sideways within a defined range or experiencing a moderate pullback. This phase allows the market to digest recent gains, build a stronger base of support (potentially around the recent breakout level near GETTEX:97K or slightly lower), and allows moving averages to catch up. If support holds and buying demand re-emerges (perhaps triggered by fresh ETF inflows or positive news), this consolidation could form the launchpad for the next sustained leg up towards and beyond $100k. This scenario tests the resilience of the buyers.
3. The Macro Headwind or Correction Scenario: Despite the strong internal dynamics, external factors reassert control. An unexpected negative catalyst emerges – perhaps significantly worse-than-expected inflation data forcing a hawkish central bank response, a major geopolitical escalation, unforeseen regulatory action against crypto, or a sharp downturn in traditional markets triggering widespread risk-off sentiment. Alternatively, the rally could simply run out of steam, hitting a "sell wall" at $100k that overwhelms buying pressure, leading to a sharper correction back towards lower support levels ($90k, $85k, or even lower). This scenario underscores the ever-present volatility and risk in the crypto market, reminding investors that parabolic runs can face abrupt reversals.
The Crucial Question: Can BTC Buying Demand Meet the Challenge?
Ultimately, whether Bitcoin successfully retests and surpasses $100,000 hinges on the sustainability of the current buying demand. Several factors support continued demand:
• Ongoing ETF Flows: As long as institutions and retail investors continue allocating capital to spot Bitcoin ETFs, this provides a consistent source of buying pressure.
• Growing Adoption Narrative: Each price surge and new institutional product launch reinforces the narrative of Bitcoin's growing acceptance and potential role as a store of value or portfolio diversifier.
• Halving Effect (Long-Term): While the Bitcoin Halving (reduction in new supply issuance) is a past event, its long-term supply-constricting effects are believed by many to contribute to price appreciation over time.
• Potential Retail FOMO: A decisive break above $100k could capture mainstream media attention and trigger a wave of buying from retail investors fearing they might miss out on further gains.
However, potential headwinds exist:
• Profit-Taking: Investors who bought at lower levels, including early ETF participants, may look to lock in substantial profits as the price approaches major milestones.
• Regulatory Uncertainty: While ETFs marked progress, the broader regulatory landscape for crypto remains complex and subject to change globally.
• Macroeconomic Risks: Inflation, interest rates, and potential recessionary fears haven't disappeared and could resurface to dampen risk appetite.
• Market Saturation/Exhaustion: Rallies can lose momentum if buying power becomes exhausted without fresh catalysts.
The interplay between these forces will determine if the current buying wave has the strength and endurance to overcome sell pressure and propel Bitcoin into six-figure territory sustainably.
Conclusion: A Critical Juncture for Bitcoin
Bitcoin stands at a fascinating and potentially pivotal juncture. The recent surge, breaking a 10-week high and pushing towards the $100,000 horizon, is fueled by a powerful combination of factors unlike those seen in previous cycles. The institutional validation and massive capital inflows brought by spot Bitcoin ETFs represent a fundamental shift, seemingly driving a transition towards momentum and spot-demand-based trading. Bullish signals from the options market and various technical/on-chain indicators add fuel to the fire, painting a picture of a market "warming up" for potentially significant further gains.
Yet, the path to $100,000 and beyond is fraught with challenges. Market history teaches that parabolic advances often face corrections, and the ever-present risks of macroeconomic shifts and regulatory developments cannot be ignored. The sustainability of the current buying frenzy, particularly the crucial ETF inflows, will be rigorously tested as Bitcoin confronts the immense psychological and technical resistance clustered around the six-figure mark.
Whether Bitcoin achieves a swift breakout, undergoes a period of consolidation, or faces a pullback remains to be seen. However, the current price action and underlying market dynamics have undeniably reignited excitement and placed the $100,000 target firmly back in the spotlight, marking a critical chapter in Bitcoin's ongoing evolution within the global financial ecosystem. Investors and observers alike will be watching intently to see if the current surge has the power to meet the demand challenge and etch a new all-time high into the history books.
Disclaimer: The information presented in this article is for informational and educational purposes only. It is based on the analysis of the provided source material and general market knowledge. It does not constitute financial advice. Investing in cryptocurrencies involves significant risk, including the potential loss of principal. Readers should conduct their own thorough research and consult with a qualified financial advisor before making any investment decisions.

Is Seagate Overbought?Seagate Technology has rallied sharply in recent weeks, but some traders may think the data-storage company is overbought.
The first pattern on today’s chart is the March low of $82.88. STX plunged three sessions later after tariffs were announced. Prices have returned to that level and now seem to be stalling. Has old support become new resistance?
Next, stochastics have reached an overbought condition.
Third, the 50-day simple moving average (SMA) had a “death cross” below the 200-day SMA in December. It’s stayed below that slower line since, which may suggest its longer-term trend has gotten more bearish.
TradeStation has, for decades, advanced the trading industry, providing access to stocks, options and futures. If you're born to trade, we could be for you. See our Overview for more.
Past performance, whether actual or indicated by historical tests of strategies, is no guarantee of future performance or success. There is a possibility that you may sustain a loss equal to or greater than your entire investment regardless of which asset class you trade (equities, options or futures); therefore, you should not invest or risk money that you cannot afford to lose. Online trading is not suitable for all investors. View the document titled Characteristics and Risks of Standardized Options at www.TradeStation.com . Before trading any asset class, customers must read the relevant risk disclosure statements on www.TradeStation.com . System access and trade placement and execution may be delayed or fail due to market volatility and volume, quote delays, system and software errors, Internet traffic, outages and other factors.
Securities and futures trading is offered to self-directed customers by TradeStation Securities, Inc., a broker-dealer registered with the Securities and Exchange Commission and a futures commission merchant licensed with the Commodity Futures Trading Commission). TradeStation Securities is a member of the Financial Industry Regulatory Authority, the National Futures Association, and a number of exchanges.
TradeStation Securities, Inc. and TradeStation Technologies, Inc. are each wholly owned subsidiaries of TradeStation Group, Inc., both operating, and providing products and services, under the TradeStation brand and trademark. When applying for, or purchasing, accounts, subscriptions, products and services, it is important that you know which company you will be dealing with. Visit www.TradeStation.com for further important information explaining what this means.

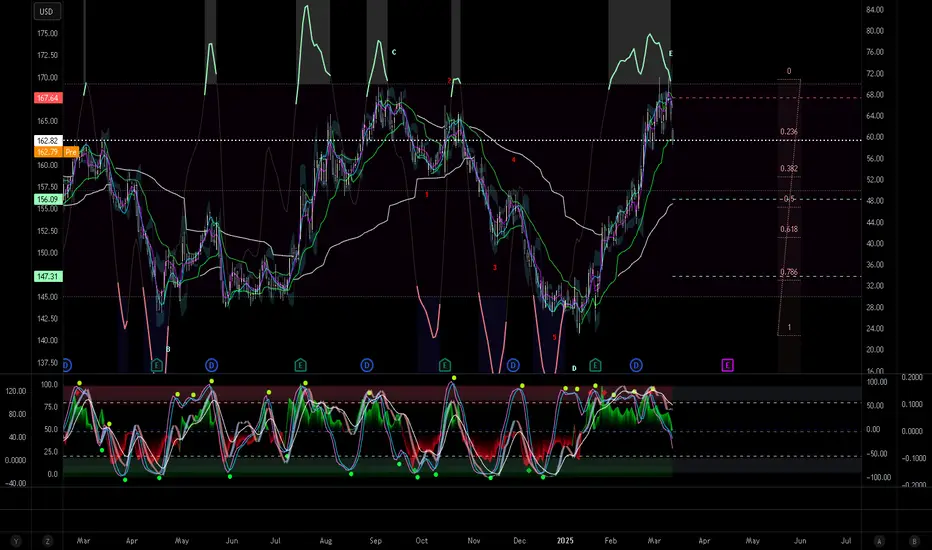
Johnson and Johnson Falling Off a Cliff. JNJA much larger ABCDE formation is complete, not pivoting back to gravity. There is confirmation with MIDAS cross of price action with supporting of RSX exiting OBOS area and VZO/Stoch duo being bearish divergent for some time now. The incoming stream could be a tumultous C Wave impulse to the bears, if Elliott is to be believed.
MACD^3LOOKS GOOD. The graphing indicator looks good based on the fascinating relationship to where the whereabouts of the price remains inline with the outward pressure all around the world; I better get going then why don't I.

Industrial ETF May Face ResistanceThe SPDR Select Sector Industrial ETF dropped in early April, and some traders may expect another push to the downside.
The first pattern on today’s chart is the March 13 low of $128.26. XLI peaked $0.44 under that level this month, which may suggest old support has become new resistance.
Second, the 50-day simple moving average (SMA) recently had a “death cross” below its 200-day SMA. That may suggest the long-term trend has gotten more bearish.
Third, the stochastics oscillator’s leading line crossed under the smoothing signal line.
Fourth, the 8-day exponential moving average (EMA) has remained under the 21-day EMA.
Finally, XLI hit a 52-weeek low of $112.75 on April 7. Is a retest of that support needed?
Standardized Performances for the ETF mentioned above:
SPDR Select Sector Industrial ETF (XLI)
1-year: +4.06%
5-years: +122.11%
10-year: +135.02%
(As of March 31, 2025)
Exchange Traded Funds ("ETFs") are subject to management fees and other expenses. Before making investment decisions, investors should carefully read information found in the prospectus or summary prospectus, if available, including investment objectives, risks, charges, and expenses. Click here to find the prospectus.
TradeStation has, for decades, advanced the trading industry, providing access to stocks, options and futures. If you're born to trade, we could be for you. See our Overview for more.
Past performance, whether actual or indicated by historical tests of strategies, is no guarantee of future performance or success. There is a possibility that you may sustain a loss equal to or greater than your entire investment regardless of which asset class you trade (equities, options or futures); therefore, you should not invest or risk money that you cannot afford to lose. Online trading is not suitable for all investors. View the document titled Characteristics and Risks of Standardized Options at www.TradeStation.com . Before trading any asset class, customers must read the relevant risk disclosure statements on www.TradeStation.com . System access and trade placement and execution may be delayed or fail due to market volatility and volume, quote delays, system and software errors, Internet traffic, outages and other factors.
Securities and futures trading is offered to self-directed customers by TradeStation Securities, Inc., a broker-dealer registered with the Securities and Exchange Commission and a futures commission merchant licensed with the Commodity Futures Trading Commission). TradeStation Securities is a member of the Financial Industry Regulatory Authority, the National Futures Association, and a number of exchanges.
TradeStation Securities, Inc. and TradeStation Technologies, Inc. are each wholly owned subsidiaries of TradeStation Group, Inc., both operating, and providing products and services, under the TradeStation brand and trademark. When applying for, or purchasing, accounts, subscriptions, products and services, it is important that you know which company you will be dealing with. Visit www.TradeStation.com for further important information explaining what this means.

BTC.D Bitcoin Dominance!Are you ready for a big Altcoin rally? We are facing an Altcoin Season that may not last long. Load Your Bullets!

XRP: Fresh Gains Ahead? Bullish Setup Intensifies.XRP Price Poised for Potential Breakout? Bulls Eye Fresh Gains Amid Bullish Setup as Open Interest Surges
The cryptocurrency market is a relentless arena of volatility, sentiment shifts, and technical battles. Among the major digital assets, XRP, the native token of the XRP Ledger, often finds itself at the center of intense debate and speculation, largely due to its unique position, technological proposition, and the long-standing regulatory shadow cast by the Ripple vs. SEC lawsuit in the United States. Recently, however, a confluence of factors has ignited discussions about XRP's potential for a significant upward move. With the price consolidating and holding firm above the psychologically crucial $2 mark, coupled with a notable surge in derivatives' open interest, bullish traders are keenly watching for signs that XRP might be coiling up for its next major run.
The Significance of the $2 Threshold: A Psychological and Technical Battleground
Price levels ending in round numbers often act as powerful psychological magnets in financial markets, and $2 is no exception for XRP. Crossing and holding above such a level can signal a significant shift in market sentiment, transforming previous resistance into potential support. For XRP, reclaiming and maintaining ground above $2 carries several implications:
1. Psychological Boost: A sustained presence above $2 instills confidence among existing holders and can attract new buyers who perceive it as a validation of strength. It breaks a mental barrier that may have previously deterred accumulation.
2. Technical Support: Historically significant price levels often become areas where buying interest clusters. If XRP consistently finds buyers stepping in around the $2 mark, it establishes this zone as a credible technical support level. A strong support base is crucial for launching further upside attempts, as it provides a foundation from which bulls can stage rallies.
3. Confirmation of Strength: In technical analysis, breaking above a major resistance level (which $2 may have been previously) and then successfully defending it as support (a "resistance-support flip") is considered a strong bullish signal. It suggests that the underlying demand is robust enough to absorb selling pressure at that level.
The current price action, characterized by XRP holding above $2 despite broader market fluctuations, is therefore a key factor fueling bullish optimism. It suggests resilience and a potential accumulation phase where buyers are absorbing supply, potentially setting the stage for the next leg higher. However, a decisive break below this level could conversely signal weakness and potentially trigger further downside.
Decoding the Bullish Technical Setup: Chart Patterns and Indicators Aligning?
Beyond the $2 level itself, chart patterns and technical indicators are providing further clues that bulls are closely monitoring. While specific patterns evolve rapidly, several common bullish setups could be in play or forming:
1. Consolidation Patterns: Often, before a significant price move (either up or down), an asset enters a period of consolidation. This can take the form of patterns like:
o Ascending Triangles: Characterized by a horizontal resistance line and a rising trendline of support (higher lows). A breakout above the horizontal resistance is typically considered a bullish continuation signal.
o Bull Flags or Pennants: These are short-term continuation patterns that form after a sharp price increase (the "flagpole"). They represent a brief pause before the trend potentially resumes. A breakout above the flag/pennant's upper boundary signals a likely continuation of the prior uptrend.
o Range Consolidation: Price trading sideways between defined support and resistance levels. A decisive break above the range resistance, especially on high volume, can signal the start of a new uptrend.
2. Moving Averages: Key moving averages (MAs) like the 50-day and 200-day simple moving averages (SMAs) are widely watched indicators of medium and long-term trends.
o Golden Cross: A bullish signal occurs when the shorter-term MA (e.g., 50-day SMA) crosses above the longer-term MA (e.g., 200-day SMA). This indicates that short-term momentum is strengthening relative to the long-term trend.
o Price Above Key MAs: XRP trading consistently above both the 50-day and 200-day MAs is generally viewed as a sign of a healthy uptrend. These MAs can also act as dynamic support levels during pullbacks.
3. Momentum Indicators:
o Relative Strength Index (RSI): This indicator measures the speed and change of price movements. An RSI reading above 50 suggests that bullish momentum is dominant, while readings above 70 indicate potentially overbought conditions (though an asset can remain overbought during strong uptrends). A sustained RSI above 50, possibly bouncing off this level during dips, supports a bullish outlook.
o Moving Average Convergence Divergence (MACD): This trend-following momentum indicator shows the relationship between two exponential moving averages (EMAs). A bullish signal occurs when the MACD line crosses above the signal line, especially if this happens above the zero line.
o
If multiple technical indicators and patterns align – for instance, XRP holding above $2, breaking out of a consolidation pattern, trading above key MAs, and showing strong momentum on the RSI and MACD – the case for a potential run becomes significantly stronger.
Open Interest Surges: Fueling the Fire or Adding Risk?
A particularly noteworthy development often accompanying potential price breakouts is a surge in Open Interest (OI) in the derivatives market (futures and perpetual swaps). Open Interest represents the total number of outstanding derivative contracts that have not been settled. It essentially measures the total amount of capital committed to that market.
• Rising OI + Rising Price: This is generally considered a bullish sign. It suggests that new money is flowing into the market, primarily opening long positions, reflecting increasing conviction among buyers that the price will continue to rise. The new longs add buying pressure and fuel the uptrend.
• Rising OI + Falling Price: This is typically bearish, indicating new money is entering to open short positions, betting on further price declines.
• Falling OI + Rising Price: This might suggest that the rally is driven by short-covering (short sellers buying back to close their positions) rather than new buying interest, potentially making the rally less sustainable.
• Falling OI + Falling Price: This often indicates that traders are losing conviction and closing out existing long positions, potentially signaling the end of a downtrend but not necessarily the start of an uptrend.
The reported surge in XRP's Open Interest while the price holds above $2 aligns with the bullish interpretation (Rising OI + Stable/Rising Price). It implies that traders are increasingly betting on upside continuation, adding capital to back their bullish theses.
However, high Open Interest also introduces risks. A large number of leveraged long positions makes the market vulnerable to a "long squeeze." If the price unexpectedly drops (perhaps due to negative news or a broader market downturn), it can trigger cascading liquidations of these leveraged longs. This forced selling adds intense downward pressure, potentially leading to a sharp price crash. Therefore, while rising OI can confirm bullish sentiment, it also amplifies potential volatility in both directions.
Fundamental Factors: The Ever-Present Shadow of the SEC Lawsuit and XRPL Developments
No analysis of XRP is complete without considering the fundamental factors, dominated by the ongoing legal battle between Ripple Labs and the U.S. Securities and Exchange Commission (SEC). The lawsuit, initiated in December 2020, alleges that Ripple conducted an unregistered securities offering through its sales of XRP.
• The SEC Lawsuit: This remains the single most significant factor influencing XRP's price potential, particularly concerning US-based investors and exchanges.
o Positive Outcome/Settlement: A favorable ruling for Ripple, a clear settlement defining XRP as not being a security, or favorable legislation clarifying the status of digital assets could remove a massive cloud of uncertainty. This would likely lead to relistings on US exchanges and potentially trigger a substantial price rally, potentially decoupling XRP somewhat from the broader market trend.
o Negative Outcome: A ruling deeming XRP a security could have severe negative consequences, potentially limiting its utility, hindering adoption (especially in the US), and causing a significant price decline.
o Ongoing Uncertainty: As long as the case drags on, it acts as a headwind, potentially suppressing XRP's price relative to other cryptocurrencies that don't face similar regulatory challenges. Positive developments or perceived wins for Ripple during the legal proceedings often cause short-term price spikes.
• XRP Ledger (XRPL) Developments and Adoption: Beyond the lawsuit, the underlying technology and its adoption matter.
o On-Demand Liquidity (ODL): Ripple's primary use case for XRP, facilitating low-cost, instant cross-border payments, continues to see adoption, primarily outside the US. Growth in ODL volume signifies real-world utility.
o Central Bank Digital Currencies (CBDCs): Ripple is actively engaging with central banks globally, exploring how the XRPL could potentially support CBDC initiatives. Success in this area could significantly boost the ledger's profile and potentially XRP's utility.
o Other Use Cases: Developments around NFTs, decentralized finance (DeFi), and smart contracts on the XRPL, while perhaps less mature than on other blockchains, contribute to the ecosystem's overall value proposition.
Will Buyers Push XRP Further? Potential Targets and Risks
Given the confluence of factors – holding the $2 support, potentially bullish technical setups, and rising open interest – the question remains: can buyers sustain the momentum and push XRP significantly higher?
• Potential Upside Targets: If the bullish scenario plays out and XRP breaks decisively upwards, potential resistance levels and targets could include:
o Recent swing highs (e.g., $2.20, $2.50, depending on recent price action).
o Psychologically important levels ($2.50, $3.00).
o Fibonacci extension levels based on previous price swings.
o The previous all-time high (around $3.40 - $3.84 depending on the exchange data).
• Key Risks: Despite the bullish signals, significant risks persist:
o SEC Lawsuit: Any negative news or ruling remains the primary threat.
o Market-Wide Correction: A downturn in Bitcoin or the broader crypto market could easily drag XRP down, regardless of its individual setup.
o Failure at Resistance: If XRP attempts to rally but fails to break through key overhead resistance levels, it could lead to a reversal.
o Breakdown Below Support: A decisive drop below the $2 support level would invalidate the immediate bullish thesis and could open the door to lower targets (e.g., $1.80, $1.50, or key moving averages).
o OI Liquidation Cascade: As mentioned, high open interest could fuel a sharp sell-off if sentiment sours.
Conclusion: Cautious Optimism Warranted
The current situation for XRP presents a compelling, albeit complex, picture. The ability to hold the crucial $2 support level is a significant show of resilience. Combined with potentially forming bullish technical patterns and a notable surge in open interest suggesting fresh capital inflow and conviction, the ingredients for a potential price run appear to be gathering. Bulls are rightly eyeing fresh gains, encouraged by these developments.
However, caution remains paramount. The cryptocurrency market is inherently volatile, and XRP carries the unique and substantial burden of the SEC lawsuit's uncertainty. While technicals and derivatives data might point towards bullish potential in the near term, fundamental risks and the ever-present possibility of market-wide corrections cannot be ignored. A breakdown below $2 support or negative news from the legal front could quickly invalidate the bullish outlook.
Traders and investors considering XRP must weigh the potentially explosive upside against these considerable risks. Monitoring the $2 level, key resistance zones, developments in the SEC case, and overall market sentiment will be crucial in navigating XRP's next potential move. While the setup looks promising for the bulls, confirmation through decisive price action and continued positive momentum is needed before declaring that XRP is definitively "ready to run."
Disclaimer: This article is for informational purposes only and should not be considered financial advice. Trading cryptocurrencies involves significant risk, and you could lose your entire investment. Always conduct your own thorough research and consult with a qualified financial advisor before making any investment decisions.

CrowdStrike: Member of a Small ClubThe broader market has been tumbling for months, but CrowdStrike has stood its ground.
The first pattern on today’s chart is the March 10 low of $303.79. While the Nasdaq-100 has revisited levels from over a year ago, CRWD has held lows from a month prior. Support at such a recent level may reflect positive sentiment.
Second, Wilder’s Relative Strength Index (RSI) made a higher low as the cybersecurity company made a slightly lower low. That positive divergence could also be viewed as a bullish signal.
Third, the 50-day simple moving average (SMA) had a “golden cross” above the 200-day SMA in November and has stayed there since. Is a longer-term uptrend still in effect?
Speaking of SMAs, CRWD is above its 20- and 200-day SMAs. That puts it in relatively elite clubs: Only 104 members of the S&P 500 are above their 20-day SMAs and just 138 are above their 200-day SMAs, according to TradeStation data.
Those points may also suggest sellers have been less active in the name.
TradeStation has, for decades, advanced the trading industry, providing access to stocks, options and futures. If you're born to trade, we could be for you. See our Overview for more.
Past performance, whether actual or indicated by historical tests of strategies, is no guarantee of future performance or success. There is a possibility that you may sustain a loss equal to or greater than your entire investment regardless of which asset class you trade (equities, options or futures); therefore, you should not invest or risk money that you cannot afford to lose. Online trading is not suitable for all investors. View the document titled Characteristics and Risks of Standardized Options at www.TradeStation.com . Before trading any asset class, customers must read the relevant risk disclosure statements on www.TradeStation.com . System access and trade placement and execution may be delayed or fail due to market volatility and volume, quote delays, system and software errors, Internet traffic, outages and other factors.
Securities and futures trading is offered to self-directed customers by TradeStation Securities, Inc., a broker-dealer registered with the Securities and Exchange Commission and a futures commission merchant licensed with the Commodity Futures Trading Commission). TradeStation Securities is a member of the Financial Industry Regulatory Authority, the National Futures Association, and a number of exchanges.
TradeStation Securities, Inc. and TradeStation Technologies, Inc. are each wholly owned subsidiaries of TradeStation Group, Inc., both operating, and providing products and services, under the TradeStation brand and trademark. When applying for, or purchasing, accounts, subscriptions, products and services, it is important that you know which company you will be dealing with. Visit www.TradeStation.com for further important information explaining what this means.

Gold to print historic 30% correction?On the above 2 week chart Gold price action has completed the much anticipated Cup and Handle forecast to $2700, which was where Without Worries dabbled with a “short” position and was promptly stopped out much to the bugs delight.
Price action has rallied 180% since the 2016 lows, amazing. The increased Money supply / Money printing is the reason I’m often given for this historic rally. The facts are the money supply has increased 68% since the 2016 lows and not 180%, which would price an ounce at $1750 today. Now I know someone will be quick to comment my being selective with dates. To that end we can go back further, 18 years since that fits over the well understood business cycle, which is approaching its peak. Since 2007 money supply has increased 195% with Gold price action 400%. This is a bubble.
This idea is not about fundamentals however, it is technical only.
1) Price action is in bubble territory. Look left, 50% above the 5 week Gaussian channel saw corrections of at least 30%.
2) Price action on the 2 week chart prints the strongest negative divergence since the positive divergence in December 2013 at 1190 an ounce.
3) The $2000 support breakout has never confirmed support.
4) On the weekly chart a bearish engulfing candle prints as price action enters the Bollinger Band. A correction to 2730 is now highly probable.
Is it possible price action continues up? Sure.
Is it probable? No.
Ww
5 week Gaussian channel
Weekly bearish engulfing

SPY Analysis & Tariff TurmoilLast Friday, the market pressure was intense, and my bullish call option, targeting $537.64 on SPY, seemed overly ambitious as tariffs and political uncertainties peaked. I stated, " AMEX:SPY Trump went all in thinking he had the cards. We were getting sent back to the McKinley era," wondering when or if Trump would fold under international pressure and market realities.
Fast-forward to Wednesday, April 8—Trump didn't just blink; he folded utterly, reversing the harsh tariff policies he initially defended aggressively. Prompted by China's aggressively dumping of U.S. Treasuries and stark recession warnings from Goldman Sachs, BlackRock, and JPMorgan, Trump pivoted significantly:
• Base tariffs: 10%
• Tariffs on China: Increased to 125%
• Tariffs on U.S. goods entering China: Increased to 84% starting April 10
While temporarily bullish, these sudden, dramatic policy swings underline ongoing instability and volatility. However, with big bank earnings on deck this Friday, short-term momentum looks positive.
Technical Levels & Trade Ideas
Hourly Chart
The hourly chart reveals a critical zone—dubbed "Liberation Day Trapped Longs"—between $544.37 (H. Vol Sell Target 1b) and $560.54 (L. Vol ST 2b). Bulls trapped here from recent highs may now look to exit on a relief rally.
• Bullish Scenario:
• Entry: SPY reclaiming and holding above $544.37.
• Target 1: $560.54 (top of trapped longs)
• Target 2: $566.54 (next resistance area)
• Stop Loss: Below recent lows near $535 to limit downside.
• Bearish Scenario (if tariffs intensify again or earnings disappoint):
• Entry: Breakdown confirmation below $535.
• Target 1: $522.20 (Weeks Low Long)
• Target 2: $510.00, potential further support
• Stop Loss: Above $544.50 to manage risk effectively.
Daily Chart Perspective
The broader daily chart shows SPY stabilizing around key lower supports after significant volatility. Recent price action suggests cautious optimism for an upward bounce, but considerable headwinds remain if tariff escalations resume.
Final Thoughts
The rapid tariff reversals and heightened volatility are unsettling. The short-term bullish move offers potential quick upside trades into earnings, but caution remains paramount. You can continue managing risks prudently and watch closely for political or economic headlines that could quickly shift market sentiment again.

What Is The #1 Candlestick Pattern?When I decide to help the Trading community I think about which market news gets the most "organic" likes I noticed it was the Dow Jones industrial Average (US30).
Because of this i decided to help you trade them now my expertise is in buying Bitcoin,Gold & Silver.
So learning to trade stock options was going to be a challenge.
I decided to learn 3 things:
#1-So I started by learning about the "3 Step-Rocket Booster Strategy"
#2 -Then I learned about the Candlestick Patterns
#3 -Then I learned about how to use oscillators
--
What Is The Rocket Booster Strategy?
--
This is a strategy used in trend analysis it has 3 Steps
--
1)The price has to be above the 50 EMA
2)The price has to be above the 200 EMA
3)The price has to Gap up
Remember the last step is very important because that step is what you need in order to execute the best candlestick pattern
-
What Is The #1 Candlestick Pattern?
-
They are alot of candlestick patterns and you have to choose your favorite in this case I chose to use the "long lower shadow"
If you want to learn more about candlestick patterns read Steve Nissan's Book about Japanese Candlestick Patterns
-
What is The Best Oscillator ?
-
Now the most common one is called MACD.
But I prefer to use Bull Power
Because this is the oscillator I first used when I was learning about forex trading and lost when I didn't understand how to use it.
Now thanks to the new TradingView Screener I have been able to use in stock options trading.
I will try to make a video tomorrow demonstrating how to trade stock options on US 30 Dow Jones Industrial Average
As today I was so exhausted from a very long walk and day from yesterday.
Stay tuned for a video demo tomorrow
Rocket boost this content to learn more
Disclaimer ⚠️ Trading is risky please learn risk management and profit taking strategies and feel free to use a simulation trading account before you use real money.
Reddit Has Pulled BackReddit hit a record high early last month. Will some traders see an opportunity in the current pullback?
The first pattern on today’s chart is the bullish gap on October 30 after earnings beat estimates. RDDT approached the low of that session on March 10 and again last week. It bounced both times. That apparent double bottom may suggest new support has been established.
Next, the rebounds occurred around the 200-day simple moving average. Holding that line may suggest an uptrend is in place.
Finally, stochastics have turned up from an oversold condition. The stock also closed above its 8-day exponential moving average. Those patterns are potentially consistent with prices bottoming.
TradeStation has, for decades, advanced the trading industry, providing access to stocks, options and futures. If you're born to trade, we could be for you. See our Overview for more.
Past performance, whether actual or indicated by historical tests of strategies, is no guarantee of future performance or success. There is a possibility that you may sustain a loss equal to or greater than your entire investment regardless of which asset class you trade (equities, options or futures); therefore, you should not invest or risk money that you cannot afford to lose. Online trading is not suitable for all investors. View the document titled Characteristics and Risks of Standardized Options at www.TradeStation.com . Before trading any asset class, customers must read the relevant risk disclosure statements on www.TradeStation.com . System access and trade placement and execution may be delayed or fail due to market volatility and volume, quote delays, system and software errors, Internet traffic, outages and other factors.
Securities and futures trading is offered to self-directed customers by TradeStation Securities, Inc., a broker-dealer registered with the Securities and Exchange Commission and a futures commission merchant licensed with the Commodity Futures Trading Commission). TradeStation Securities is a member of the Financial Industry Regulatory Authority, the National Futures Association, and a number of exchanges.
TradeStation Securities, Inc. and TradeStation Technologies, Inc. are each wholly owned subsidiaries of TradeStation Group, Inc., both operating, and providing products and services, under the TradeStation brand and trademark. When applying for, or purchasing, accounts, subscriptions, products and services, it is important that you know which company you will be dealing with. Visit www.TradeStation.com for further important information explaining what this means.

TTD longNASDAQ:TTD long
(The Trade Desk, Inc. (TTD) is a technology company that provides a demand-side platform for digital advertising. Here's a quick overview:
1. Business: TTD specializes in programmatic advertising, using AI and data analytics to automate and optimize ad placements in real-time across various digital platforms.
2. Financial Performance:
- 2024 Revenue: $2.4 billion (26% year-over-year growth)
- Q4 2024 Revenue: $741 million (22% year-over-year growth)
3. Stock Performance:
- Current Price: $59.34 (as of March 24, 2025)
- Year-to-date performance: Down approximately 36%
4. Growth Drivers:
- Connected TV (CTV) advertising
- Shift to programmatic advertising
- Privacy-friendly advertising model
5. Challenges:
- Recent earnings miss and lower-than-expected Q1 2025 guidance
- Increased competition from major tech companies
- Economic slowdowns potentially impacting ad spending
6. Market Position:
- Leader in the demand-side platform (DSP) market
- Strong presence in CTV advertising
- No reliance on first-party data, unlike competitors like Google and Meta
Despite recent challenges, analysts remain generally bullish on TTD's long-term prospects in the growing digital advertising industry)

Crown Castle Inc. (CCI) 1WTechnical Analysis
- The weekly chart of Crown Castle Inc. (CCI) shows a potential reversal after a prolonged downtrend.
- A breakout above the descending trendline and consolidation above $110.85 (0.786 Fibonacci) could signal the start of an upward movement.
- Key Resistance Levels: $132.06 – $146.95 – $161.85 – $180.28 – $210.07.
- Key Support Zone: $83.83 - $90.
- CCI and RSI indicators confirm improving sentiment.
A sustained breakout above $110-112 could lead to mid-term growth.
Fundamental Analysis
Crown Castle is one of the largest telecommunications infrastructure operators in the US.
- Stable revenues due to long-term contracts with telecom providers.
- Dividend yield of ~6%, making it attractive for long-term investors.
- 5G expansion and IoT growth create long-term opportunities.
Risks: High debt burden, interest rate impact, and competition with American Tower.
CCI has growth potential if it breaks above the $110-112 zone. However, macroeconomic risks remain relevant.

Potential Downtrend in AlcoaAlcoa has bounced this month, but some traders could think it’s due for a pullback.
The first pattern on today’s chart is the series of lower lows and lower highs since December. The aluminum company has climbed to the top of that falling channel, which may create potential resistance.
Second, prices stalled at the falling 50-day moving average (SMA) in February and seem to be peaking at the same SMA this month.
Speaking of the 50-day SMA, it recently had a “death cross” below the 200-day SMA.
Next, stochastics are dipping from an overbought condition.
Finally, the 52-week low is near $27 and last year’s low is under $25. Combined with the falling channel, those levels may provide space for potential moves to the downside.
TradeStation has, for decades, advanced the trading industry, providing access to stocks, options and futures. If you're born to trade, we could be for you. See our Overview for more.
Past performance, whether actual or indicated by historical tests of strategies, is no guarantee of future performance or success. There is a possibility that you may sustain a loss equal to or greater than your entire investment regardless of which asset class you trade (equities, options or futures); therefore, you should not invest or risk money that you cannot afford to lose. Online trading is not suitable for all investors. View the document titled Characteristics and Risks of Standardized Options at www.TradeStation.com . Before trading any asset class, customers must read the relevant risk disclosure statements on www.TradeStation.com . System access and trade placement and execution may be delayed or fail due to market volatility and volume, quote delays, system and software errors, Internet traffic, outages and other factors.
Securities and futures trading is offered to self-directed customers by TradeStation Securities, Inc., a broker-dealer registered with the Securities and Exchange Commission and a futures commission merchant licensed with the Commodity Futures Trading Commission). TradeStation Securities is a member of the Financial Industry Regulatory Authority, the National Futures Association, and a number of exchanges.
TradeStation Securities, Inc. and TradeStation Technologies, Inc. are each wholly owned subsidiaries of TradeStation Group, Inc., both operating, and providing products and services, under the TradeStation brand and trademark. When applying for, or purchasing, accounts, subscriptions, products and services, it is important that you know which company you will be dealing with. Visit www.TradeStation.com for further important information explaining what this means.

The Election Was Support. Has it Become Resistance?Last year’s presidential election was a catalyst for stocks. Today’s idea considers its potentially shifting impact on sentiment.
The first pattern on today’s S&P 500 chart is the range between 5597 and 5783. Those prices are the low of November 4 and the high of November 5, the Monday and Tuesday of election week.
On January 13, SPX pulled back to find support at the top of the range. That bounce seemed to reflect ongoing optimism about the coming administration. (Inauguration was exactly a week later.)
The index remained above that zone through early March before sliding below it. Prices have now rebounded but appear to be stalling at the bottom of the price range. Does that show a newer anxiety about policy?
Next, Wilder’s relative strength index (RSI) made lower highs from early December -- despite SPX making incrementally higher highs. That kind of bearish divergence may be consistent with a longer-term trend fading.
Third, SPX is under its 200-day simple moving average (SMA). Staying here may confirm a break of its longer-term uptrend.
Finally, the 50-day SMA recently crossed below 100-day SMA. Both are falling. That may also suggest prices have stopped rising.
TradeStation has, for decades, advanced the trading industry, providing access to stocks, options and futures. If you're born to trade, we could be for you. See our Overview for more.
Past performance, whether actual or indicated by historical tests of strategies, is no guarantee of future performance or success. There is a possibility that you may sustain a loss equal to or greater than your entire investment regardless of which asset class you trade (equities, options or futures); therefore, you should not invest or risk money that you cannot afford to lose. Online trading is not suitable for all investors. View the document titled Characteristics and Risks of Standardized Options at www.TradeStation.com . Before trading any asset class, customers must read the relevant risk disclosure statements on www.TradeStation.com . System access and trade placement and execution may be delayed or fail due to market volatility and volume, quote delays, system and software errors, Internet traffic, outages and other factors.
Securities and futures trading is offered to self-directed customers by TradeStation Securities, Inc., a broker-dealer registered with the Securities and Exchange Commission and a futures commission merchant licensed with the Commodity Futures Trading Commission). TradeStation Securities is a member of the Financial Industry Regulatory Authority, the National Futures Association, and a number of exchanges.
TradeStation Securities, Inc. and TradeStation Technologies, Inc. are each wholly owned subsidiaries of TradeStation Group, Inc., both operating, and providing products and services, under the TradeStation brand and trademark. When applying for, or purchasing, accounts, subscriptions, products and services, it is important that you know which company you will be dealing with. Visit www.TradeStation.com for further important information explaining what this means.

70% Upside Potential in this Nuclear StockOKLO is my personal favorite nuclear play that feeds off the AI energy. Really beat up since it's height in early February, down over 50% as of today (as are a lot of other stocks given the macroeconomic backdrop). Chris Wright, a member of its Board of Directors, was confirmed as the U.S. Secretary of Energy on February 3, 2025. As a result, Wright has stepped down from Oklo’s Board to assume this critical role in advancing the nation’s energy policies.
I can see upside trade heading closer to Q4 earnings March 24.
Bullish Technicals:
- Rounding Bottom
- RSI breaking above RSI MA
- MACD: histogram trending up
- Moving out of the falling wedge
- Just sitting below daily PSAR
OKLO's Key Focus Areas:
- Microreactors – Oklo’s primary product is the Aurora microreactor, a compact and efficient reactor designed to produce power for remote areas, industrial sites, and off-grid locations.
- Fast Reactors – Their reactors use a fast neutron spectrum and liquid metal coolant (like sodium) rather than water, making them more efficient and capable of reusing nuclear waste as fuel.
- Fuel Recycling – Oklo aims to use recycled nuclear fuel (like spent fuel from conventional reactors), reducing nuclear waste and increasing fuel efficiency.
- Long Lifespan – The Aurora reactor is designed to operate for up to 20 years without refueling, minimizing maintenance and operational costs.


Pivoting Drop on Netflix. NFLXLast short idea was profitable for us, and I think this is a time for a pivot now. Price action is king. The drop down looked like ABC of a larger zigzag A wave, so now B which may be quite protracted. Fib goals here are for illustration purposes, as I recommend you never keep your goals stationary but use an adaptive indicator or indicator pair to exit.
