AUDCAD - From Shorts to Potential Longs!!Earlier in this range, we sold 📉AUDCAD near the upper boundary, fading resistance as price showed clear exhaustion. That idea played out well, with price rotating back into the middle and now pressing toward the lower bound of the range.
This is where things shift.
⚔️As long as range support holds, the bias flips from selling rallies to looking for longs from support. In a well-defined range, edges matter more than direction, and the lower boundary is where buyers historically step in.
The plan from here is simple and disciplined.
No chasing. No guessing....
🏹If price holds above support and shows bullish reaction on lower timeframes, longs become valid back toward the range highs. A clean breakdown below support would invalidate this idea and put sellers back in control.
Range trading is not about prediction, it’s about location and reaction.
Will buyers defend the floor once again, or is this range finally ready to break? 🤔
⚠️ Disclaimer: This is not financial advice. Always do your own research and manage risk properly.
📚 Stick to your trading plan regarding entries, risk, and management.
Good luck! 🍀
All Strategies Are Good; If Managed Properly!
~Richard Nasr
CFD

GBPCAD - Trend Intact, Buyers Watching This Zone!!📈GBPCAD remains overall bullish on the higher timeframe, with price respecting a well-defined rising channel.
📹The key focus right now is the confluence zone where horizontal support aligns with the lower blue trendline. This intersection has already proven its importance in the past, and as long as it continues to hold, the bullish structure remains valid.
🏹From a trend-following perspective, this is the type of location where I’ll be looking for longs, not chasing price higher. The plan is simple: patience at support, confirmation on lower timeframes, and alignment with the broader uptrend.
Only a clean breakdown below this support–trendline intersection would weaken the bullish bias and force a reassessment. Until then, dips into this zone favor buyers.
Will this support fuel the next leg higher, or do sellers finally break the structure? 🤔📊
⚠️ Disclaimer: This is not financial advice. Always do your own research and manage risk properly.
📚 Stick to your trading plan regarding entries, risk, and management.
Good luck! 🍀
All Strategies Are Good; If Managed Properly!
~Richard Nasr

GOLD Update🚨📊 GOLD Update
GOLD has formed a clear red resistance zone 🔴,
and price is reacting below it.
A breakout above this zone is needed
to confirm further upside.
Until then,
the trend remains capped by resistance.

XAU/USD Elliott Wave Analysis: Potential Bearish Reversal OANDA:XAUUSD PEPPERSTONE:XAUUSD ICMARKETS:XAUUSD
The chart suggests that Gold Spot/U.S. Dollar (XAU/USD) has completed a major correction pattern and is now on the verge of a significant downward move.
Major Correction (A) ➡️ (B):
The price action from the major peak appears to be forming a complex correction, with the current phase completing the major (B) wave.
The sharp drop to the low around November 1st is labeled as a major (A) wave.
The subsequent rally is labeled as the major (B) wave, which is currently subdividing.
Subdivision of Wave (B): The corrective rally (B) is showing signs of completion as a smaller ABC pattern:
o Wave A (of B): A strong 5-wave impulse (labeled 1-2-3-4-5) completed in mid-November.
o Wave B (of B): A correction followed this high.
o Wave C (of B): The current rally is the final leg, Wave C (of B), aiming for the final target.
• Critical Reversal Target for (B) Wave: The chart anticipates the completion of the final Wave C (of B) at a specific price point, coinciding with a key Fibonacci level and trendline resistance:
61.80% Fibonacci Retracement at $4,313.88
This $4,313 zone is the high-probability reversal point before the major downside move begins.
📈 Technical Levels and Trendlines
Major Resistance (The Reversal Zone):
Upper Red Trendline: This descending trendline connects the initial peak with the top of the internal Wave (B), serving as strong dynamic resistance.
Key Price Target: The $4,313.88 level is the projected apex of the rally.
Understood. Here is the full analysis and titles for your post, presented in English, as requested.
📉 XAU/USD Elliott Wave Analysis: Potential Bearish Reversal from $4,313
🌊 Wave Count Interpretation (Elliott Wave)
The chart suggests that Gold Spot/U.S. Dollar (XAU/USD) has completed a major correction pattern and is now on the verge of a significant downward move.
Major Correction (A) ➡️ (B): The price action from the major peak appears to be forming a complex correction, with the current phase completing the major (B) wave.
The sharp drop to the low around November 1st is labeled as a major (A) wave.
The subsequent rally is labeled as the major (B) wave, which is currently subdividing.
Subdivision of Wave (B): The corrective rally (B) is showing signs of completion as a smaller ABC pattern:
Wave A (of B): A strong 5-wave impulse (labeled 1-2-3-4-5) completed in mid-November.
Wave B (of B): A correction followed this high.
Wave C (of B): The current rally is the final leg, Wave C (of B), aiming for the final target.
Critical Reversal Target for (B) Wave: The chart anticipates the completion of the final Wave C (of B) at a specific price point, coinciding with a key Fibonacci level and trendline resistance:
61.80% Fibonacci Retracement at $4,313.88
This $4,313 zone is the high-probability reversal point before the major downside move begins.
📈 Technical Levels and Trendlines
Major Resistance (The Reversal Zone):
Upper Red Trendline: This descending trendline connects the initial peak with the top of the internal Wave (B), serving as strong dynamic resistance.
Key Price Target: The $4,313.88 level is the projected apex of the rally.
Major Support (The Target Zone):
Lower Green Trendline: This ascending trendline connects the key lows and represents the potential final target for the upcoming decline.
Target Price Zone: The final target for the major (C) wave is indicated near the $3,826.25 level.
🎯 Trading Strategy Implication
Imminent Move: The price is completing the final internal wave towards the $4,313.88 reversal zone.
Short Entry: The ideal short-entry zone is near the $4,313.88 level, with a tight stop-loss placed just above the upper red trendline to manage risk.
Profit Target: The anticipated sharp decline, labeled as the massive (C) wave, targets the lower green trendline around $3,826.25, offering a substantial risk/reward opportunity.
Disclaimer:
This analysis is for educational purposes only and is based on Elliott Wave Theory and technical indicators. It is not financial advice. Trading foreign exchange, cryptocurrencies, and commodity futures involves significant risk of loss and is not suitable for all investors. Past performance is not indicative of future results.
Always do your own research

SILVER - The ATH Retest Opportunity!!!🚀Silver has officially broken above its all-time high - a major milestone for the metal. But nothing moves in a straight line, and healthy trends always correct before continuing higher.
📉Price is now on its way to retest the previous ATH zone in red, which aligns perfectly with the rising trendline. This creates a powerful confluence area where buyers have historically stepped back in with strength.
⚔️As Silver taps into this intersection, we will be looking for trend-following longs, expecting the bulls to defend the zone and push toward new highs.
🏹The structure is bullish. The trendline is intact. The level is clean.
Now we wait for the reaction… will the bulls reload here? 🤔
⚠️ Disclaimer: This is not financial advice. Always do your own research and manage risk properly.
📚 Stick to your trading plan regarding entries, risk, and management.
Good luck! 🍀
All Strategies Are Good; If Managed Properly!
~Richard Nasr

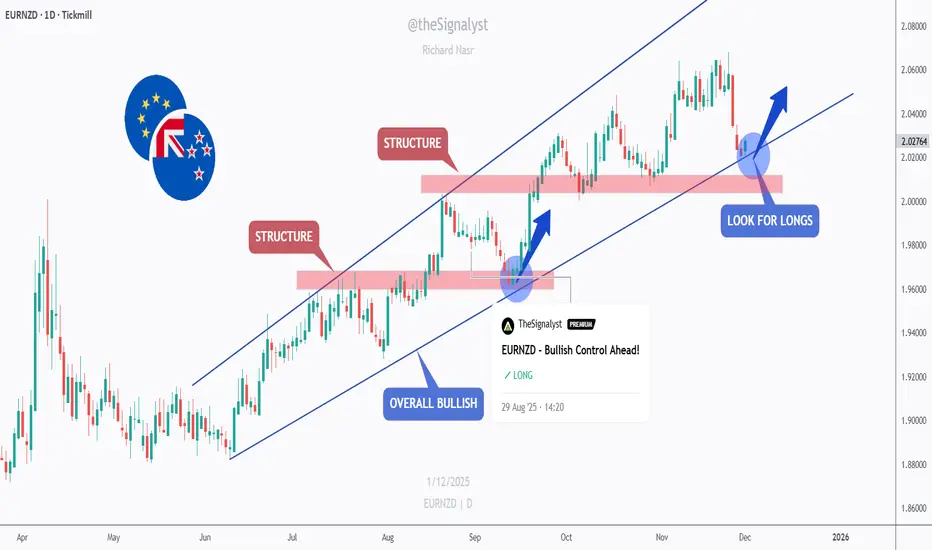
EURNZD - Bulls Eyeing the Structure Zone... Again!📈EURNZD remains overall bullish, moving cleanly inside its rising channel. Each dip toward the lower bound has acted as a strong continuation zone, with buyers consistently stepping in to drive the next upward wave.
🏹As price approaches the lower trendline and the red structure zone, we will be looking for trend-following longs. This area has served as a key support multiple times, making it a high-probability level for the bulls to re-enter the market.
⚔️As long as EURNZD holds above this structure, the bullish trend remains intact and a new push toward higher highs becomes the most likely scenario. Only a confirmed break below the structure would weaken the bullish outlook.
Now we wait for the reaction at structure… will the bulls defend it once again? 🤔
⚠️ Disclaimer: This is not financial advice. Always do your own research and manage risk properly.
📚 Stick to your trading plan regarding entries, risk, and management.
Good luck! 🍀
All Strategies Are Good; If Managed Properly!
~Richard Nasr
NZDUSD - Trio Rejection… Now Waiting for the Retest!📈NZDUSD has just rejected a strong TRIO retest zone , marked by the blue circle — the intersection of the demand zone, the falling channel support, and the oversold lower trendline. This confluence has already generated a strong bullish reaction.
⚔️Now, after the initial bounce, we will be waiting for price to retest the red demand zone. That’s where we will be looking for long setups, aligning with the new bullish momentum that formed after the trio rejection.
🏹As long as NZDUSD stays above the major green demand area , the bullish correction toward the upper orange trendline remains the most likely scenario. A strong reaction from the red zone would confirm buyers stepping back in.
Will NZDUSD give us the clean retest entry? 🤔
⚠️ Disclaimer: This is not financial advice. Always do your own research and manage risk properly.
📚 Stick to your trading plan regarding entries, risk, and management.
Good luck! 🍀
All Strategies Are Good; If Managed Properly!
~Richard Nasr

XAUUSD - Bulls Still Stepping In at Demand… Watching the Retest!Gold remains overall bullish, holding firmly above the major support zone around $4,000–$4,050. This entire red area has been acting as a strong demand zone for weeks, with price bouncing from it multiple times, a clear sign that buyers are defending this level aggressively.
📈XAUUSD is also respecting the rising trendline , forming a clean higher-low structure. As long as Gold remains above both the trendline and the support zone, the bullish outlook stays intact. I will be looking for long setups on the next retest of this confluence area.
🏹If buyers step in again, the next move could push toward the previous highs near $4,385. But if price breaks below the support zone and the trendline, the bullish structure would weaken and open the door for a deeper correction.
For now, this zone is the key. Will Gold bounce again… or finally break through support? 🤔
⚠️ Disclaimer: This is not financial advice. Always do your own research and manage risk properly.
📚 Stick to your trading plan regarding entries, risk, and management.
Good luck! 🍀
All Strategies Are Good; If Managed Properly!
~Richard Nasr

USDJPY - Bulls Watching the Intersection Zone!📈USDJPY remains overall bullish, moving steadily inside its rising channel. After a strong impulsive move upward, the pair is now forming a healthy correction, heading toward a key confluence area.
⚔️As price approaches the intersection of the lower trendlines and the demand zone, we will be looking for trend-following longs. This orange area has acted as a strong support multiple times, and with both trendlines meeting there, it becomes a high-probability spot for buyers to step in.
🏹If the bulls defend this zone , USDJPY could resume its upward movement and push toward new highs. Only a clear break below the demand zone would weaken the bullish outlook.
For now, the plan is simple: wait for the retest… then look for longs from structure. 🤔
⚠️ Disclaimer: This is not financial advice. Always do your own research and manage risk properly.
📚 Stick to your trading plan regarding entries, risk, and management.
Good luck! 🍀
All Strategies Are Good; If Managed Properly!
~Richard Nasr

GBPCAD – Triple Tap Trouble!GBPCAD has been trading within a well-defined range, with price rejecting the 1.8850 resistance zone multiple times in the past.
Each test of this area has led to strong bearish moves, highlighting its significance as a supply zone.
Here’s what the chart shows:
🔴 Resistance Zone: Price is approaching the upper bound of the range, where sellers have consistently stepped in.
🔵 Support Zone: The 1.8300 area remains a solid demand zone, holding price higher on several occasions.
📈 Rising Channel: The latest bullish leg is developing inside an ascending channel, but momentum is slowing near resistance.
⚠️ Short Opportunity: As long as price trades below the resistance, the area remains attractive for short setups targeting the mid-range or lower bound.
Confirmation with bearish candlestick patterns will strengthen the case for a downside move.
📌 Will GBP/CAD respect its range and roll over once again, or will the bulls finally break through?
This analysis is for educational purposes only, not financial advice. Always manage risk properly before taking trades.
📚 Stick to your trading plan regarding entries, risk management, and trade execution.
Good luck!
All Strategies Are Good; If Managed Properly!
~Richard Nasr

USDCHF - Bulls Preparing to Defend the Zone!⚔️USDCHF is currently trading around a key intersection zone , where the rising trendline meets the major green support area.
This confluence makes it a high-interest zone for potential bullish reactions, as the pair has respected this structure multiple times in the past.
🏹As long as the support area holds, I’ll be looking for long setups, expecting the next impulse to push price back toward the upper bound of the ascending channel.
If the support breaks, however, the bullish outlook would weaken, so patience and confirmation are key here. ⚖️
⚠️ Disclaimer: This is not financial advice. Always do your own research and manage risk properly.
📊All Strategies Are Good; If Managed Properly!
~Richard Nasr

NZDJPY - The Wall of Sellers Awaits!⚔️NZDJPY is once again approaching a massive resistance zone highlighted in red, an area that has rejected price multiple times in the past, acting as a strong supply wall.
📉As the pair nears this level , I’ll be looking for potential short setups, expecting a bearish rejection that could drive price back toward the lower support zone around the previous lows.
This range has defined the market for months, and until a clear breakout occurs, playing the range remains the optimal strategy, sell high, buy low.
Will the bears defend this zone one more time? 👀
⚠️ Disclaimer: This is not financial advice. Always do your own research and manage risk properly.
📊All Strategies Are Good; If Managed Properly!
~Richard Nasr

CADJPY - The Trio Retest Setup!📈CADJPY has been on a strong bullish run lately, but price is now approaching a critical confluence zone, the perfect Trio Retest Setup.
The red circle highlights the intersection of two upper trendlines (the rising channel and the short-term wedge) together with a major horizontal resistance at 111.00.
⚔️This trio intersection creates a powerful technical barrier, suggesting that the pair is overbought in the short term. From here, I’ll be looking for signs of exhaustion or reversal patterns to catch the next corrective leg down.
🔎A potential retracement could send CADJPY back toward the 106.00–105.00 support zone, which also aligns with the lower boundary of the main ascending channel.
Until the trio zone is broken decisively to the upside, the bears might step in to cool off the momentum.
⚠️ Disclaimer: This is not financial advice. Always do your own research and manage risk properly.
📊All Strategies Are Good; If Managed Properly!
~Richard Nasr

EURUSD - Preparing for the Next Wave of Bearish Momentum!🏹EURUSD remains trapped within a well-defined descending channel, with the market structure clearly favoring the bears.
Each rally has been met with selling pressure, forming a series of lower highs and lower lows, a textbook example of controlled downside continuation.
⚔️As price approaches the confluence zone, where the upper red trendline meets the horizontal structure around 1.1680–1.1700, I’ll be looking for potential trend-following short setups. This intersection has acted as a strong rejection point in previous moves, and it remains a key decision zone for sellers to step back in.
If rejection confirms there, the next leg lower could retest the 1.1550, then 1.1500 support areas.
On the flip side, a daily close above 1.1720 would be the first sign of a possible short-term shift in sentiment.
Until proven otherwise, the trend is clear — rallies are for selling.
⚠️ Disclaimer: This is not financial advice. Always do your own research and manage risk properly.
📚All Strategies Are Good; If Managed Properly!
~Richard Nasr

EURCAD - Buy the Bounce at Confluence!📈EURCAD remains in a steady rising channel on the daily. Price has pulled back into a strong support zone that perfectly aligns with the channel’s lower bound and the base of the recent micro wedge.
🏹As long as this confluence holds, I’ll be looking for trend-following longs from here, aiming first for the recent highs, then the channel top.
⚠️ Disclaimer: This is not financial advice. Always do your own research and manage risk properly.
📊All Strategies Are Good; If Managed Properly!
~Richard Nasr

NZDJPY - Waiting for Bulls to Step In!NZDJPY has been trading within a broad ascending channel and is now approaching a strong demand zone that aligns with the channel’s lower red trendline.
This area has acted as a solid base in the past, and as price retests it once again, it could serve as the starting point for a new bullish swing.
As long as the blue demand zone holds, I’ll be watching for bullish reversal signals to look for long opportunities, with potential short-term targets toward 87.50 and 88.80, where previous supply and the upper boundary of the channel intersect.
However, if the price breaks below 85.00, the bullish structure would weaken, and a deeper correction could follow before buyers regain control.
⚠️ Disclaimer: This is not financial advice. Always do your own research and manage risk properly.
📚 Stick to your trading plan regarding entries, risk, and management.
Good luck! 🍀
All Strategies Are Good; If Managed Properly!
~Richard Nasr

EURCAD – Waiting for the Perfect ConfluenceEURCAD remains overall bullish while trading inside a rising channel.
At the moment, price is approaching the intersection of the channel’s lower trendline and the horizontal structure zone.
That’s where I’ll be watching closely for trend-following long setups, ideally a rejection or reversal confirmation around that confluence area.
As long as this structure holds, the bulls remain in control, and we could see a continuation toward the upper bound of the channel.
⚠️ Disclaimer: This is not financial advice. Always do your own research and manage risk properly.
📚 Stick to your trading plan regarding entries, risk, and management.
Good luck! 🍀
All Strategies Are Good; If Managed Properly!
~Richard Nasr

GOLD => $4000 The MagnetGold has been pushing higher within its bullish log-chart structure, moving inside two rising channels (red short-term and blue long-term).
The interesting part? The $4000 level is acting like a magnet, and it happens to intersect with the upper bound of both channels. This rare confluence makes $4000 a key level to watch.
As long as the bullish momentum holds, Gold remains on track toward this magnet level. But once there, the reaction will be critical, a clean breakout could open the door for fresh highs, while a rejection may trigger a correction before continuation.
⚠️ Disclaimer: This is not financial advice. Always do your own research and manage risk properly.
📚 Stick to your trading plan regarding entries, risk, and management.
Good luck! 🍀
All Strategies Are Good; If Managed Properly!
~Richard Nasr

EURGBP - Testing Supply at the Channel TopEURGBP has been grinding higher on the 4H, respecting a rising channel. Price is now tagging the overbought zone near the upper bound and a 0.873–0.875 supply area.
This confluence is key 🔑. If sellers react here, I’ll look for short setups on rejection, aiming for 0.867 first, then 0.863 toward demand and the lower channel.
If price breaks and holds above 0.875, the short idea is invalidated and 0.880+ could follow. Until then, it’s a “look for shorts at supply” play.
What’s your take - fade the touch at supply, or wait for a confirmed break and retest? 🤔
⚠️ Disclaimer: This is not financial advice. Always do your own research and manage risk properly.
📚 Stick to your trading plan regarding entries, risk, and management.
Good luck! 🍀
All Strategies Are Good; If Managed Properly!
~Richard Nasr

EURAUD – Channeling the Bears!EURAUD has been overall bearish 📉, trading inside a clear descending channel.
Price recently bounced and is now retesting the 1.7800 structure zone, which aligns with the upper bound of the channel. This area is acting as a strong confluence 🔑, making it a potential spot to look for short opportunities.
As long as price remains below this structure, sellers 🐻 are likely to stay in control, with downside continuation toward the channel’s lower bound.
Patience ⏳ is key here — waiting for bearish confirmation can provide a cleaner entry and reduce risk.
⚠️ Disclaimer: This is not financial advice. Always do your own research and manage risk properly.
📚 Stick to your trading plan regarding entry, risk, and trade management.
Good luck!
All Strategies Are Good; If Managed Properly!
~Richard Nasr

Futures rise as traders await inflation data, Fed cuts in focusFutures rise as traders await inflation data, Fed cuts in focus
U.S. stock index futures rose slightly on Thursday as traders awaited key consumer price data at 8:30 a.m. ET, expected to show higher August inflation. Wednesday’s softer PPI report fueled bets on Fed rate cuts next week, with markets fully pricing in a 25-bps move and assigning a 10% chance of 50 bps.
Weak labor data reinforced easing expectations, while jobless claims numbers are also due today. The AI trade revived midweek, lifting chipmakers and utilities tied to data centers. Oracle gained 1.6% premarket, while gun stocks extended gains after news of a campus shooting. Despite September’s poor historical record, Wall Street has opened the month on a strong note, with strategists seeing Fed cuts as the key driver of market direction.
NZDCAD – Range Resistance in Play!📌 NZDCAD has been moving within a clear range structure between support and resistance zones on the 1H timeframe.
Price is now approaching the upper resistance area, where sellers have consistently stepped in to cap bullish momentum.
If this level holds, we could see a bearish reversal, driving price back toward the support zone near the lower boundary of the range.
This setup offers a classic opportunity to trade the swing from resistance back into support.
⚠️ Always remember: patience pays. Let the market come to you.
📚 Always follow your trading plan regarding entry, risk management, and trade management.
Good luck!
All Strategies Are Good; If Managed Properly!
~Richard Nasr

GBPUSD – Supply Zone Bears on Watch!GBPUSD continues to trade within a broad descending channel on the 4H timeframe. Price is approaching a well-defined supply zone that aligns with the upper red trendline resistance.
📉As long as this area holds, sellers are expected to step in, making it a high-probability zone to look for short setups.
A rejection from this level could push price back toward the lower boundary of the channel, keeping the bearish structure intact. Traders should stay cautious and watch for confirmation signals before engaging.
⚠️ Always remember: patience pays. Let the market come to you.
📚 Always follow your trading plan regarding entry, risk management, and trade management.
Good luck!
All Strategies Are Good; If Managed Properly!
~Richard Nasr
