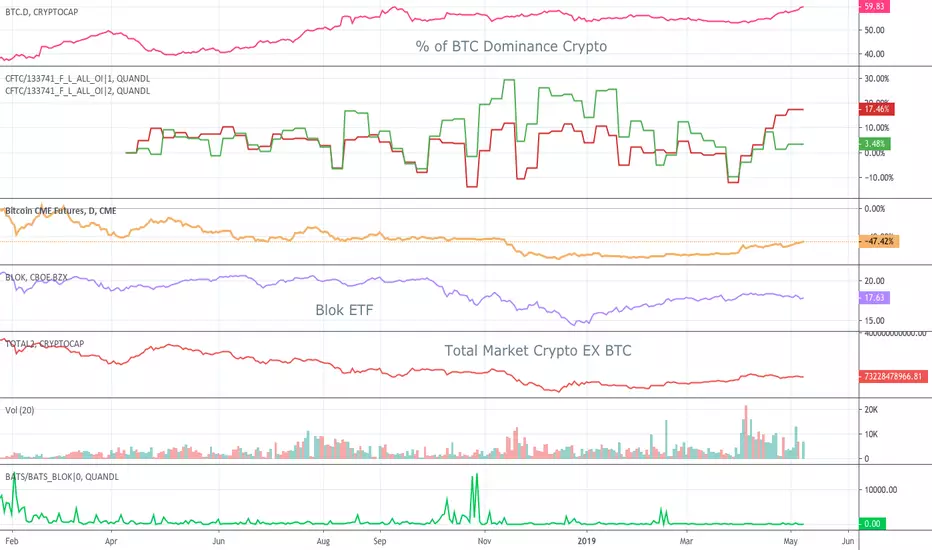
Bitcoin low week on week of bitcoin futures anniversaryPrice has come down to test the 6-7k support level, potentially ready to bounce.
Price has made an inverse head and shoulders pattern into this zone.
The right shoulder bounced off the 62 fib retracement from the head.
The head occurred the week of December 15, the anniversary of the creation of bitcoin futures contracts (Price found its high around 20k and low of 3k the week of dec 15 2017 and 2018 respectively).
Volumes are low, indicating a potentially big move coming.
The cftc commitment of traders reports showed institutions to add to their longs and remove some shorts over the holidays. Still net short about 2 to 1, but the shift in positioning could indicate short term bullishness.
Looks like it could be a big year, the halvening is coming up in May and Facebook and Starbucks are planning on releasing their own digital currencies sometime in 2020.
The fear of wwIII and run up in gold may act as catalysts to get price moving very soon as well.
I expect price to come up to challenge resistance around the 10-11k levels. Potentially run further up to all time highs, or get rejected and fall to test the 3-4k support. But 10k is my next stop.
Cftc

2020 Medium Term Global Markets OverviewHi, I have tried to compile the highlights of my new year as a basis for my future trade and ideas.
I would gladly present it to everyone.
General Markets
In general, the S&P 500 index is in a good rally.
This rally shows that we are currently globally optimistic.
Brent and Crude Oil also seem to have had their share of this rally.
Moreover, the movements of US 10-year Bond Yield, EURUSD and Dollar index are also supporting this movement.
The Japanese Yen is more stable and relatively downward, but positions are unraveling.
These disintegrations may be a clue that a positive trend will be established.
We already know that Gold and Japanese Yen movements are highly correlated on the weekly chart.
Which may support our Gold argument.
The VIX index foreshadows less volatility, but as the index value decreases, the positions also dissolve.
This disintegration is not so much now, but as the disintegration increases, the trend return will be a big sign.
However, we see that Gold, Silver and Iron Ore do not participate in these movements and are quite discounted.
Natural Gas is a less liquid instrument, but there seems to be a significant discount, but the positions have not been sufficiently solved.
Should be followed closely.
Here, Gold, Silver, Iron Ore and Natural Gas in mind, we go down more specifical layers.
Stock Markets
If we look at U.S Dollar based changes of various stock exchanges in the same period, we see that most countries' stock markets benefited from the rise of the S&P 500 Index.
We observe that Australia, Canada, Turkey, China, Singapore,Japan stock exchanges are discounted.
India, Norway, Switzerland, Spain and the Netherlands stock exchanges can also be considered relatively cheap.
In addition, we observe that New Zealand, Denmark, Russia, Sweden, South Africa Stock Exchanges benefited more than the rally.
Forex and Future Markets
When we look at the futures, we can see that the Canadian Dollar, Swiss Franc and Australian Dollar are discounted compared to other currencies and the increase in their positions is maintained.
The euro wants more serious increases in positions.
When we look at agricultural and metal Futures, COT positions seem to support the increase.
But the cheap ones are among them.Especially Platinum is quite cheap.
G10 Developed Countries
When we look at the currencies and interest rate changes in developed countries, we have nothing to say before.
But there is no anomaly between interest and currencies.
Here, the Norwegian crown is relatively discounted.
The British Pound and the New Zealand Dollar have benefited strongly from the rally.
MSCI Emerging Countries
When we look at developing countries, interest yields did not increase at a time when the Turkish Lira experienced a big loss.
An abnormal situation is observed here.
This makes the Turkish Lira even more fragile.
India is not yet at such risky levels, but it is worth being careful.
Taiwan, Indonesia and Chinese currencies are observed to be cheap.
U.S Important Indices
When we look at the important US indices, it is observed that these indices perform below S&P:
DJI : Dow Jones Industrial Average
NYA : NYSE Composite Index
HGX : PHLX Housing Sector Index
UTY : PHLX Utility Sector Index
XNG : NYSE ARCA Natural Gas
SPGSCI : S&P Goldman Sachs Commodity Index
SPSIOP : S&P Oil and Gas Exploration and Production Select Index
GDM : NYSE Arca Gold Miners Index
DFI : NYSE Arca Defense Index
NWX : NYSE Arca Networking Index
XOI : AMEX Oil Index
NQNACE : Nasdaq Yewno North America Cannabis Economy Index
NOTE : This index is not very well settled, but it is possible to look at the liquid stocks in the field.
Cryptocurrency Market
When we look at the cryptocurrency market, we observe that Tezos is the rising star.
In root Cryptocurrencies, the blockchain data of bitcoin's blockchain shows us that it can move upwards.
But this data needs to be a little more powerful.
More discounted crypto instruments than Bitcoin:
Litecoin , Ethereum , Stellar , BinanceCoin , EOS , Bitcoin Cash and Ripple .
However, since these instruments are more fragile, a buy signal should be expected.
And if Bitcoin will be on Bull market with the strong Blockchain data, these instruments can be expected to rise further than Bitcoin.
But it should be remembered that in case of outside capital or hot money inflow, the first rise will come from the Bitcoin wing.
I wish everyone a happy new year,best regards.

Natural Gas Overview Natural Gas industry finds itself in an odd predicament – total production is still at record levels, and may continue to climb, albeit at a slower and lower rate. At the same time there are widespread financial problems in the industry, particularly for gas-focused companies. One of the big questions regarding production is whether Texas oil drillers can keep gas output growing enough to offset the declines underway in Appalachia.
- Nick Cunningham
Let's start after this current summary.
Natural gas prices continue to be dominated by bears under the trend line.
The risk / reward ratio for the continuation of the bear market is now at 2 levels.
When we look at the graph, we see a bearish wolfe wave formation, but we cannot say that it started because prices above the reference point.
I think over 2.500 - 2,656 area bears will be replaced by bulls. ( 2.656 = Stop-Loss Level )
The current trend line is not a very accelerated and reasonable line, but may be an indicator of excessive pricing.
The temperatures are above the seasonal norms all over the World.
The support-resistance levels to be followed are:
-Support Level : 1.647
-Resistances : 2.5 - 3.05 - 3.9 - 4.527
Summary
I don't see a very valuable risk / reward ratio for opening positions on a weekly basis, but for the downward refraction of the bullish wolfe wave, opening short for lower time periods can be considered.(Breakout Bullish Wolfe 2-4 Reference Trendline )
I can look forward to an opportunity for a clear upward break of the orange trend line and 2.5 resistance, or for long positions over long periods of time below the level 2, ie close to support.
When one of these possibilities comes true, I will share my opinion with another clear judgment.
Best regards.

Dollar in danger, trade optimism and commodity markets go upThis week, as we noted yesterday, will not be rich in fundamental events, so markets have focused on the trade war.
China deal is likely to be signed in November. Added to this positive news the information that the United States may not set tariffs on imported cars from Europe and Japan.
Naturally, the safe-haven assets adjusted against this background. Despite yesterday's decline, we continue to recommend the purchase of gold and the Japanese yen. Entry points based on yesterday have become even more attractive.
Therefore we observed the growth in the commodity markets. Recall, we recommend buying oil in the region of $ 60 (brand WTI). Especially when you consider the latest news that the IPO Saudi Aramco is finally completing its long epic. With the current information, on December 11, shares of the company can be offered for trading on the Riyadh Stock Exchange.
Returning to the foreign exchange market, we note that the dollar looks less strong in the foreign exchange market. According to the Commodity Futures Trading Commission (CFTC), speculative rates on the growth of the dollar on the Chicago Mercantile Exchange fell by almost two-thirds. Thus, speculators sell the dollar for the second week in a row, and if this trend develops, then in the next reporting period its net position may become short.
So we recall our recommendation to sell the US dollar. The sale of USDCAD seems to be promising. According to CFTC, the net long speculative position on the Canadian dollar reached its most bullish level since December 2017. That is, the markets are very aggressive and it is worth to join the general rush. However, sales of the dollar against the yen, the euro and the pound also look quite prospective.
As for today, the Reserve Bank of Australia expectedly left the rate unchanged. And the most interesting event in terms of macroeconomic statistics today is the publication of the ISM index of business activity in the US services sector. Also, pay attention to the data on the US trade balance.

SUGAR : LONGSugar is trying to hold onto the trend channel.
We are currently in a very volatile process.
You can wait for this week's closing. (Friday)
Since I deem it appropriate for risk / reward ratio, I suggested a position like this:
Stoploss: 0.11403
Target : 0.12764

CORNUSD : LONGThe support and resistance levels are pivot bands and adaptive. Updates will be made about the idea.
You can use supports for profit realization and resistances for stoploss according to your leverage and risk .
NOTE: My ideas made only as a result of some predictions, do not agree completely. Just consider it as an idea between your opinions.

AUDCAD fundamentals and technicalsCanadian benchmark rate is at 1,75% and is expected to rise gradually but is dependent on the oil prices, as growing concerns
over growing surplus and lower demand. Canada is highly dependent on the U.S. economy where there are expectations
on a slowdown to more sustainable pace through 2019. Consumption spending and housing investment is slowly weakening, and a
high interest rate is not helping. while household spending also will be dampened further. The economy is expected to grow
by 1,7% this year. CPI inflation is also expected to edge further down, while a lower canadian dollar could increase some upward pressure.
Australia´s benchmark rate is at 1,50% and is likely to stay at the level for some time. the lower level of interest rates
are showing some support for the Australian economy. After a rise in house prices
credit conditions for borrowers are tighter than before which results a fall in house prices. Some optimism for a U.S. - China trade agreement
could push the AUD higher, while slowing growth concerns can put some downside risk to the Aussie as Australia is highly dependent
on China which is the biggest export market for them. CPI inflation is expected to fall in the short term because of the low oil prices.
Australia´s economy is expected to grow with 3% through 2019 and support a strong labor market while also supporting inflation target of 2%
Growth outlook is being supported by rising business investments and higher spending on public infrastructure.
CFTC-Report is showing a bigger positions in net short on the CAD than the AUD where previously levels have shown that the aussie was heavily shorted.
the net short is slowly decreasing for AUD.
Bond spreads between CA05Y vs. AU05Y is tight with a higher yield on the CA05. This could indicate that some selling is taking place for CA05 and some buying for AU05
i expect the bond yields to widen a bit with higher yield on CA05
Looking for a break of 0.95 handle with stops below 0.94 handle.

BCOM headed lower as global metals,Natgas and oil falterOur CFTC prop research points out the Bloomberg commodity index is headed lower. This has a wide ranging effect on global indices and sectors that are heavy weighted trading or using Metals, Natgas and Oil.

This is not an idea - but a representation of COTs report on WTIThis visualizes current price vs one year prior.
It visualizes Managed Money long and short positions, current to last year.
And Producer/Consumer of oil, current to last year.

EURJPY - Biggest Yen short covering underwayCFTC data shows YEN bears were at extremes a few weeks back. They have started to unwind their positions and thus accelerating Yen's upside.
Nikkei225 which is in close inverse-correlation with YEN is tracking lower too.
We expect market participants to continue unwinding YEN shorts from over -$12bn short to -$7.5bn, which would transcend into a 2-3 handle move in EURJPY.
Euro bears are currently out in full force and have no reason of squaring positions.


Alarm indicator...SPX at 52W highs and issues above 200D
less than 70 % and % of OI CFTC Futures
position commercial longs above commercial
shorts and SPX PUT CALL less than 1.40

EURAUD - extreme CFTC positioning signals correctionFundamentals:
CFTC positioning: -72.1K - speculators extremely short on AUD -> often signals change in direction
RBA - rate hold expected, personally I believe there will be a hawkish tone -> AUD supportive
Core inflation, wages picking up steadily, GDP in Sept above consensus
Little carry advantage for Aussie against EUR
Technicals
+Divergence (7%) from 200DMA
+Daily double top forming

Short the Bitcoin Ponzi Bitcoin is approaching the dreaded 200 MA line with high RSI and Declining Volume. I expect the price to fall down to the 6k zone. The legal hammer of the CFTC and SEC can pound Bitcoin's price to $3,000. In till that happens, do not expect anything lower than $6,000.

EURNZD - Two reasons to sellLeveraging funds last week made large sales of contracts for Euro (Contracts for Euro against USD). However, also in the same week, these funds reduced the number of contracts for NZD sales, which in combination with the analysis of the chart may mean a drop in the price on EURNZD

Is europe due to outperform american stocks for a while?Based on numerous conditions: CFTC euro dollar extreme values (long crowed), CFTC dollar index extreme values (short crowed), german bonds 2y/10y vs us 2y/10y bonds spreads, american and europe inflation divergences (5y5y swaps), quantitative tightening (america fed hikes) vs esasing (europe ECB bond purchase), trump fiscal dollar multinational repatriation (buying dollar and sell other currencies) ...

How to filter noise out of Technicals and Fundamentals part 2
Part 2 Fundamental noise filtering
I place far more weight on fundamental analysis then technical. At first I thought it was useless as half the news or analysts would say one thing and the other half would say the opposite. the trick is to only look at sources that can reliably and logically be shown to have a impact on the market.
Who has an impact on the market:
1: Speculators (yep just speculators not the news or the actual state of an economy)
while that statement is not exactly true it seems to be a reliable self fulfilling prophecy
lets take a look at large speculators positions from 2002 until 2018 compared to a bar chart.
i65.tinypic.com
this picture shows the weekly CFTC commitment of traders reports from 2002 to 2018 correlated into a line chart under a corresponding bar chart.
The arrow in the picture points to a turning point where the speculators (green line) went from net short to net long. what happened?
The market shot up like a rocket. outside of consolidation periods the market just about always drops or gains right after this happens just looking at the EUR it ALWAYS marks the end of a trend without fail. Its almost eerie how accurate the CFTC comittment of traders reports are at predicting trend changes.
where do we get the COT report and how do we use it?
Step 1:
go to www.cftc.gov
step 2:
click on the Chicago Mercantile Exchange and scroll past the butter, cows and logs to the EURO FX
i67.tinypic.com
step 3:
look at the important parts of the EURO FX data.
i67.tinypic.com
1: the date of reported positions
2:Non-Commercials (people investing to make money. These are the people who have so much money in positions they have to report it to the CFTC weekly. people and company's with that kind of money have far more resources to base their decisions off of then me and if most of them think in one direction then odds are most of them are right. As we can see on the chart in the picture most of them went net short not during but before the euro crashed in 2014.)
3: On the left long positions on the right short positions. (far more long then short this is a definite uptrend.)
4: changes from last week.
very very important for positioning in immediate furtue. For example on the 9th we got this report
i66.tinypic.com
what happened directly after was an uptrend. look for changes in net long and short positions. An increase in net long from last week or a decrease in net short from last week will likely predict an uptrend in a day or 2. sometimes the trend already happened by the time you get the report.
The COT report is the only fundamental analysis I use.
Why:
1. conflict of interest.
most of the large news company's are owned by banks ergo any information I gather based on news is biased.
2. Education
I grew up on fishing boats in Alaska and currently drive a forklift all day. forming a accurate opinion based on economic data on my own is beyond my level of education. Lets recognize our weak points and not pretend we can be on par with someone who has spent years in college for economics.
3. Retail traders are 90% wrong and I am a retail trader
lets take a quick look at how Retail traders net positions look.
www.oanda.com
as we can see with the EUR/USD 63% of retail traders are trying to short a market that has been going up for months non-stop and they have been for months its usually worse then 63% too lul.

Dax in euros and Dax in dollar terms... CFTC COT as percentage of open interest of EURUSD non commercial futures positioning... EURUSD analysis, DAX and DAX in dollar analysis...


ES_F CFTC COT %IO NON COMM SPREADSAnalisys of futures positions on ES_F and days since positive (long > short) and negative (long < short) ...

Analysis of production, consumption and reserves of oil and oil On April 11, a fresh STEO report comes out, so you should wait for the updated forecast for the oil market from an official source. Conclusions on this report will be published in the blog www.cofutrading.com. But at the moment the situation is as follows: OPEC reduces production, and the US increases it. But along with the growth in production, which is accompanied by an increase in the number of drilling rigs in the US, oil consumption is also increasing. Exports are also high. Despite of inreasing us oil stocks (which is quite normal for a given time of the year), the growth rate of reserves is low, it is lower than last year and below the average for 5 years of value. That in general is bullish (at least for me). Demand for gasoline is high, demand for distillate is also high, so refineries will continue to "consume" a sufficient amount of oil, absorbing the growth of supply. Judging by CFTC COT reports, as of March 28, funds reduced their extremely bullish position. I do not attach high importance to these reports, I can only say that the long lines have been dropped, so the way for entering new long positions is open. I continue to adhere to the neutral-bullish direction in the US oil market, but before the opening of new positions I will wait for a new STEO report from the EIA.
See EIA report charts at my facebook page :
