Gold Continues to Set New HighsGold prices continue to climb, trading around $5,060 in early Tuesday’s session. The precious metal remains firmly in an ongoing bullish streak, supported by growing concerns over financial and geopolitical instability.
From a technical perspective, gold is moving within a short-term ascending channel, and the path of least resistance remains to the upside. The immediate objective is a reclaim of the $5,100 resistance zone, which could open the door for further gains. On the downside, any corrective move is likely to find strong support in the $5,000–$4,980 area, viewed as the next key demand zone.
In terms of momentum, gold’s rally accelerated following fresh tariff threats from U.S. President Donald Trump over the weekend. Just days after easing pressure on certain European allies over the Greenland sovereignty issue, Trump stated on Saturday that he would impose 100% tariffs on Canadian imports if Ottawa were to reach a trade agreement with China. This rhetoric has intensified market uncertainty and boosted safe-haven demand.
At the same time, the risk of another U.S. federal government shutdown is resurfacing. Several Democratic senators have announced plans to vote against the upcoming budget bill next week, following the fatal shooting of a second American by federal agents in Minneapolis on January 24. This adds another layer of political tension to an already fragile environment.
Moreover, frequent policy shifts by the U.S. administration are contributing to a climate of uncertainty, prompting investors to move away from the U.S. dollar and Treasury bonds, traditionally considered gold’s main safe-haven competitors. Gold’s sharp surge reflects not only geopolitical risks but also ongoing de-dollarization trends in several economies and expectations of lower U.S. interest rates.
Market participants largely expect the Federal Reserve to keep interest rates unchanged after its upcoming two-day meeting on January 27–28. The meeting takes place amid heightened tension after Fed Chair Jerome Powell revealed that the Department of Justice has filed a lawsuit against him, which he described as another attempt by the executive branch to pressure the Fed.
Against this backdrop, gold continues to benefit and reinforce its role as a premier safe-haven asset, amid rising geopolitical, trade, and monetary uncertainty.
Channeltrend

NZDJPY - Price Is Moving Within A Rising ChannelThis is an NZD/JPY 4‑hour chart showing an overall bullish uptrend inside an ascending channel, with a plan to buy (go long) on a pullback into a highlighted support area rather than selling the drop.
Trend and Structure 📊
Price is moving within a rising channel marked by two parallel diagonal lines, creating higher highs and higher lows, which defines a bullish market structure.
Labels like “DAILY – BULLISH” and “H4 – BULLISH” indicate that both the daily and 4‑hour timeframes are aligned upward, so the trade idea follows the dominant trend instead of fighting it. ⬆️
Current Price ActionPrice recently pushed up to the upper boundary of the channel and then sharply rejected from it, causing the current pullback you see on the right side of the chart.
This drop is treated as a correction within the uptrend, not yet a reversal, because price still trades above the lower channel line and key support zones.
Trade Idea Logic ✍️
The idea is to buy at a discount in an uptrend: enter near support with the trend, place stops below the recent swing low or below the support zone, and target the midline or upper boundary of the channel as potential take‑profit areas. 📈
If price breaks and closes clearly below the channel support and the green zone, that would invalidate the long setup here and may shift bias from bullish to neutral or bearish until a new support area is found.

TheGrove | USDJPY Buy | Idea Trading AnalysisUSDJPY is falling towards a support level which is a pullback support and could bounce from this level to our take profit.
We expect a decline in the channel after testing the current level which suggests that the price will continue to rise
Hello Traders, here is the full analysis.
I think we can soon see more fall from this range! GOOD LUCK! Great BUY opportunity USDJPY
I still did my best and this is the most likely count for me at the moment.
-------------------
Traders, if you liked this idea or if you have your own opinion about it, write in the comments. I will be glad 🤝

NIFTY at Key Support – Foundation for the Next Bull RallyThis is the daily timeframe chart of NIFTY.
NIFTY is showing strong support in the 24,850–24,950 zone. This zone is technically important due to multiple confirmations:
EMA support near 24,956
Fibonacci support near 24,938
Additionally, the channel support lies in the 24,850–25,050 range, strengthening the overall support structure.
On the upside, immediate resistance is seen around 25,500–25,700, while the next major resistance is placed near 26,400–26,500.
If this support zone holds, NIFTY is well-positioned for the next bullish move towards the mentioned resistance levels.
view invalid below 24800.
Thank you.

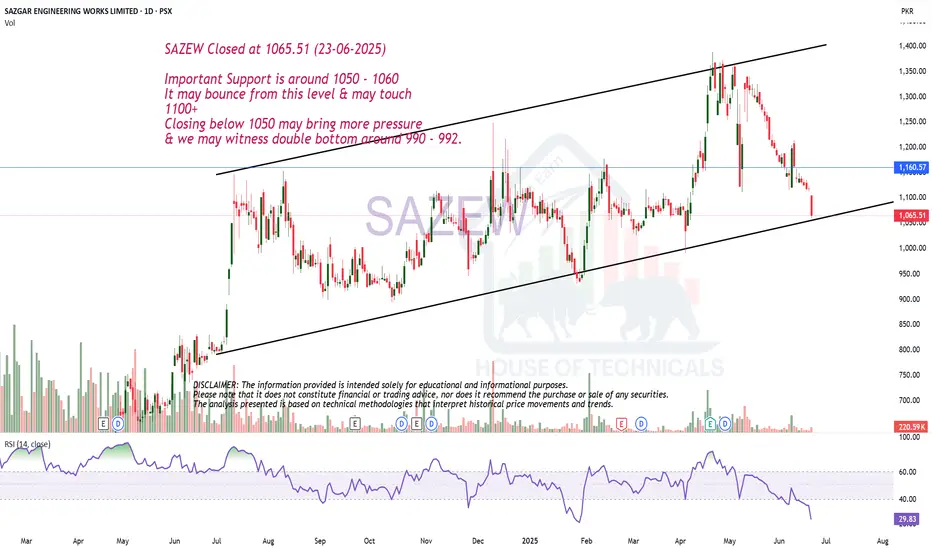
Channel Support SAZEW Closed at 1065.51 (23-06-2025)
Important Support is around 1050 - 1060
It may bounce from this level & may touch
1100+
Closing below 1050 may bring more pressure
& we may witness double bottom around 990 - 992.
a long consolidation / sideways box.CEPB Analysis
Closed at 37.48 (12-01-2026)
a long consolidation / sideways box.
Crossing 40 - 41 with Good Volumes &
sustaining it may lead the price towards 59 - 60.
Otherwise, it may continue its sideways movement, with
a Channel Bottom around 21 - 22.

Trading in a Parallel Channel!FEROZ Analysis
Closed at 422.29 (09-01-2026)
Trading in a Parallel Channel; where channel
bottom is around 380 - 390 & Channel Top is
around 520 - 540.
There is a mid way resistance around 440 - 460.
Breaking 360 will bring more selling pressure.

Adobe Stock AnalysisWeekly Timeframe (Chart A):
Price has completed a five-wave bearish structure.
After forming an ending diagonal pattern, price broke out of it with strong momentum.
This scenario is confirmed by strong divergences on both RSI and MACD.
Price now appears to be in a bullish corrective phase, which could extend at least toward the upper boundary of the minor weekly channel.
Lower Timeframe (Chart B):
Wave 5 of 5 ended with clear divergence.
A fake breakout above the channel high occurred during a very low-volume market period.
Price is currently correcting toward the marked demand zone.
This demand zone overlaps with the mid-range of a valid 4-hour channel.
After reacting to this area, price may move toward the channel high and attempt to break the key level.
NASDAQ:ADBE
This is just my personal view, so please trade based on your own strategy and trading system.
I’d be happy if you follow me on TradingView to see more analyses and live stock trades.

Bitcoin is heading towards $330,000.In the monthly and weekly timeframe, Bitcoin's target is $330,000 based on Mr. Albrooks price action.

Coforge Showing Bullish Setup Near Strong Support Zone Coforge – Daily Timeframe Technical View
The stock is trading within a well-defined parallel channel on the daily timeframe.
Within this channel, an Ascending Triangle pattern is forming, indicating accumulation and potential upside momentum.
Immediate Support Zone: ₹1,530–₹1,550
Long-Term Channel Support: ₹1,200–₹1,300
If the stock respects the pattern support, a breakout is possible, which could open the door for an upside move toward ₹2,850–₹2,900.
Alternatively, if the stock holds the channel support, it is likely to continue moving within the channel, maintaining the prevailing trend.
Thank You!!

NIFTY: Key Levels to Watch for the Next Move.This is the daily timeframe chart of NIFTY.
NIFTY is trading within a well-defined structure, with higher-low (HL) support levels placed at 25,800 and 25,550.
On the lower timeframe, the index is showing a trendline breakout near 25,950, indicating short-term strength.
Based on Fibonacci retracement, the key reversal and decision zone lies between 25,900–25,950. If this support zone breaks, the next important support is positioned near 25,800.
If these support levels hold, NIFTY may continue its upward move. According to Fibonacci extension, the potential upside targets are 26,380–26,450, while 26,600 remains a major resistance, aligned with channel resistance and extension levels.
Thank You ....

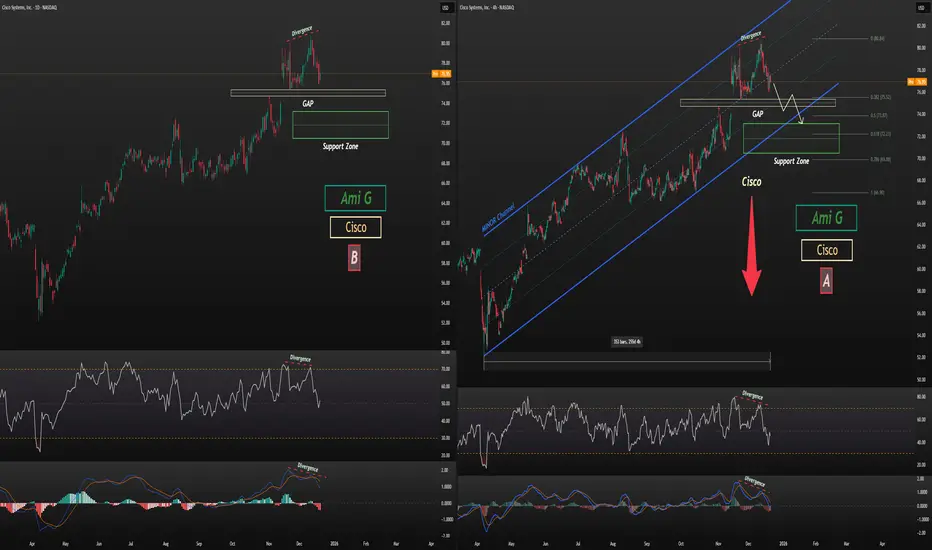
CSCO Correction TargetCisco (CSCO) Stock Analysis
As shown on the chart, Cisco is trading near the upper boundary of its 9-month channel. After forming two strong divergences on the 4H chart (Chart A) and the daily chart (Chart B)—confirmed by both MACD and RSI—the stock has entered a corrective phase.
Given the presence of a very strong gap marked on the chart, price is likely to correct at least toward the gap zone, and potentially extend further to the support zone, which may also align with the lower boundary of the 9-month channel.
Analysis will be updated.
Follow me on TradingView for more analyses and live stock trades.
NASDAQ:CSCO
Latest Gold Price Update TodayHello everyone, let’s take a look at the current trend of OANDA:XAUUSD .
As previously anticipated, XAUUSD continues to hold a steady recovery and remains firmly above the 4,300 USD level. At the time of writing, the precious metal is trading around 4,330–4,335 USD, maintaining a bullish structure within the main ascending price channel.
The U.S. dollar has softened slightly as the market continues to price in the possibility of monetary easing in the coming period. Cooling U.S. Treasury yields have further supported gold, allowing prices to stay elevated.
The 4,350–4,360 zone stands as the nearest resistance (weak high), which price needs to break in order to extend the upside momentum. On the downside, 4,300–4,310 is a key short-term support area, aligning with the lower trendline of the channel. If buying pressure is strong enough to clear 4,360, the next upside targets lie around 4,390–4,400. The preferred approach remains trading in line with the prevailing trend.
What’s your view on XAUUSD at this stage? Feel free to share your thoughts.

Sequent Scientific Ready for Bounce| Key Levels in Play . This is the daily timeframe chart of Sequent Scientific.
The stock is moving within a well-defined structure, showing strength despite a volatile market environment.
Key support levels: 200 and 170
EMA support: Near the 190 level
Resistance zone: Around 270
If these support levels sustain, the stock may witness a further upside move in the coming sessions.
Thank you.

ZM: buyers are back and momentum is buildingZoom Communications spent a long period outside investors’ focus after the post-pandemic correction, but the fundamental picture is gradually improving. The company remains profitable, holds a strong cash position, and carries no critical debt. Zoom continues to evolve from a single-product company into a broader enterprise communication platform, expanding Zoom Phone, Contact Center, and AI-driven business tools. As interest returns to stable SaaS models and the tech sector regains strength, ZM is starting to look undervalued again.
From a technical perspective, price is trading inside a rising channel. After an extended accumulation phase, buyers have confirmed their presence. Price holds above the 50 and 100 EMA, while the 200 EMA acts as long-term dynamic support. The recent impulse was supported by increasing volume, signaling institutional participation. Market structure remains bullish with higher lows intact.
The current area represents a confirmation and accumulation zone. As long as price holds above local support, adding to positions remains justified. The first target is the upper boundary of the channel and prior highs. If momentum accelerates, price may extend toward the next resistance zone, where partial profit-taking becomes reasonable. A breakdown below the confirmation zone would invalidate the bullish scenario.
Markets often move when they feel quiet. The key is being positioned before the move becomes obvious.

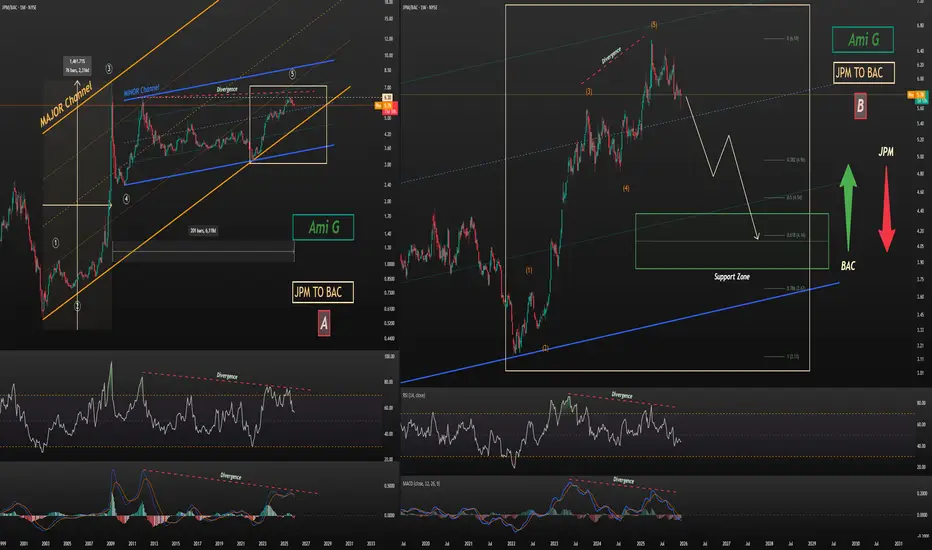
JPM vs BAC — Relative CheckRelative Analysis: JPMorgan vs Bank of America
Chart A (Monthly):
Over the past 8 years, JPMorgan has significantly outperformed Bank of America, completing a 3-wave Elliott structure and entering its Wave 4 correction, which has lasted 201 weeks. Price is currently contained within two major channels: the impulse (major) and a minor corrective channel.
Chart B (Weekly):
On the weekly chart, JPMorgan recently completed a 5-wave impulse in its last move and is now in a corrective phase. While the monthly supercycle Wave 5 does not appear fully complete, the relative chart indicates that Bank of America is likely to outperform JPMorgan over the next 1–2 years.
Conclusion / Implications:
During bullish phases → Bank of America may experience larger gains
During corrections → JPMorgan may face larger declines
Note: This is my personal analysis. I’d be happy to hear your thoughts!
Follow me on TradingView for more analyses and live stock trades.
NYSE:JPM
NYSE:BAC
ETH ANALYSIS – 1h📊 ETH ANALYSIS – 1h
🔥 1. Key Fact on the Chart
We have a very strong upward impulse that:
Breaked the upper band of the descending channel (blue)
Touched the upper line of the ascending channel (orange)
Was immediately rejected (long wick)
The MACD shows extreme overbought + potential divergence in the making
Such a move usually indicates a short squeeze + profit-taking → i.e., a temporary weakening and a retest of the breakout.
🎯 2. Price areas I see on your chart
Green (resistance/TP for longs):
3479–3490 – structural highs, strong resistance
3420 – local resistance
3375 – first real resistance after the breakout
Red (support/defense levels of the structure):
3338–3348 – first test zone after the breakout
3293 – key level — sustain = trend continuation
3180–3200 – consolidation zone broken (likely retest)
📉 3. What does the current wick mean?
This giant wick signals:
short liquidations
lack of demand for a continuation after the first resistance breakout
high probability of a return to the range
possibility of a retest of the breakout (around 3185–3210)
This doesn't look like a classic breakout with a continuation, but rather a fakeout and the need for a correction.
📈 4. Scenarios
➡️ Bullish (more likely if 3293 holds)
Price falls to the 3338–3293 zone
Builds a local HH/HL
Starts a move to 3375, then 3420
If 3420 breaks → target 3480–3500
➡️ Bearish (if price loses 3293)
Retest from the bottom of 3293
Return to the blue channel
Target: 3185–3200
If this level breaks → 3050–3080 (lower band of the channel)
📟 5. MACD
MACD is:
extremely stretched
signal line begins to collapse
histogram decreases after Explosion
→ This almost always means a local intraday high + a drop to support.

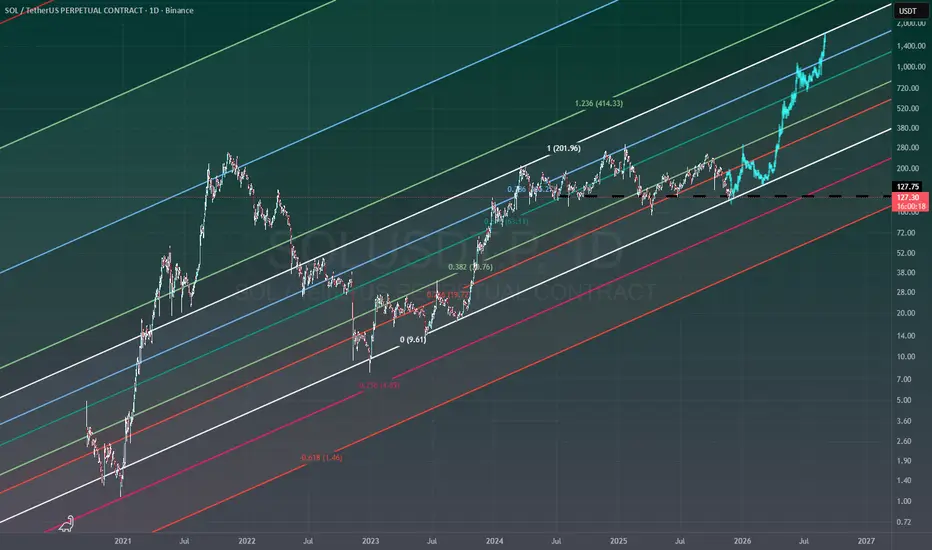
Decision time for #SOLAccording to fib channels, since 2020 September we only see one time degradation of SOL in late December 2020 which responded from -0.236 and starts its rally.
Now we are in the same zone . and have two different scenario in hand:
1. Fib 0 is trying to support the price once again. if we lose this support, price will see 75-80 support level around Fib -0.236 .
Do not want to share any worse scenario but it is also be catastrophic if price lose support of Fib -0.236 .
2. As a positive scenario, Until the end of 2027 we will see the price will rush to the Fib 1 (Approx 1K)
We will see which scenario is going to be validated, but just fingers are crossed for the 2nd scenario.
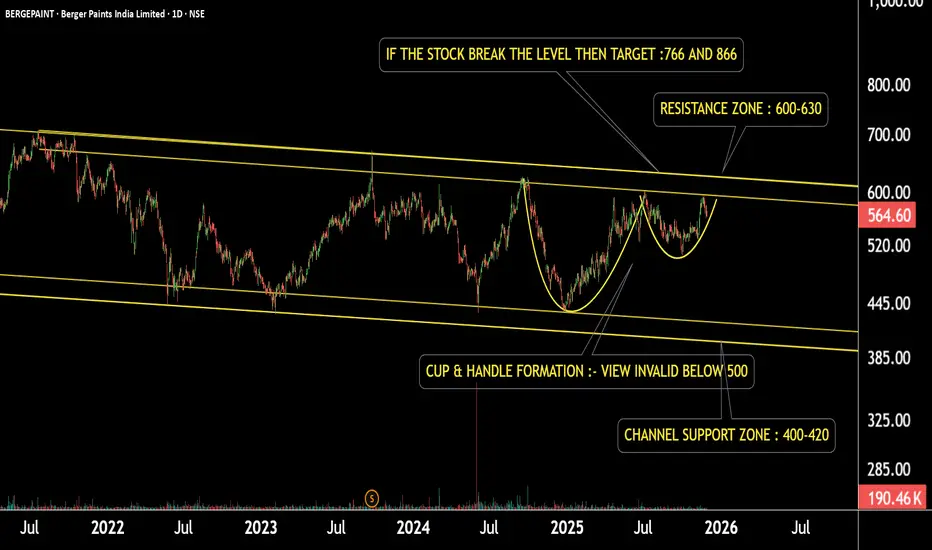
Berger Paints: Pattern Formation — Is This the BreakoutThis is the daily timeframe chart of Berger Paint.
The stock is moving within a well-defined channel and has formed a Cup & Handle pattern inside the structure.
If the pattern continues to hold and the price stays above ₹500, the pattern remains valid.
A breakout above the resistance may trigger potential upside targets of ₹766 and ₹866.
However, if the price fails and breaks below this zone, the stock may decline toward the channel support near ₹400.
Thank you.
Granules: Important Key Levels on RadarThis is the daily timeframe chart of Granules.
The stock is currently sustaining above the LOP support zone at ₹530–540.
As long as the price holds above this level, the bullish momentum is expected to continue.
However, if the stock breaks below this support, a decline toward the lower boundary of the channel may follow.
Thank you.

Max Healthcare Showing Strength Near Support ZoneThis is the daily timeframe chart of Max Healthcare.
The stock is moving within a well-defined channel and is currently trading near the support zone at 1090–1120.
Trendline resistance is placed near the 1200 level; a breakout above this zone may lead to new highs.
If the support zone holds, we may see higher prices in Max Healthcare.
Thank you !!

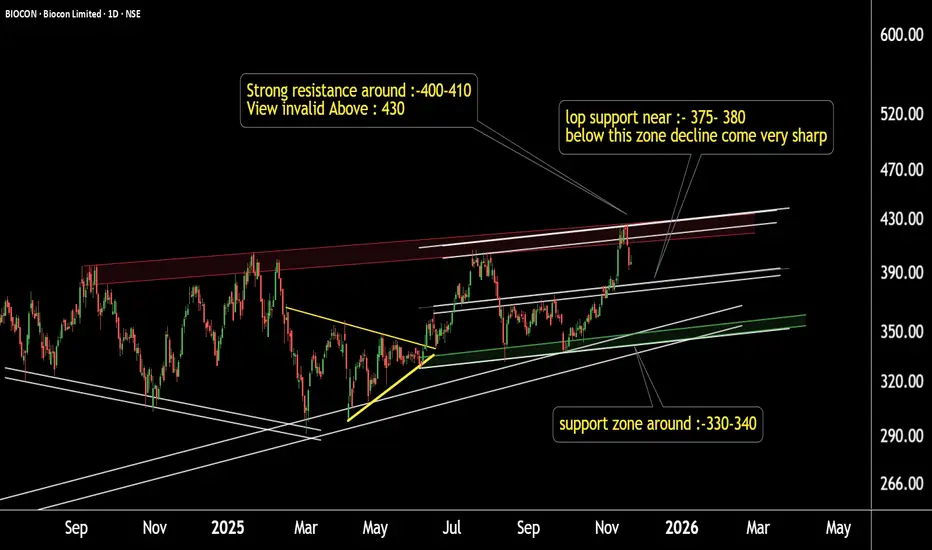
Biocon Under Heavy Selling Pressure — Momentum Turning WeakBiocon – Daily Timeframe Update
This is the daily timeframe chart of Biocon.
The stock is showing a sharp decline and may take a pause near its first LOP support at 370–380.
If this support breaks, the next strong support zone lies at 330–345, from where a potential reversal can be expected.
Thank you !!
MARICO Under Pressure — Sharp Fall on the Charts!This is the daily timeframe chart of MARICO.
MARICO is trading within a well-defined parallel channel and is currently falling from the upper resistance zone. This sharp decline may pause near the channel support.
The stock continues to respect the structure, with a key support zone around 700–710 and resistance in the 775–785 region.
If the current weakness extends, we may see a further drop toward the support area, followed by a potential bounce from those levels.
Thank you!!
