Sell GBP/USD Bearish Channel The GBP/USD pair on the M30 timeframe displays a potential selling opportunity due to a well-defined bearish channel pattern. This pattern suggests ongoing selling pressure and a higher likelihood of further declines in the coming hours.
Key Points:
Bearish Channel: The price has been trading within a descending channel characterized by two falling lines: a falling resistance line and a falling support line. This ongoing downtrend signals continued selling pressure.
Sell Entry: Consider entering a short position around the current price of 1.2590, positioned close to the channel resistance. This offers an entry point near a potential reversal zone.
Target Levels: Initial bearish targets lie at the support levels of 1.2502 and 1.2454, marking previous support zones within the channel.
Stop-Loss: To manage risk, place a stop-loss order above the broken channel resistance line at 1.2635. This helps limit potential losses if the trend unexpectedly reverses.
Thank you.
Channeltrend

EurUsd - Long Term ChannelHello Traders, welcome to today's analysis of EurUsd.
--------
Explanation of my video analysis:
Starting in 2008 EurUsd has been trading in a descending channel for more than 15 years. At the moment EurUsd is retesting the upper resistance of the channel so a move lower is quite expected. Furthermore EurUsd is also retesting previous support which is after the break towards the downside turned resistance so everything is pointing towards a next move lower.
--------
I will only take a trade if all the rules of my strategy are satisfied.
Let me know in the comment section below if you have any questions.
Keep your long term vision.

AVAX/USDT Bullish Channel In H4A chart of the AVAX/USDT currency pair on a 4-hour timeframe. The chart displays a Bullish channel pattern.
Bullish Channel : The Price has been Trading within a Bullish Channel for Some time, characterized by a resistance line at the top and a support line at the bottom.
The price is currently trading at Bottom of channel pattern, if Breaks the Downside then it start Bearish Sign.
However, it is still early to say whether this is a genuine breakout or a false signal.
Recent News:
Music industry eyes DeeStream presale after Ethereum and Avalanche whales join: This news suggests potential increased interest in the Avalanche network from institutional investors, which could be positive for AVAX price.
Thank you.

🟢🟢(GBP USD channel pattern breakout support level) short analyHello traders what do you think about GBP USD)
Technical analysis 🟢
traders are you looking 👀 big support channel patterns breakout? GBP USD 🟢
breakout support level 1.26000
retest support level pullback momentum bearish candle
1.24919)🟡 FX:GBPUSD
Short analysis signals 💯
FX:GBPUSD
Safe trade ❤🙏 plaes like ❣️ and comments follow next analysis 😀

VIPIND : Best Swing Trading OpportunityVIP Industries has given Zero Returns from last 3 years
VIP Industries Stock currently around the support which was working as Resistance.
Stock has also formed Falling channel in short term and now around 500 levels is coming support from these 2 factors.
So stock is around the support and looking good for swing trading !
Disclaimer : We are not SEBI registered analyst. Do your own research before taking any investment decision.
#stock #stockmarket #investing #money #finance #trading #investment #VIP #VIPIND

Sell GBP/USD Bearish ChannelThe GBP/USD pair on the M30 timeframe displays a potential selling opportunity due to a well-defined bearish channel pattern.
Sell Entry: Consider entering a short position around the current price of 1.2580, positioned close to the channel resistance. This offers an entry point near a potential reversal zone.
Target Levels: Initial bearish targets lie at the support levels of 1.2501 and 1.2453, marking previous support zones within the channel.
Stop-Loss: To manage risk, place a stop-loss order above the broken channel resistance line at 1.2615. This helps limit potential losses if the trend unexpectedly reverses.
Thank you.

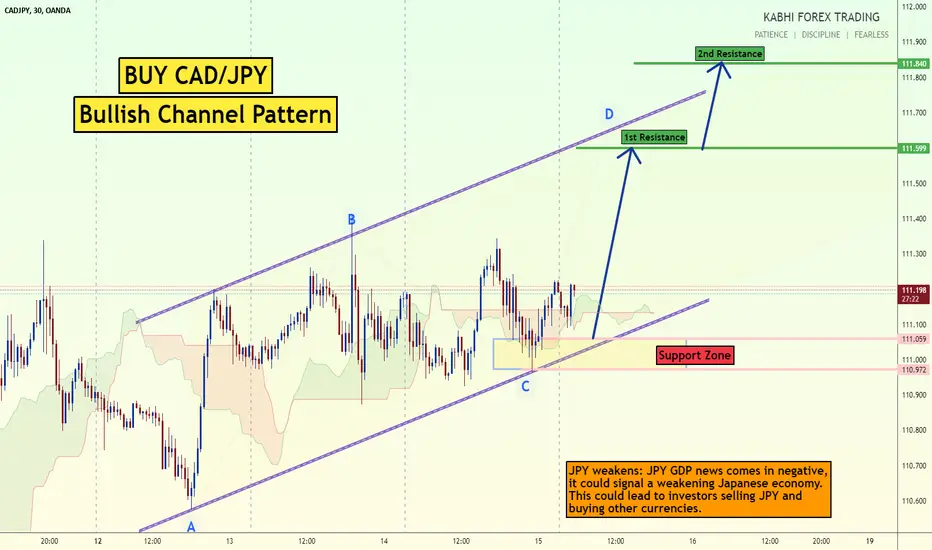
Buy CADJPY Bullish channelThe CAD/JPY pair on the M30 timeframe presents a potential buying opportunity due to a well-defined bullish channel pattern. This pattern suggests ongoing buying pressure and a higher likelihood of further advances in the coming minutes or hours.
Buy Entry: Consider entering a long position around the current price of 111.19, positioned close to the channel support. This offers an entry point near a potential continuation of the upward move.
Target Levels: Initial bullish targets lie at the resistance levels of 111.60 and 111.84, marking previous resistance zones within the channel.
Stop-Loss: To manage risk, place a stop-loss order below the support line of the channel at 110.90. This helps limit potential losses if the price reverses and breaks back down.
Thank you
BUY EURJPY Bullish Channel PatternThe EUR/JPY pair on the M30 timeframe displays a potential buying opportunity due to a well-defined bullish channel pattern. This pattern suggests ongoing buying pressure and a higher likelihood of further advances in the coming minutes or hours.
Key Points:
Bullish Channel: The price has been trading within an upward-sloping channel characterized by two converging lines: a rising support line and a rising resistance line. This ongoing uptrend signals continued buying pressure.
Buy Entry: Consider entering a long position around the current price of 161.50, positioned close to the channel support. This offers an entry point near a potential continuation of the upward move.
Target Levels: Initial bullish targets lie at the resistance levels of 162.02 and 162.35, marking previous resistance zones within the channel.
Stop-Loss: To manage risk, place a stop-loss order below the support line of the broken channel at 161.00. This helps limit potential losses if the price reverses and breaks back down.
Thank you

Sell USDCAD Bearish ChannelThe USD/CAD pair on the M30 timeframe exhibits a potential selling opportunity due to a well-defined bearish channel pattern. This pattern suggests ongoing selling pressure and a higher likelihood of further declines in the coming minutes or hours.
Key Points:
Bearish Channel: As visualized on the M30 chart, the price has been confined within a descending channel characterized by two falling lines: a resistance line and a support line. This ongoing downtrend signals continued selling pressure.
Sell Entry: Consider entering a short position around the current price of 1.3460, positioned close to the channel resistance. This offers an entry point near a potential reversal zone.
Target Levels: Initial bearish targets lie at the support levels of 1.3414 and 1.3396, marking previous support zones within the channel.
Stop-Loss: To manage risk, place a stop-loss order above the channel resistance line at 1.3485. This helps limit potential losses if the trend unexpectedly breaks upwards.
Thank you

Sell EURCAD Bearish ChannelThe EUR/CAD pair on the M30 timeframe exhibits a bearish signal due to a well-defined downward channel pattern, suggesting a potential selling opportunity in the coming minutes or hours.
Key Points:
Bearish Channel: The price has been confined within a descending channel characterized by two falling lines, one for resistance and one for support. This pattern indicates ongoing selling pressure and potential for further decline.
Sell Entry: Consider entering a short position around the current price of 1.4503, situated close to the channel resistance. This offers an entry point near a potential reversal zone.
Target Levels: Initial bearish targets lie at the support levels of 1.4465 and 1.4452, marking previous support zones within the channel.
Stop-Loss: To manage risk, place a stop-loss order above the channel resistance line at 1.4523. This helps limit potential losses if the trend breaks unexpectedly.
Thank you

TSLA Holding Bottom Range of ChannelTSLA looking like a good risk/reward spot here. Holding the bottom of this descending channel. RSI is oversold on the daily, and MACD looks like it wants to flip bullish. TSLA has been beaten down relentlessly since the start of the new year. Good spot for the tide to turn.

Sell USDJPY Bearish Channel The USD/JPY pair on the M30 timeframe displays a bearish signal due to a well-defined downward channel pattern, suggesting a potential selling opportunity in the coming minutes or hours.
Key Points:
Bearish Channel: The price has been confined within a descending channel characterized by two falling lines, one for resistance and one for support. This pattern indicates ongoing selling pressure and potential for further decline.
Sell Entry: Consider entering a short position around the current price of 148.03, situated close to the channel resistance. This offers an entry point near a potential reversal zone.
Target Levels: Initial bearish targets lie at the support levels of 147.37 and 147.03, marking previous support zones within the channel.
Stop-Loss: To manage risk, place a stop-loss order above the channel resistance line at 148.40. This helps limit potential losses if the trend breaks unexpectedly.

Buy XAUUSD Bullish ChannelThe XAU/USD pair on the M30 timeframe presents a potential buying opportunity due to a well-defined bullish channel pattern. This pattern suggests ongoing buying pressure and a higher likelihood of further advances in the coming minutes or hours.
Key Points:
Bullish Channel: The price has been trading within an upward-sloping channel defined by two converging lines: a rising support line and a rising resistance line. This ongoing uptrend signals continued buying pressure.
Buy Entry: Consider entering a long position around the current price of 2036.50, which sits close to the channel support. This could offer an entry point near a potential continuation of the upward move.
Target Levels: Initial bullish targets lie at the resistance levels of 2047.92 and 2054.50, marking previous resistance zones within the channel.
Stop-Loss: To manage risk, place a stop-loss order below the support line of the broken channel, around 2030. This helps limit potential losses if the price reverses and breaks back down.
Thank you

Sell GBPJPY Bearish ChannelThe GBP/JPY pair on the M30 timeframe exhibits a bearish channel pattern, suggesting a potential selling opportunity in the coming minutes or hours.
Key Points:
Bearish Channel: The price has been confined within a descending channel, characterized by two falling lines, one for resistance and one for support. This indicates ongoing selling pressure and potential for further decline.
Sell Entry: Consider entering a short position around the current price of 186.40, situated close to the channel resistance. This offers an entry point near a potential reversal zone.
Target Levels: Initial bearish targets lie at the support levels of 185.50 and 185.02, marking previous support zones within the channel.
Stop-Loss: To manage risk, place a stop-loss order above the channel resistance line at 186.90. This helps limit potential losses if the trend breaks unexpectedly.

Buy NZDJPY Bullish ChannelThe NZD/JPY pair on the M30 timeframe presents a potential buying opportunity due to a well-defined bullish channel pattern. This pattern suggests ongoing upward momentum and a higher likelihood of further advances in the coming minutes or hours.
Key Points:
Bullish Channel: The price has been trading within an upward-sloping channel defined by two converging lines: a rising support line and a rising resistance line. This ongoing uptrend signals continued buying pressure.
Buy Entry: Consider entering a long position around the current price of 90.05, which sits close to the channel support. This could offer an entry point near a potential continuation of the upward move.
Target Levels: Initial bullish targets lie at the resistance levels of 90.73 and 91.06, marking previous resistance zones within the channel.
Stop-Loss: To manage risk, place a stop-loss order below the support line of the broken channel, around 89.85. This helps limit potential losses if the price reverses and breaks back down.
Thank you

SELL NZDJPY Bearish ChannelThe NZD/JPY pair on the M30 timeframe presents a potential selling opportunity due to a well-defined bearish channel pattern. This pattern suggests ongoing downward pressure and a higher likelihood of further declines in the coming minutes or hours.
Key Points:
Bearish Channel: The price has been trading within a downward-sloping channel defined by two converging lines: a falling resistance line and a falling support line. This ongoing downtrend signals continued selling pressure.
Sell Entry: Consider entering a short position around the current price of 89.95, which sits close to the channel resistance. This could offer an entry point near a potential reversal point.
Target Levels: Initial bearish targets lie at the support levels of 89.30 and 88.92, marking previous support zones within the channel.
Stop-Loss: To manage risk, place a stop-loss order above the channel resistance line at 90.30. This helps limit potential losses if the downtrend breaks unexpectedly.
Fundamental Updates :
JPY - Service PMI - Now comes with Positive data.
Weaker New Zealand Business PMI: Recent data showed a decline in New Zealand's Business PMI for January, raising concerns about the country's economic health and potentially weakening the New Zealand Dollar (NZD).

Nvidia - How Long Will It LastHello Traders, welcome to today's analysis of Nvidia.
--------
Explanation of my video analysis:
All the way back in February of 2014 we saw a breakout of a long term symmetrical triangle on Nvidia. This breakout was followed by an insane +9.500% rally towards the upside. Right now Nvidia is trading in a solid ascending channel and is approaching the upper resistance trendline. I do expect a (short term) pullback from there to retest the support mentioned in the analysis.
--------
I will only take a trade if all the rules of my strategy are satisfied.
Let me know in the comment section below if you have any questions.
Keep your long term vision.

XAUUSD H4 Channel PatternThe XAU/USD pair on the H4 chart currently showcases a bearish channel pattern, hinting at potential selling opportunities in the coming days. However, a breakout above the channel could present potential buy opportunities.
Sell Opportunity:
1.A potential sell entry could be considered around the current price as it sits closer to the channel resistance. This allows for some buffer before a potential downward move.
2.Targets for the bear case would be the lower support line of the channel or potentially even lower depending on bearish momentum and confirmation from other technical indicators.
Shifting to Buy:
1.A break above the upper resistance line of the channel would signal a breakdown of the bearish trend, opening up potential buy opportunities.
2.Entry points for buying could be considered just above the broken resistance or on a retest of the broken line.
3.Targets for the bull case would be the previous swing highs within the channel or higher depending on bullish momentum and confirmation from other technical indicators.
Central Bank Decisions:
Federal Reserve (Fed) Meeting and Interest Rate Decision (Jan 31): A hawkish Fed with a large rate hike (75bps+) and strong economic projections could strengthen the USD, potentially putting downward pressure on gold. Conversely, dovish hints or smaller increases could boost its safe-haven appeal.
Bank of England (BoE) Meeting and Interest Rate Decision (Feb 2): A hawkish BoE could also strengthen the USD and weigh on gold. Dovish signals might offer some support.
US Non-Farm Payrolls (Feb 2): A robust US jobs report might reinforce hawkish Fed expectations and weigh on GBP/USD. Conversely, weaker data could dampen USD strength and lend some support to the pound.
If you found my post helpful or informative, could you please leave a comment 💬🖌 and hitting that like button💚💚
“Markets are never wrong, but opinions often are.”-Jesse Livermore
Good Luck💛💛
Thank you

GBPUSD H4 Bullish ChannelGBP/USD H4 Bullish Channel: Opportunities for Both Long and Short
The GBP/USD pair on the H4 chart currently exhibits a bullish channel pattern, offering potential short-term buy and sell opportunities depending on price action. Here's a breakdown:
Buy Opportunity:
1. A potential buy entry could be considered near the current price as it hovers closer to the channel support. This allows for some buffer before a potential bounce upwards.
2. Targets for the bull case would be the upper resistance line or potentially even higher depending on momentum and confirmation from other technical indicators.
Shifting to Short:
1. A break below the lower support line of the channel would signal a breakdown of the bullish trend, opening up potential sell opportunities.
2. Entry points for shorting could be considered just below the broken support or on a retest of the broken line.
3. Targets for the bear case would be the previous swing lows within the channel or deeper depending on bearish momentum and confirmation from other technical indicators.
Central Bank Decisions:
Federal Reserve (Fed) Meeting and Interest Rate Decision (Jan 31): This is the biggest event. A hawkish Fed with a large rate hike (75bps+) and strong economic projections could significantly strengthen the USD against the GBP. Conversely, dovish hints or smaller increases could favor the GBP.
Bank of England (BoE) Meeting and Interest Rate Decision (Feb 2): While the BoE is expected to raise rates again, the focus will be on the size (25bps or 50bps) and future policy guidance. Dovish pronouncements could weaken the GBP, while hawkish inclinations might offer some support.
US Non-Farm Payrolls (Feb 2): A robust US jobs report might reinforce hawkish Fed expectations and weigh on GBP/USD. Conversely, weaker data could dampen USD strength and lend some support to the pound.
If you found my post helpful or informative, could you please leave a comment 💬🖌 and hitting that like button💚💚
“Markets are never wrong, but opinions often are.”-Jesse Livermore
Good Luck💛💛
Thank you

Sell GBPCHF Bearish ChannelThe GBP/CHF pair on the M30 timeframe exhibits a bearish channel pattern, suggesting a potential selling opportunity in the coming minutes or hours. Let's delve deeper into the details:
Key Points:
Bearish Channel: The price has been trading within a downward-sloping channel defined by two converging lines: a falling resistance line and a falling support line. This pattern often indicates ongoing selling pressure and the potential for further decline.
Sell Entry: Consider entering a short position around the current price of 1.0940, which is close to the channel resistance. This could offer an entry point near a potential reversal point.
Target Levels: Initial bearish targets lie at the support levels of 1.0892 and 1.0867, marking previous support zones within the channel.
Stop-Loss: To manage risk, place a stop-loss order above the channel resistance line at 1.0965. This helps limit potential losses if the downtrend breaks unexpectedly.
Fundamental Updates :
UK Bank of England (BoE) meeting minutes: Due for release later today, these minutes could shed light on the central bank's future monetary policy stance. Hawkish signals might boost the Pound, while dovish ones could weaken it.
Swiss National Bank (SNB) Chairman Thomas Jordan's speech: Scheduled for tomorrow, February 2nd, any comments about potential interventions or the economic outlook could impact CHF sentiment.
Thank you

Buy XAUUSD Channel PatternGold (XAU/USD) might be gearing up for a climb, showcasing a bullish channel pattern on its H1 chart. This pattern suggests a gradual increase in buying pressure, potentially leading to a breakout towards higher prices.
Bullish Channel: The price has been oscillating within a channel with rising support and resistance lines, forming a Shape. This often indicates building buying pressure as the price range narrows.
Buy Entry: Consider entering a long position around the current price of 2023, which offers a potential entry point near the channel support.
Target Levels: Initial bullish targets lie at the resistance levels of 2043 and 2054, marking the upper boundaries of the channel.
Stop-Loss: To manage risk, place a stop-loss order below the channel support at 2013.
Key Points:
Weakening US Dollar: A potential slowdown in US interest rate hikes and concerns about the American economy could weaken the greenback, benefiting gold prices.
Geopolitical Tensions: Rising tensions in various regions like the Middle East and Ukraine could trigger risk aversion, driving investors towards safe-haven assets like gold.

Sell EURNZD Bearish ChannelEUR/NZD M30 Bearish Channel: Prepare for Potential Selling Opportunities
The EUR/NZD pair on the M30 timeframe presents a potential selling opportunity due to a well-defined bearish channel pattern. This pattern suggests ongoing downward momentum and a higher likelihood of further declines in the coming minutes or hours.
Key Points:
Bearish Channel: As illustrated in the image below, the price has been trading within a descending channel, characterized by two converging lines: a falling resistance line and a falling support line. This ongoing downtrend signals continued selling pressure.
Sell Entry: Consider entering a short position around the current price of 1.7691, which sits close to the channel resistance, potentially offering a favorable entry point near a potential reversal point.
Target Levels: Initial bearish targets lie at the support levels of 1.7562 and 1.7487, marking previous support zones within the channel.
Stop-Loss: To manage risk, place a stop-loss order above the channel resistance line at 1.7750. This helps limit potential losses if the downtrend breaks unexpectedly.
Thank yuou

Breakout for Canalaska?Is this a breakout for Canalaska? No retest of the channel yet and over head resistance at 0.67 and 0.84. In support: over 4x average volume on week commencing 25th September and a higher pivot high compared to Jul 22.
WARNING: This is not a recommendation to trade. Do your own research and decide your own trades.
