SOL Channel with Upper and Lower limitsThis is a curved projection channel created upon a bounding box. The chart is presented over a log price scale. For its creation we use 3 "moving averages" that cover the center, upper and lower limits for potential movement. Even if this not an attempt to forecast a trend or future scenario, it allows to have an easy to read view of probable limits and oscillation parameters.
Just sharing my personal charts for learning purposes only. This is not an investment recommendation.
Channeltrend

ADA Channel with Upper and Lower limitsThis is a curved projection channel created upon a bounding box. The chart is presented over a log price scale. For its creation we use 3 "moving averages" that cover the center, upper and lower limits for potential movement. Even if this not an attempt to forecast a trend or future scenario, it allows to have an easy to read view of probable limits and oscillation parameters.
Just sharing my personal charts for learning purposes only. This is not an investment recommendation.

BTC Channel with Upper and Lower limitsThis is a curved projection channel created upon a bounding box. The chart is presented over a log price scale. For its creation we use 3 "moving averages" that cover the center, upper and lower limits for potential movement. Even if this not an attempt to forecast a trend or future scenario, it allows to have an easy to read view of probable limits and oscillation parameters.
Just sharing my personal charts for learning purposes only. This is not an investment recommendation.

FIL Channel with Upper and Lower limitsThis is a curved projection channel created upon a bounding box. The chart is presented over a log price scale. For its creation we use 3 "moving averages" that cover the center, upper and lower limits for potential movement. Even if this not an attempt to forecast a trend or future scenario, it allows to have an easy to read view of probable limits and oscillation parameters.
Just sharing my personal charts for learning purposes only. This is not an investment recommendation.

KSM Channel with Upper and Lower limitsI have sold my KSM holdings . I know this seems like a bold move, but I prefer to move into another asset that looks more promising for this short period of time. I'm only sharing my action on it, not recommending it per se. I will probably buy back in a future, but not hold it now.
This is a curved projection channel created upon a bounding box. The chart is presented over a log price scale. For its creation we use 3 "moving averages" that cover the center, upper and lower limits for potential movement. Even if this not an attempt to forecast a trend or future scenario, it allows to have an easy to read view of probable limits and oscillation parameters.
Just sharing my personal charts for learning purposes only. This is not an investment recommendation.

ETHBTC Channel with Upper and Lower limitsThis is a curved projection channel created upon a bounding box. The chart is presented over a log price scale. For its creation we use 3 "moving averages" that cover the center, upper and lower limits for potential movement. Even if this not an attempt to forecast a trend or future scenario, it allows to have an easy to read view of probable limits and oscillation parameters.
It's ETH taking dominance of the crypto market?
Yes, even more! I "feel" this will go up until the top of the channel.
Just sharing my personal charts for learning purposes only. This is not an investment recommendation.

VTHO Channel with Upper and Lower limitsThis is a curved projection channel created upon a bounding box. The chart is presented over a log price scale. For its creation we use 3 "moving averages" that cover the center, upper and lower limits for potential movement. Even if this not an attempt to forecast a trend or future scenario, it allows to have an easy to read view of probable limits and oscillation parameters.
Just sharing my personal charts for learning purposes only. This is not an investment recommendation.

BNB Channel with Upper and Lower limitsThis is a curved projection channel created upon a bounding box. The chart is presented over a log price scale. For its creation we use 3 "moving averages" that cover the center, upper and lower boundaries for potential movement. Even if this not an attempt to forecast a trend or future scenario, it allows to have an easy to read view of probable limits and oscillation parameters.
You may find, in yellow dashed lines, an attempt to assert the lowest and highest price threshold.
Just sharing my personal charts for learning purposes only. This is not an investment recommendation.

BAT Channel with Upper and Lower limitsThis is a curved projection channel created upon a bounding box. The chart is presented over a log price scale. For its creation we use 3 "moving averages" that cover the center, upper and lower boundaries for potential movement. Even if this not an attempt to forecast a trend or future scenario, it allows to have an easy to read view of probable limits and oscillation parameters.
You may find, in yellow dashed lines, an attempt to assert the lowest and highest price threshold.
Just sharing my personal charts for learning purposes only. This is not an investment recommendation.

PAXG Channel with Upper and Lower limitsThis is a curved projection channel created upon a bounding box. The chart is presented over a log price scale. For its creation we use 3 "moving averages" that cover the center, upper and lower boundaries for potential movement. Even if this not an attempt to forecast a trend or future scenario, it allows to have an easy to read view of probable limits and oscillation parameters.
I have added a dotted line that represents a possible path and an uptrend movement. First, it could stay horizontal, and then begin a long bull run.
Just sharing my personal charts for learning purposes only. This is not an investment recommendation.

IOTX Channel with Upper and Lower limitsThis is a curved projection channel created upon a bounding box. The chart is presented over a log price scale. For its creation we use 3 "moving averages" that cover the center, upper and lower boundaries for potential movement. Even if this not an attempt to forecast a trend or future scenario, it allows to have an easy to read view of probable limits and oscillation parameters.
I have added a dotted path that represents a correction to the uptrend movement, but has weak fundamentals to support it. It's rooted onto the idea that the upper curved channel reached a limit and has to correct first, then later attempt to keep the bull route.
Just sharing my personal charts for learning purposes only. This is not an investment recommendation.

NBS Channel with Upper and Lower limitsThis is a curved projection channel created upon a bounding box. The chart is presented over a LOG price scale. For its creation we use 3 "moving averages" that cover the center, upper and lower boundaries for potential movement. Even if this not an attempt to forecast a trend or future scenario, it allows to have an easy to read view of probable limits and oscillation parameters.
Given present boundaries, averages, common resistance and supports the value could easily go up to 2.5X. Given the bull "spikes" and bear "retreats" of this coin, if I invested in it, I would only operate with several distributed programmed operations in place.
Just sharing my personal charts for learning purposes only. This is not an investment recommendation.

USDT.D Channel and LevelsThis are several channel levels that allow a simple strategy for increasing or decreasing the crypto portfolio. Closer to the top you can increase your crypto portfolio and below the neutral zone you can start selling your crypto and have full STABLE coins on the lowest level (red).
I've added a curved channel to give some potential constrain to the index oscillation.
Actually I'm using the USDT dominance, among others, to detect the general risk mood of the crypto investors.
Even if this not an attempt to forecast or recommend an investment, it allows to have an easy to read view of probable conditions of the market. Just sharing my personal charts for learning purposes.


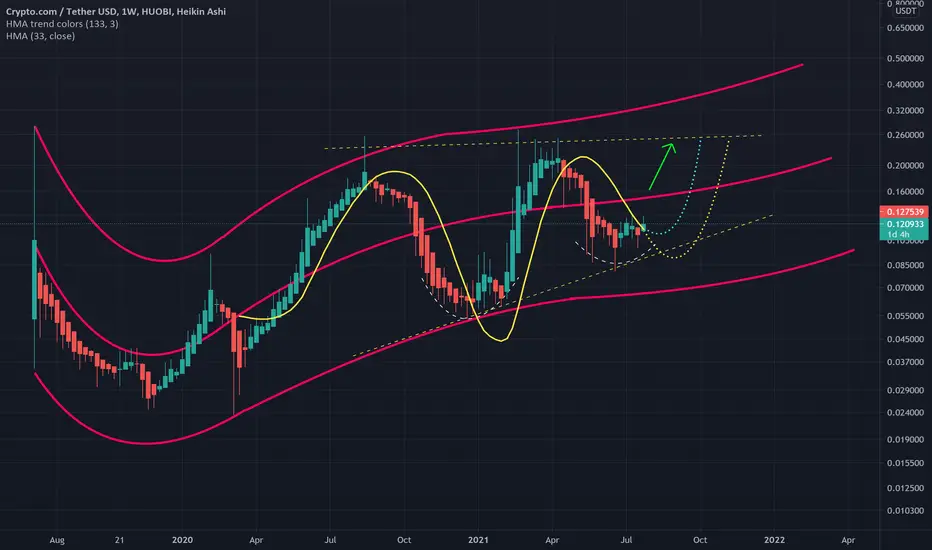
CRO Channel with Upper and Lower limitsThis is a curved projection channel created upon a bounding box. For the creation of the chart, we use 3 "moving averages" that cover the center, upper and lower boundaries for potential movement. Even if this not an attempt to forecast a trend or future scenario, it allows to have an easy to read view of probable limits.
Just sharing my personal charts for learning purposes only. This is not an investment recommendation.
MATIC Channel with Upper and Lower limitsThis is a curved projection channel created upon a bounding box. For the creation of the chart, we use 3 "moving averages" that cover the center, upper and lower boundaries for potential movement. Even if this not an attempt to forecast a trend or future scenario, it allows to have an easy to read view of probable limits.
This is an update to a previous publishing that changed drastically.
Just sharing my personal charts for learning purposes only. This is not an investment recommendation.

ETH Channel with Upper and Lower limitsThis is a short period channel for ETH that shows a probable trajectory between this circular boundaries.
For the creation of the chart, we use 3 "moving averages" that cover the center, upper and lower boundaries for potential movement. Even if this not an attempt to forecast a trend or future scenario, it allows to have an easy to read view of probable limits.
Just sharing my personal charts for learning purposes only. This is not an investment recommendation.


BTC updateBTC regardless of what has been said in news etc. has no power to push price higher.
Every attempt to go higher meets strong bearish candle.
BTC is still trading in channel. In my opinion the BTC will try to breach 30k again in near future. It might be short lived but whatever will happen it should established some more reliable support .
This chart for time being look like perfect example from the book, fully harmonic without any sudden spikes out of proportions

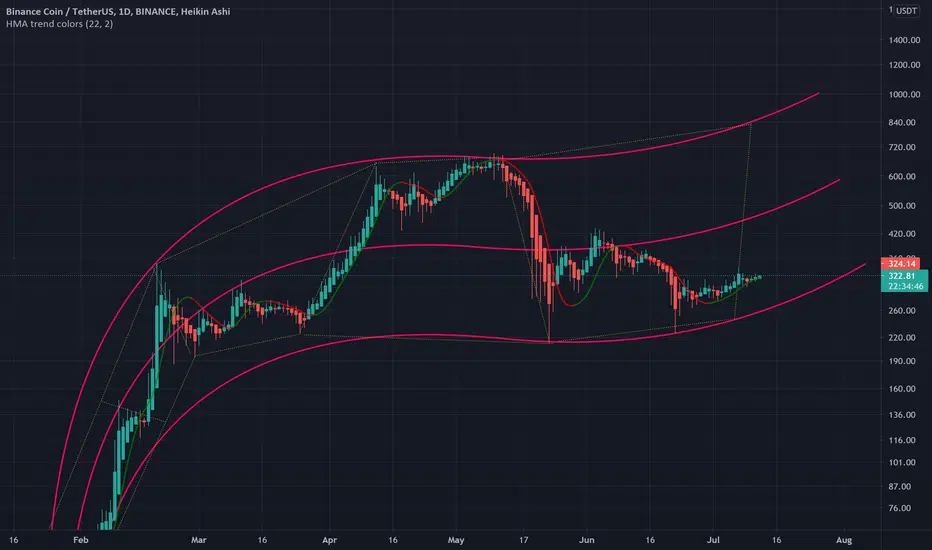
BNB Channel with Upper and Lower limitsThis is a curved projection channel created upon a bounding box. For the creation of the chart, we use 3 "moving averages" that cover the center, upper and lower boundaries for potential movement. Even if this not an attempt to forecast a trend or future scenario, it allows to have an easy to read view of probable limits.
Just sharing my personal charts for learning purposes only. This is not an investment recommendation.
$Band trading within huge trend channel.Band trading inside a massive trend channel dating back to August 2nd, 2020. Recent exaggerated bullish divergence formed from the 19th of May 2021 to the 22nd of June 2021, followed by a trend reversal from the bottom of the channel. Price following upwards trend line within the channel, keep an eye. Dollar cost average on dips, take profits at targets. Good luck.

SXP Channel with Upper and Lower limitsThis is a curved projection channel created upon a bounding box. For the creation of the chart, we use 3 "moving averages" that cover the center, upper and lower boundaries for potential movement. Even if this not an attempt to forecast a trend or future scenario, it allows to have an easy to read view of probable limits.
Just sharing my personal charts for learning purposes only. This is not an investment recommendation.

FLM Channel with Upper and Lower limitsThis is a curved projection channel created upon a bounding box. For the creation of the chart, we use 3 "moving averages" that cover the center, upper and lower boundaries for potential movement. Even if this not an attempt to forecast a trend or future scenario, it allows to have an easy to read view of probable limits.
Just sharing my personal charts for learning purposes only. This is not an investment recommendation.
