GBPJPY POSSIBLE SELL SETUP 📉 GBPJPY – Possible Rejection at 200.200 Resistance
Description:
GBPJPY is currently approaching a key supply/resistance zone around 200.200. Price has shown a break of structure (BOS) earlier, and now it may retest before continuing lower.
Resistance zone: 200.000 – 200.200
Potential entry: Around 200.000 (waiting for confirmation of rejection).
Target zone: 198.200 – 198.500
Stop Loss: Above 200.600
Bias:
I’m bearish on GBPJPY unless the price closes above 200.600.
Risk Note:
⚠️ This is just analysis, not financial advice. Always manage risk properly.
I share analysis like this regularly. If you find it useful, feel free to follow me here on TradingView for more updates 🙌.
Chartanalysis

Energy Giant on Fire – GAIL Ready for TakeoffThis is the 4-hour timeframe chart of GAIL India Limited.
The stock is currently trading within a well-defined parallel channel and is positioned near its support zone at 165–171.
If this support level sustains, we may witness higher prices in GAIL, with potential targets in the 185–190 range.
Thank you.

XAUUSD – Is a Reversal Coming?Gold is approaching a key level in the Crab pattern and may face a short-term reversal. The current price around 3,635 USD might struggle to break through the resistance level. According to the analysis, gold could potentially pull back to support levels at 3,560 – 3,440 USD.
👉 What do you think about the current situation of gold? Will the price reverse before continuing the upward trend? Share your thoughts in the comments!

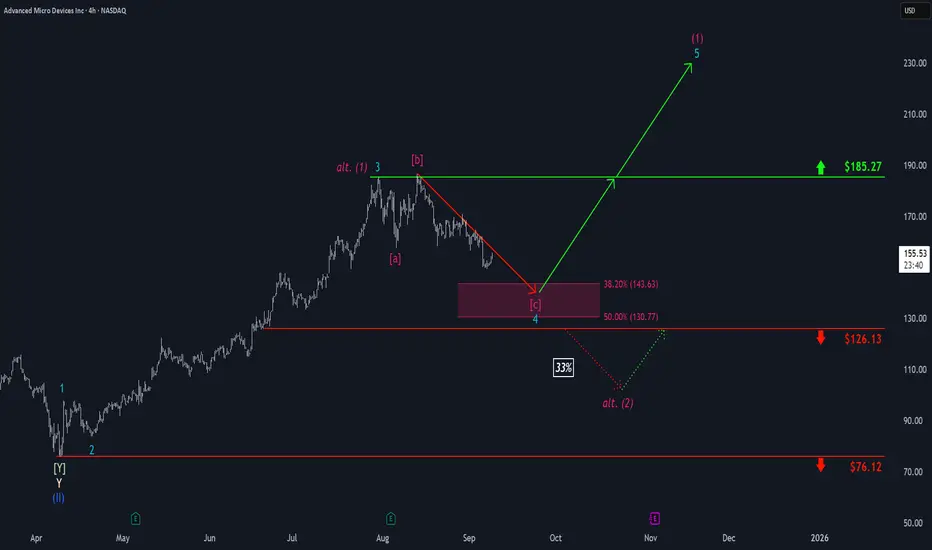
AMD: Drawing Closer...Step by step, AMD has been drawing closer to our magenta Target Zone between $143.63 and $130.77, which remains a favorable range for long entries. Prices should establish the low of turquoise wave 4 within this zone before reversing higher to resume the ongoing upward impulse—initially breaking above resistance at $185.27 and targeting the peak of magenta wave (1). However, we see a 33% chance that magenta wave alt. (1) has already completed, with a quicker low for wave alt. (2) likely to form below support at $126.13. Due to this alternative scenario, potential long trades within the magenta zone could be protected with a stop either 1% below the lower boundary of the zone or at the $126.13 level.
Tesla: New Alternative Scenario Emerges Tesla continues to face significant upward pressure, repeatedly testing resistance at $373.04. As a result, we have dropped our previous alternative scenario of an early sell-off in favor of a new upside alternative. We now see a 37% chance that the stock will break above the $373.04 resistance, forming an early top for beige wave alt.x above the next key level at $405.54. However, our primary expectation is that TSLA will first pull back into our green Target Zone between $273.11 and $231.66, where we anticipate the low of green wave . Thus, this range could present new short- to medium-term long entry opportunities to capitalize on the subsequently expected rally, which is likely to culminate in the regular wave x high above $405.54. Following this top, we expect the final sell-off phase within the broader corrective structure: wave y should drive price down into the beige Target Zone between $157.88 and $46.70, where we project the low of blue wave (II). This range could present attractive opportunities for longer-term long positions. For potential long trades—whether in the green or the beige zone—a stop set 1% below the lower boundary of the respective zone can help manage risk.

XRP: Lacks Momentum Despite Modest GainsRipple’s XRP is trading slightly higher today compared to last Monday, but it still hasn’t found real momentum. For now, it’s expected to continue moving upward toward resistance at $4.09 as part of turquoise wave B, before the correction of wave (2) is finally completed. The following magenta wave (3) should then drive gains above the $4.09 resistance level. If the altcoin manages to break directly above this level, this will suggest that wave alt.(2) has already wrapped up.

$MRNA I might full port..Everything is noted in the chart for visualization. We have local resistance around $27 which I don't think is an issue. This name is at 5 year lows with an incredible 67% haircut over the span of a year and change, if that. NASDAQ:MRNA just crushed its last earnings beat and it dropped. A controlled and manipulated drop in my opinion. Healthcare names may have a beautiful end of the year. This is a great name to acquire for mid to long term portfolios just in shares itself. I personally will be entering calls for dated out. I am currently in $30 calls for 10/17 expiration. I expect this name to make a full 100% recovery into the psyche level of $50 in the months to come.

American Express: Momentum StallingAmerican Express shares recently managed to further extend green wave C before shifting into a period of sideways movement. However, the stock is expected to resume its climb toward the high of beige wave b in the near term. After that, our primary scenario calls for a sharp pullback, which would bring price down into our blue long Target Zone between $205.35 and $167.99. We anticipate this range will mark the final low of the blue corrective wave (IV). If the stock instead maintains its momentum and decisively breaks through resistance at $397.21, the bullish alternative scenario will be triggered (probability: 38%). In that case, blue wave alt.(IV) would be considered already complete.

Risky NZDUSD Trade RecapThis setup wasn’t the cleanest, but sometimes calculated risk pays off.
📉 Setup:
Price was in a clear downtrend, making this buy counter-trend.
Demand zone around 0.5818 offered a possible bounce.
Break of the descending trendline gave early confirmation.
✅ Entry: 0.58189
❌ SL: 0.57964
🎯 TP: 0.59420 – 0.59490 supply zone
📊 Outcome:
Despite the risk of fading the trend, price respected demand, broke structure, and ran straight into my supply target at 0.5940+ for full profits.
⚠️ Not every trade will be textbook perfect — but with proper risk management, even the risky ones can pay off.
#NZDUSD #ForexTrader #RiskManagement #RiskyTrade #PriceAction #SmartMoneyConcepts #ForexJourney #MarketStructure

(BTCUSD) 4H Chart Analysis – Potential Bullish Continuation4H Bitcoin/USD Chart Analysis
📉 Current Price Action:
Bitcoin is currently trading around $110,956, showing a minor pullback after a recent upward push. Price is hovering just above a critical zone made up of:
⚫ Fair Value Gap (FVG)
🟫 4H Order Block (OB) around $110,413 – $110,001
📊 Technical Outlook:
📍 Retracement Expected:
The chart suggests a potential short-term retracement into the FVG and H4 OB zone. This area is a strong demand zone where buyers may step in. 📥
📈 Bullish Continuation Setup:
If price respects this zone and finds support, we can anticipate a bullish continuation 🚀 targeting the liquidity level around $113,372. This is a logical target as it's likely to attract price action (liquidity grab).
🎯 Key Levels to Watch:
Support Zone: $110,413 – $110,001 (FVG + OB) ✅
Resistance / Target: $112,960 and $113,372 🧲
Invalidation: Break below $110,001 may invalidate this setup ❌
📌 Summary:
Bitcoin looks poised for a bounce from the demand zone before making a move toward the liquidity above. Traders may look for confirmation signals (e.g., bullish candles) in the FVG/OB area for a potential long entry. 📊📈
🧠 Risk management is key—wait for confirmation!

$BTC Milestone Alert & Price will hit $128K or $88K in Sep, 2025✨Bitcoin Milestone Alert & Price will hit $128K or $88K in September or October 2025 🚀
CRYPTOCAP:BTC has now stayed above the $100K level for 122 consecutive days. Price will Bounce Back to $105K to $128K Range and if drop retest it will be the $88K-$92K Zone otherwise PUMP ongoing.
That’s over 4 months of holding six-figure territory, proving that $100K isn’t just a breakout, it’s becoming a new market baseline.
The question isn’t if Bitcoin can hold, but what’s next from here?
REMINDER: Hidden bullish divergence could confirm on today’s weekly close. Mega-bullish for Bitcoin. Q4 Will be explosive. Millionaires will be created. You just have to stay in the game. Do you understand?
Q4 Will be explosive. Millionaires will be created. You just have to stay in the game. Do you understand?
📊 This September Big Economic Week Incoming
• Tuesday (Sept 9): U.S. Non-Farm Payrolls Annual Revisions
• Wednesday (Sept 10): U.S. PPI (Producer Price Index)
• Thursday (Sept 11): U.S. CPI (Consumer Price Index) & ECB Rate Decision
🌍 EXPECT VOLATILITY!
#Write2Earn #BinanceSquareFamily #Binance #BTC☀ #SUBROOFFICIAL
Disclaimer: This article is for informational purposes only and does not constitute financial advice. Always conduct your own research before making any investment decisions. Digital asset prices are subject to high market risk and price volatility. The value of your investment may go down or up, and you may not get back the amount invested. You are solely responsible for your investment decisions and Binance is not available for any losses you may incur. Past performance is not a reliable predictor of future performance. You should only invest in products you are familiar with and where you understand the risks. You should carefully consider your investment experience, financial situation, investment objectives and risk tolerance and consult an independent financial adviser prior to making any investment.

U.S. Dollar Index (DXY) Outlook | Gold (XAU/USD) Correlation📈 U.S. Dollar Index (DXY) at Key Support | 🪙 Gold at Record Highs
🔎 Quick Summary:
• DXY holding 97.70 support inside a descending channel.
• A rebound could push it back toward 98.25 – 98.50.
• Meanwhile, Gold is sitting near $3,600/oz, at all-time highs, fueled by safe-haven demand and central bank buying.
• The DXY’s next move will help decide if Gold keeps climbing or pauses.
⸻
💵 U.S. Dollar Index (DXY) Outlook
On the 4H chart, the Dollar Index remains inside a descending channel. It has been forming lower highs and lower lows, yet the 97.70 level has repeatedly held as strong support.
• 🔹 Buyers are defending this zone, showing demand.
• 🔹 A rebound could take price back to the 98.25 – 98.50 supply zone.
• 🔹 A breakout above 98.50 would be significant, opening room toward 99.00+.
This makes the 97.70 region a critical turning point for DXY.
⸻
🪙 Gold (XAU/USD) Context
Gold is trading at record highs around $3,600/oz 🚀 — a level never seen before.
• 🌍 Central banks continue to accumulate gold aggressively.
• 🏦 Expectations of Fed rate cuts reduce the opportunity cost of holding gold.
• ⚖️ Persistent economic and geopolitical uncertainty is fueling safe-haven demand.
Correlation with DXY:
• 📉 If the Dollar rebounds, Gold could slow down or consolidate after its massive rally.
• 📈 If the Dollar breaks below support, Gold could see further upside, possibly testing higher targets near $3,700/oz and beyond.
⸻
📊 Conclusion
The Dollar Index is sitting at make-or-break support. A bounce would show Dollar strength and may cool off Gold’s rally. But if DXY weakens further, Gold could extend its surge into new record territory.
At this point, Gold remains the undisputed leader in the market, with DXY’s next move likely deciding how fast momentum continues.
⸻
⚡ Summary in one line:
💵 DXY at critical support — 🪙 Gold shining at record highs, waiting for the Dollar’s next move.

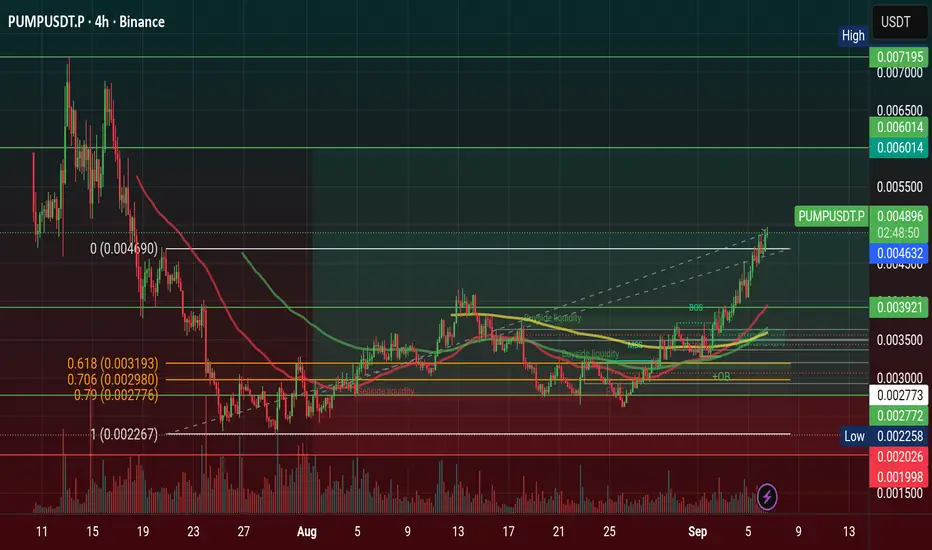
$PUMP Parabolic Starting & if Break ATH price hit $0.011 in 2026🚀 NYSE:PUMP Parabolic Starting & if Break ATH price hit $0.011 in 2026
IN 2026 PUMP will be happened break ATH and my Prediction $0.006 price area will be breaks after Price will stay accumulation in previous ATH areas. In 2026 price could hit $0.011 and 0.008 areas.
Pump.fun Executes $62M Token Buyback as Class-Action Lawsuit Looms
The platform generated more than $775 million in revenue since launch, according to DefiLlama, though income briefly slumped in late July, when weekly revenue fell to $1.72 million- its lowest lev el since March 2024. At its peak in May, weekly revenue topped $56 million, coinciding with a surge of Solana memecoins that briefly pushed SOL itself above $200, its highest level since late 2021.
Market Impact and User Growth
The buybacks appear to be lifting sentiment. PUMP has gained 12% in the past month and 9% in the past week, trading at $0.003522 — up 54% from an August low of $0.002282. The number of unique PUMP holders has climbed to more than 70,800, with smaller accounts holding under 10,000 tokens now making up nearly half of distribution, pointing to stronger retail participation. Blockchain explorer Solscan shows wallet activity on Pump.fun has nearly doubled since May, with daily active users averaging 48,000 compared with 25,000 earlier in the year.
#Write2Earn #PUMP #TrumpTariffs #highlight #SUBROOFFICIAL
Disclaimer: This article is for informational purposes only and does not constitute financial advice. Always conduct your own research before making any investment decisions. Digital asset prices are subject to high market risk and price volatility. The value of your investment may go down or up, and you may not get back the amount invested. You are solely responsible for your investment decisions and Binance is not available for any losses you may incur. Past performance is not a reliable predictor of future performance.
Bitcoin: Edges HigherToday, Bitcoin is once again trading slightly higher than it was at the time of our update yesterday. As a result, it remains possible that price could soon make another move into the upper blue Target Zone ($117,553 – $130,891), so green wave B can form its final high. The subsequent wave C is then expected to drive BTC down significantly—ultimately completing the larger wave a and thus the first phase of the three-part wave (ii) correction in the lower blue zone ($62,395 – $51,323). Additionally, our alternative bullish scenario remains relevant. We currently estimate a 32% chance that Bitcoin is still advancing within blue wave alt.(i) and will climb into the orange alternative Target Zone ($148,363 – $168,443) to complete this move.

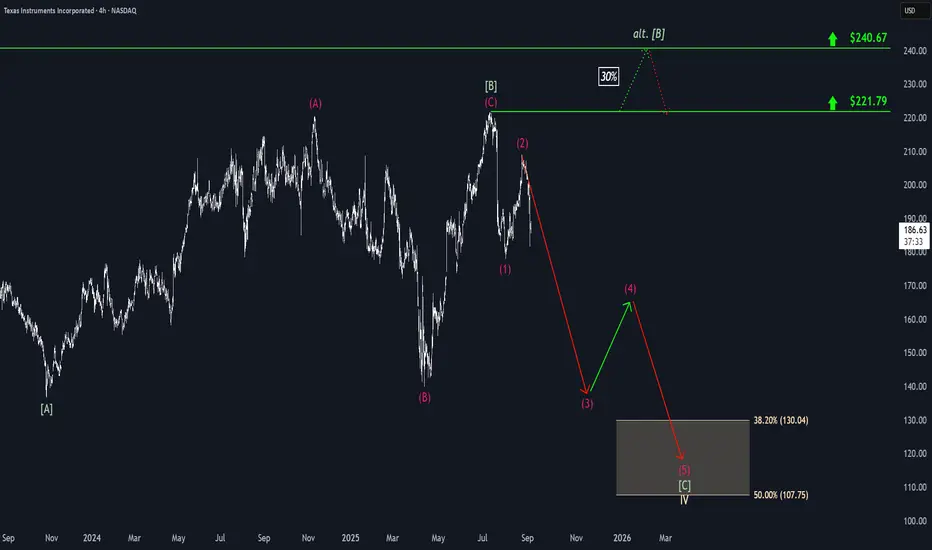
Texas Instruments: Second Leg Down CompleteTexas Instruments has experienced sharp sell-offs, leading us to confirm the top of magenta wave (2). This suggests that the stock has completed the second stage of the ongoing magenta downward impulse. The current wave (3) still presents significant downside potential in the near term. After a brief recovery in wave (4), wave (5) is expected to reach our beige Target Zone between $130.04 and $107.75. A new corrective high in green wave alt. above $221.79 could delay this process. However, in this 30% likely scenario, TXN should reverse course at the latest by the $240.67 level.
Gold Price Action: Liquidity Sweep & Bullish ContinuationThis is a 30-minute chart for Gold (XAU/USD) with a smart money concept (SMC) analysis. Here's a short breakdown:
🔍 Key Analysis:
Sweep Liquidity (Highlighted Area):
Price previously swept liquidity above recent highs, indicating a stop-hunt or liquidity grab before reversing.
Current Market Structure:
Strong bullish impulse move upwards.
Followed by a retracement (small bearish candle) indicating potential pullback in play.
OB M30 (Order Block - 30 Min):
Marked as a demand zone.
Price is expected to retrace into this OB area (around 3,550–3,560) before a continuation upward.
Projected Path:
Blue arrows suggest price may dip to the OB, gather demand, then rally back up toward the ATH (All-Time High) zone at 3,597.451.
🧠 Smart Money Insight:
Sweep + OB Combo is a typical SMC setup for a long position.
If price respects the OB zone, there's a high probability of continuation to new highs.
✅ Bias: Bullish
Entry idea: Look for long setups near OB M30 zone (3,550–3,560), targeting ATH and beyond.
Let me know if you want risk-reward details or stop loss/entry suggestions

BTCUSD: Price Drop to Support line of WedgeHello everyone, here is my breakdown of the current Bitcoin setup.
Market Analysis
From a broader perspective, the price action for Bitcoin has been bearish since the rejection from the Resistance Zone near the 122000 level. This initiated a downtrend that has since evolved from a channel into the current Downward Wedge pattern, which has been guiding the price through a series of lower highs and lower lows.
Currently, the price is at a critical decision point. After a bounce from the lower part of the wedge, it has rallied correctly and is now directly testing the descending resistance line of the formation.
My Scenario & Strategy
My scenario is based on the expectation that this Downward Wedge is a continuation pattern and the dominant downtrend will resume. I'm looking for the price to be rejected from the wedge's resistance line. A confirmed failure to break higher would signal the start of the next impulsive move down. This move is expected to have enough momentum to break through the intermediate Support zone around the 109600 level.
A breakdown below the 109600 support zone would validate the scenario. The primary target for this move is 105700 points, which aligns perfectly with the lower support line of the wedge pattern.
That's the setup I'm tracking. Thank you for your attention, and always manage your risk.

GOLD - current support ? Holds or not??#GOLD... Perfect move as per our analysis and now market have 3541-42 as im ediate supporting area
Keep close and if market hold it in that cDe we can expect further bounce.
Good luck
Trade wisley

Microstrategy: Further DeclineAfter a brief consolidation, MSTR continued its decline since our last update, further developing turquoise wave 2, where we still see price positioned. We continue to anticipate the low of this wave above the support at $153.49. In the meantime, we have revised the magenta substructure of wave 2 to a - - formation, with the final (wave- ) leg currently unfolding. Once turquoise wave 2 completes, we expect a strong rally above resistance at $674.18, which should significantly advance the broader upward impulse. However, under our new alternative scenario, a different wave count could prevail: price may currently be forming magenta wave alt. to the upside, developing a blue three-part substructure in the process. In this 25% likely scenario, the next move would be for blue wave alt. (b) to finish within the nearby blue alternative Target Zone between $306.60 and $252.67, before wave alt. (c) pushes up toward the top of magenta wave alt. near $674.18. Within this alternative, the blue zone could offer long entry opportunities, though heightened caution is warranted: since this remains only an alternative scenario, risk is elevated, and we consider strict risk management—such as setting a stop 1% below the lower edge of the zone—absolutely essential.

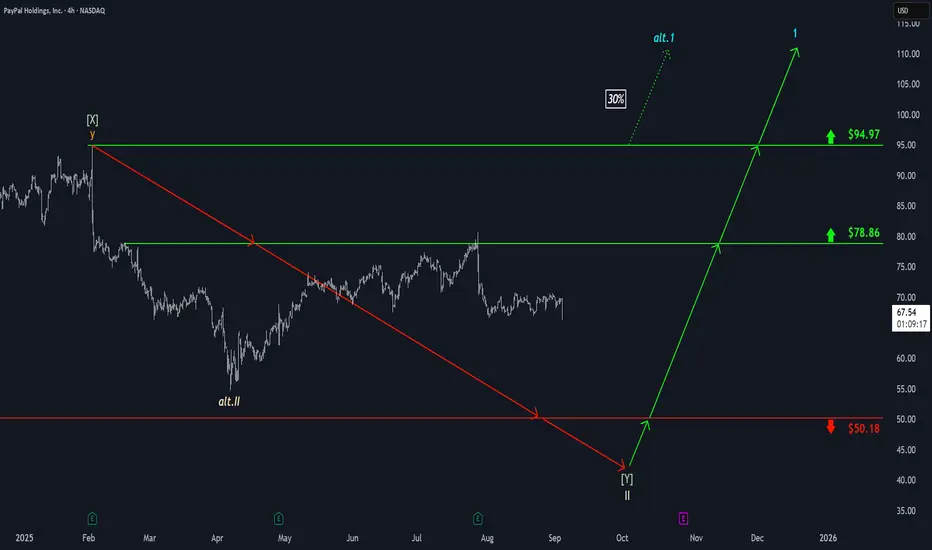
PayPal: Stuck in Consolidation—Breakout or Breakdown Ahead?We expect PayPal to eventually break out of its current consolidation to the downside to complete the larger correction of beige wave II below the $50.18 support level. Alternatively, it’s possible that PYPL already finished wave alt.II back in April, which could set the stage for an early upside breakout—first above the $78.86 resistance and then even beyond the higher $94.97 level (probability: 30%).
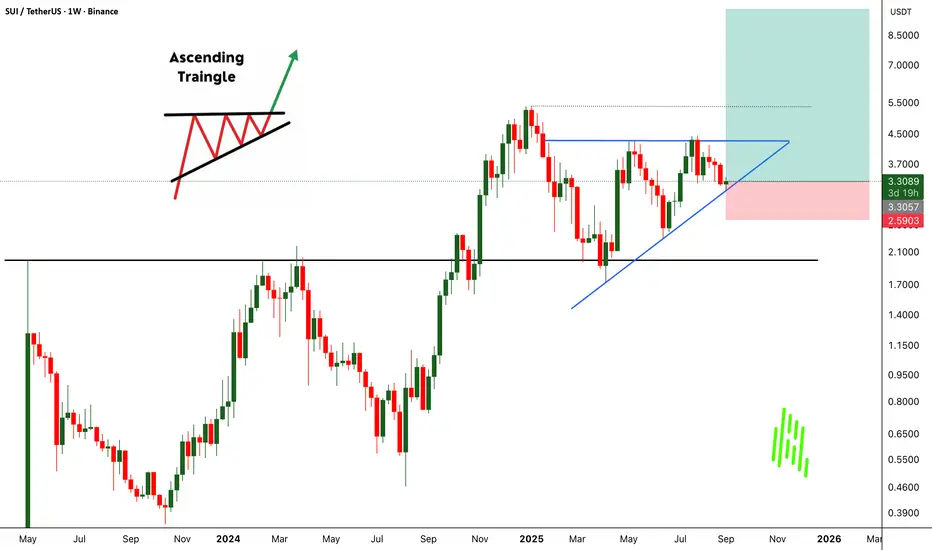
SUIUSDT Weekly Outlook!! Target $10CRYPTOCAP:SUI has once again bounced strongly from its key support zone, making it the third touch at this level. Each time price defends this area, it reinforces the strength of buyers stepping in, showing that demand remains intact.
On the weekly chart, BINANCE:SUIUSDT is now shaping a clean Ascending Triangle pattern. This is typically a bullish continuation setup, and the structure is becoming clearer with every retest. The longer price consolidates under the resistance, the stronger the breakout move is likely to be once bulls finally push through.
All eyes remain on the $4.4 breakout level. A successful close above this resistance could open the door for a powerful move to the upside. My target remains unchanged at $10, supported by the bullish technical formation and repeated validation of support.
BINANCE:SUIUSDT Currently trading at $3.3
Buy level : Above $3.3
Stop loss : Below $2.62
Target 1: $4
Target 2: $5
Target 3: $7
Target 4: $10
Max leverage 2x
Always keep stop loss
Follow Our Tradingview Account for More Technical Analysis Updates, | Like, Share and Comment Your thoughts
S&P500: Short-Term Pullback Before Next RallyS&P futures initially slipped yesterday but managed to stabilize soon. Our primary outlook is that the ongoing turquoise wave B will continue to move higher, likely topping out just below resistance at 6,675 points. After that, we expect wave C to drive the index directly into the magenta long Target Zone between 6,082 and 5,650 points, where the low of the wave (4) correction should be established. From there, the impulsive wave (5) is expected to begin, pushing the index above the 6,675 points resistance and completing the broader blue wave (III). Alternatively, there is a 35% chance that the index could break out directly above 6,675 points without first reaching the magenta Target Zone. In this scenario, the index would already be forming the alternative wave alt.(5) in magenta.

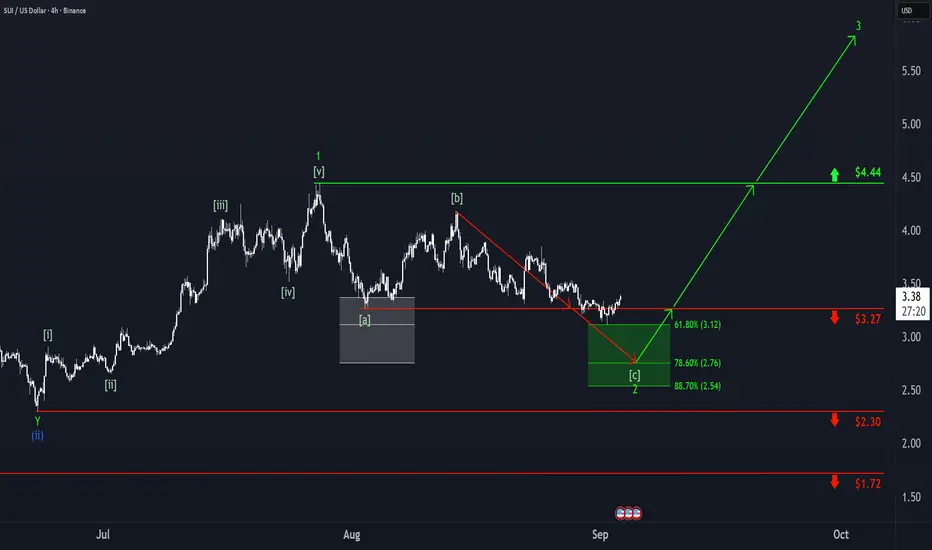
SUI: Dip and Go?On Monday, SUI dipped into our green Target Zone ($3.12 – $2.54) but quickly rebounded and climbed back above the $3.27 level. While it’s possible that wave 2 has already bottomed, we’re still allowing for potential new lows within this range. Once this interim correction wraps up, we expect an impulsive rally as green wave 3 takes shape, which should push well above the $4.44 resistance.