BTCUSD: Bearish Trend Confirmed with Downside TargetsAs per the updated analysis, BTCUSD has reversed its previous bullish momentum and is now poised for a downtrend toward lower targets. The chart shows a well-defined resistance zone at 91,563, where price has started to recoil and move lower.
🔹 Market State: Bearish Reversal Confirmed
BTCUSD has now entered a consolidation phase below the resistance zone, with price rejecting the higher levels around 91,563.
The market is setting up for a downside continuation with clear price action signals. The move lower has already begun, and targets are positioned around 89,200 (Target 1), 88,000 (Target 2), and 86,386 (Target 3).
🔹 Macro Factors Driving the Decline:
1. Risk-Off Sentiment Prevails
Yesterday's decline can be attributed to the broad market risk-off sentiment. Concerns about global economic uncertainty, geopolitical tensions, and weaker-than-expected economic data are pressuring risk assets like Bitcoin.
2. Strong USD and Profit-Taking
The US dollar’s strength has been a key factor in BTC's retreat. As the dollar rises, investors typically retreat to more secure assets, causing Bitcoin and other risk assets to experience declines.
Profit-taking after Bitcoin's recent surge also contributed to the market's downward movement.
3. Fed Rate Expectations
Fed's hawkish stance (with interest rates possibly staying higher for longer) is placing further pressure on risk assets, making them less attractive to investors. This also increases the capital inflow into USD and dampens demand for Bitcoin.
4. Macro Data Weakness
Poor economic indicators such as reduced job growth or disappointing inflation figures could contribute to the broader market decline. The weak economic data creates more uncertainty, prompting liquidation of higher-risk assets.
🔹 Price Expectations and Targets:
Resistance Zone: 91,563 (Key Rejection Point)
Target 1: 89,200
Target 2: 88,000
Target 3: 86,386
As long as price remains below 91,563, the bearish continuation setup is intact, and the market is expected to decline towards Target 1, then Target 2 and Target 3.
Chartanalysis

Gold (XAUUSD) Price Action Analysis – H1 Timeframe I 12/16📌 Market Context
After a strong impulsive rally, price entered a distribution phase followed by a sharp correction, signaling that buying momentum has weakened and the market is now rebalancing supply and demand.
At the moment, price is trading inside the Value Area, indicating a sideways / consolidation phase while waiting for the next directional move.
📊 Volume Profile Analysis
VAH (Value Area High): ~4348
→ A strong resistance zone where price has been rejected multiple times. Without strong momentum, price is unlikely to break above immediately.
POC (Point of Control): ~4343
→ The area with the highest traded volume, representing fair value. Price reacts clearly here, making it a key decision zone.
VAL (Value Area Low): ~4310
→ A critical support zone. Price is currently hovering around VAL, showing buyers are defending, but without strong conviction.
📉 Current Price Behavior
Price moved decisively from VAH down to VAL, giving short-term control to sellers.
After tapping VAL, price failed to break down aggressively and started ranging with small candles → a sign of temporary balance, likely waiting for news or fresh order flow.
No clear bullish structure yet → no strong BUY confirmation at this stage.
🎯 Potential Scenarios
1️⃣ Continuation to the downside (preferred if bearish news hits):
Clear break below VAL ~4310
Failed retest → potential extension toward lower demand zones
2️⃣ Technical pullback:
VAL holds
Price retraces toward POC ~4343
Rejection at POC → opportunity to sell on rallies
⚠️ BUY is only safer when:
Price strongly reclaims POC
H1 structure shifts clearly to higher highs and higher lows
🧠 Summary
The market is currently in a waiting mode
This area is highly sensitive, especially around news releases
No FOMO, no predictions
Trade based on price reactions at VAL – POC – VAH
If the market doesn’t give a clear signal, patience becomes your strongest edge.

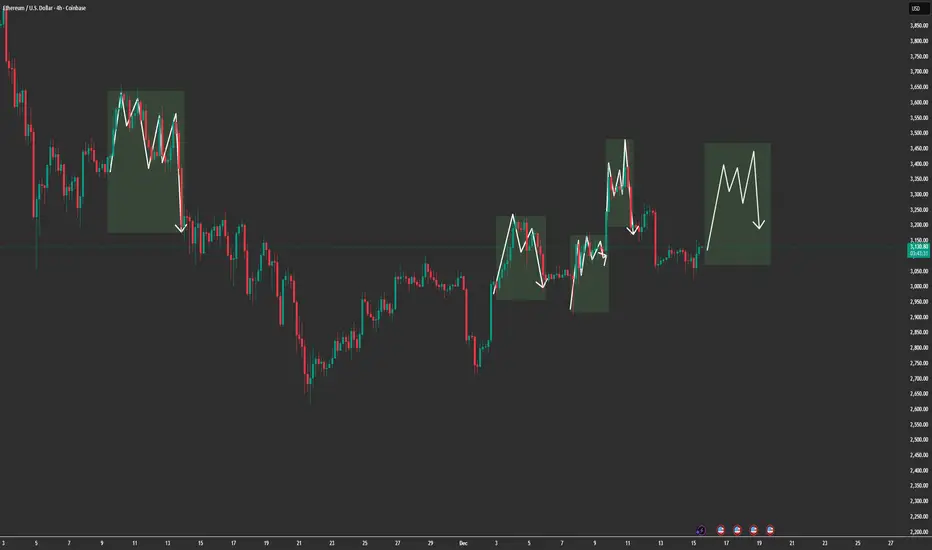
“ETH Is Repeating the Same Trap — Range First, Direction LaterMARKET BRIEFING – ETH/USD (4H)
Market State:
– Ethereum remains in a range-bound structure, repeatedly forming distribution-like consolidations after short impulsive moves.
– Each highlighted box shows the same behavior: push up → choppy consolidation → downside rotation. Current price action is aligning with that same rhythm.
Key Levels:
– Range Mid / Balance: ~3,120 – 3,150
– Upper Supply Reaction Zone: ~3,300 – 3,450
– Lower Demand / Rotation Target: ~3,000 – 3,050
– Breakout Invalidation: Clean acceptance above ~3,450
Price Action Read:
– The market is not trending it is cycling liquidity inside a broad range.
– Failed follow-through after bullish pushes signals seller absorption at higher prices.
– Current consolidation suggests another rotation phase, not immediate continuation.
Next Move:
– Sideways to slightly bearish rotation remains favored while below the upper supply zone.
– A sweep toward the lower range (~3,000–3,050) is a high-probability magnet.
– Only a strong break and acceptance above 3,450 would invalidate the range-play and shift bias bullish.
ETH is not breaking out it’s repeating structure.
Until price escapes the range with acceptance, rotation beats prediction.
Bitcoin Is Trapped — But Not WeakMarket State:
– Bitcoin is trading inside a defined sideways structure, bounded by a strong support zone near 87,500–88,000 and a heavy resistance band around 90,500–91,000.
– The sharp sell-off into support was immediately absorbed, followed by a rebound — confirming buyers are defending the range, not abandoning it.
Key Levels:
– Strong Support: 87,500 – 88,000
– Range Mid / Balance: ~89,000
– Strong Resistance: 90,500 – 91,000
– Breakout Trigger: Acceptance above 91,000
Price Action Read:
– Repeated rejections at resistance and higher lows from support signal range compression.
– This is not trend continuation yet — it is market indecision resolved through time, not price.
NEXT MOVE SCENARIOS
➡️ Primary Scenario – Range Continuation
– Price oscillates between support and resistance.
– Buy reactions near 87,500–88,000, fade moves into 90,500–91,000.
➡️ Breakout Scenario (Macro-Driven)
– A decisive break and acceptance above 91,000 requires:
• Dovish Fed repricing
• USD weakness
• Broader risk-on rotation
– Only then does upside expansion become sustainable.
❌ Invalidation:
– A clean breakdown below 87,500 would shift bias to deeper corrective price discovery.

Gold Is Pulling Back Before the Next ExpansionMARKET BRIEFING – XAUUSD (H1)
Gold remains in a clean bullish structure on H1. The recent pullback is corrective, not a reversal. The sharp bearish candle was a liquidity sweep, immediately absorbed by strong buying confirming buyers are still in control and structure stays HH–HL.
Key Levels:
– Main Support (Demand): 4260 – 4270
– Current Range: 4270 – 4350
– Upside Targets:
• TP1: 4350 – 4360
• TP2: 4380 – 4390
Price Action Read:
Sell-side liquidity has been absorbed inside the support zone. Long lower wicks show aggressive demand. Price is consolidating above support a re-accumulation phase within the uptrend, building energy for the next expansion.
Scenario:
➡️ Bullish Continuation (Primary):
Hold above 4260 → consolidate → push higher → break toward TP1, then TP2.
Pullbacks into support = continuation setups, not weakness.
❌ Invalidation:
A decisive H1 close below 4260 would delay the bullish expansion and open room for a deeper correction.
Bias: Buy pullbacks. Don’t chase highs.
Gold is not distributing it’s loading the next impulsive leg.

Gold Is Not Correcting — It’s Loading the Next ImpulseXAUUSD M30 – Intraday Market Analysis
1. Current Market Structure
Gold remains in a healthy bullish structure after completing a sharp technical correction.
The recent pullback was corrective in nature, and price has successfully reclaimed and held above key moving averages, confirming that the primary trend is still bullish.
From a wave perspective, price is forming a (1) – (2) corrective structure, with wave (2) holding firmly above the key support area. This behavior signals trend continuation, not reversal.
2. Key Support & Structure Zones
Primary Support Zone: 4286 – 4300
→ Strong demand reaction, buyers defended this zone aggressively
Structure Low (Wave 2): Still intact
→ Failure to break this level confirms seller weakness
Upside Projection: Wave (3) → (4) → (5) remains valid as long as price holds above support
This zone acts as a launchpad for the next impulsive leg.
3. Momentum & Flow
Momentum indicators remain elevated, showing active buying pressure
Selling volume decreases on pullbacks → correction lacks strength
Price consolidating above support suggests smart money re-accumulation
This is a classic pause-before-expansion behavior.
4. Today’s Market Scenario
🔼 Primary Scenario – Bullish Continuation
If price continues to hold above 4300 – 4305, the market is highly likely to:
Complete the corrective base
Initiate wave (3) expansion
Continue toward higher intraday targets as projected on the chart
Corrections at this stage are considered buying opportunities, not trend failures.
5. Intraday Trading Plan
Intraday Bias: 📈 Bullish (Increase)
📌 SET UP 1 – Timing Sell Zone (Counter-trend scalp)
SELL ZONE: 4379 – 4382
TP: 4376 – 4371
SL: 4386
📌 SET UP 2 – Timing Buy Zone (Trend-following)
BUY ZONE: 4286 – 4289
TP: 4292 – 4297
SL: 4282
⚠️ Always apply proper capital management to protect the account.
Conclusion
Gold is not showing signs of distribution.
The market is absorbing supply after a technical correction, maintaining bullish structure, and preparing for the next impulsive expansion.
As long as price holds above the key support zone, the roadmap remains clear:
Correct → Accumulate → Expand.

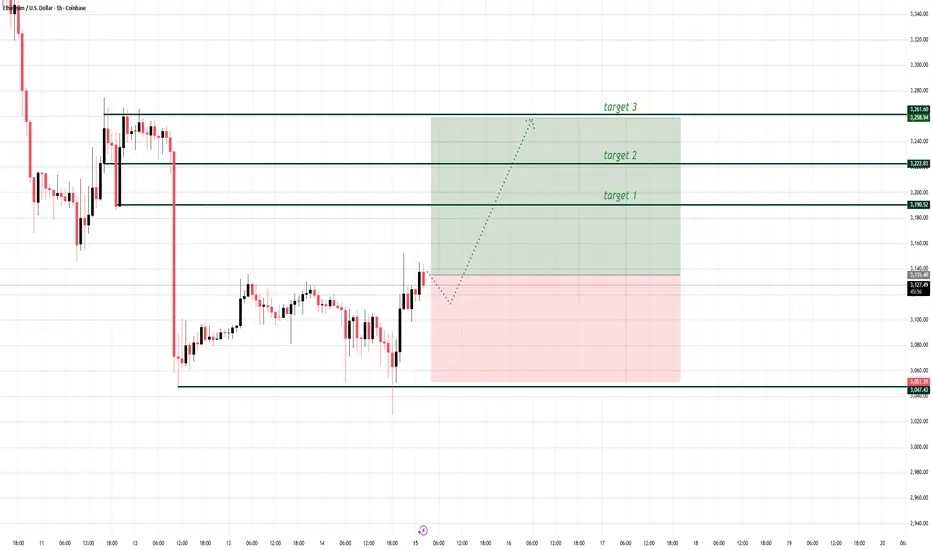
ETH Is Not Recovering — It’s ReloadingETHEREUM (ETH/USD) — 1H MARKET ANALYSIS
Trend Continuation Setup | Macro-Aligned
1. Market Structure Overview
ETH has completed a sharp bearish impulse and is now stabilizing above the 3,050–3,070 demand base. The recent rebound shows acceptance back into value, forming a short-term higher low on the 1H. Structure is transitioning from sell-off to accumulation-within-range, not a full reversal yet, but conditions favor continuation.
2. Key Levels & Liquidity
Primary Demand: 3,050–3,070 (defended multiple times; liquidity already swept).
Mid-Range Acceptance: ~3,135 (current balance point).
Targets (Liquidity Above):
Target 1: 3,190
Target 2: 3,225
Target 3: 3,260
These targets align with prior intraday highs and resting buy-side liquidity.
3. Macro Context (1H Bias)
Macro conditions remain supportive but cautious. With rate-cut expectations still alive and no immediate risk-off catalyst in the session, ETH tends to outperform during stabilization phases after aggressive sell-offs. Short-term flows favor mean reversion higher as risk appetite returns incrementally.
4. Intraday Scenarios
Primary Scenario (Bullish Continuation):
Shallow pullback into 3,105–3,115, followed by bullish continuation.
Break and hold above 3,150 opens the path to 3,190 → 3,225 → 3,260.
Invalidation / Risk Scenario:
Acceptance below 3,050 on a 1H close invalidates the setup and reopens downside toward 3,000 psychological support.
5. Trading Guidance
Favor buy the dip setups near demand; avoid chasing mid-range.
Use confirmation on pullbacks (rejection wicks / bullish closes).
Manage risk tightly; volatility expansion is likely once liquidity above is targeted.
Discipline beats prediction — wait for structure, trade the confirmation, and let liquidity do the work.
Gold Is Quiet — Because It’s About to ExplodeGOLD (XAUUSD) — 4H MARKET ANALYSIS
ATH Preparation | Accumulation → Breakout Model
1. Market Structure Overview
Gold remains in a strong bullish macro structure on the 4H timeframe. The market has repeatedly shown a clear behavioral pattern:
Impulse → Accumulation → Expansion.
At the current stage, price is consolidating just below the All-Time High (ATH), which is a classic sign of strength, not weakness. There is no aggressive rejection instead, price is being absorbed.
This confirms the market is preparing for a continuation breakout, not a reversal.
2. Accumulation & Liquidity Behavior
Multiple Accumulation Zones are visible throughout the trend:
- Each accumulation previously led to a strong impulsive leg higher.
- The current accumulation zone is forming directly below ATH, which is the most bullish location possible.
- Liquidity has already been collected on minor pullbacks, leaving little resistance overhead once ATH is breached.
This behavior signals institutional positioning, not retail speculation.
3. Key Levels to Watch
- Major Resistance:
ATH zone (~4,380 – 4,400)
- Key Support (Structure Hold):
Upper accumulation range (~4,280 – 4,300)
As long as price holds above the accumulation base, the bullish structure remains fully intact.
4. Forward Scenarios
Primary Scenario – Breakout Continuation (High Probability):
- Price holds above the accumulation zone
- Breaks and accepts above ATH
- Enters price discovery, targeting a new ATH expansion leg
Projected path:
➡ Break ATH → shallow pullback → continuation
➡ Momentum builds toward new historical highs
Alternative Scenario – Extended Accumulation (Low Risk):
- Price continues ranging just below ATH
- Further compression before the breakout
This only adds fuel to the next impulsive move.
No structural evidence currently supports a bearish reversal.
5. Market Psychology & Conclusion
- The market is not rejecting ATH — it is absorbing orders beneath it.
- Volatility compression near highs is a bullish continuation signal.
- Gold is behaving exactly as it has before every major upside expansion in this trend.
Conclusion:
Gold is not topping it is loading liquidity.
Once ATH breaks with acceptance, new all-time highs become the base case, not the exception.
The biggest moves come after patience — not prediction. Stay aligned with structure, and let the breakout pay you.

EURUSD Rises as the USD Faces HeadwindsHello everyone — let’s discuss FX:EURUSD .
At the start of the new week, EURUSD is trading relatively steady, showing little change from the previous session while maintaining its bullish momentum around the 1.173 area.
The U.S. dollar (USD) has weakened following the U.S. Federal Reserve’s recent monetary policy decision, which is currently providing a favorable backdrop for the pair’s recovery.
From a technical perspective, buyers remain in control. The pair is forming a wedge pattern and is undergoing a healthy correction after the previous strong rally. The first key support lies at 1.172, followed by 1.168. As long as these levels hold, the path of least resistance for EURUSD in the short term remains to the upside. Upside targets are seen at 1.175 and 1.180.
What’s your view on the outlook for this pair? Feel free to share your thoughts.

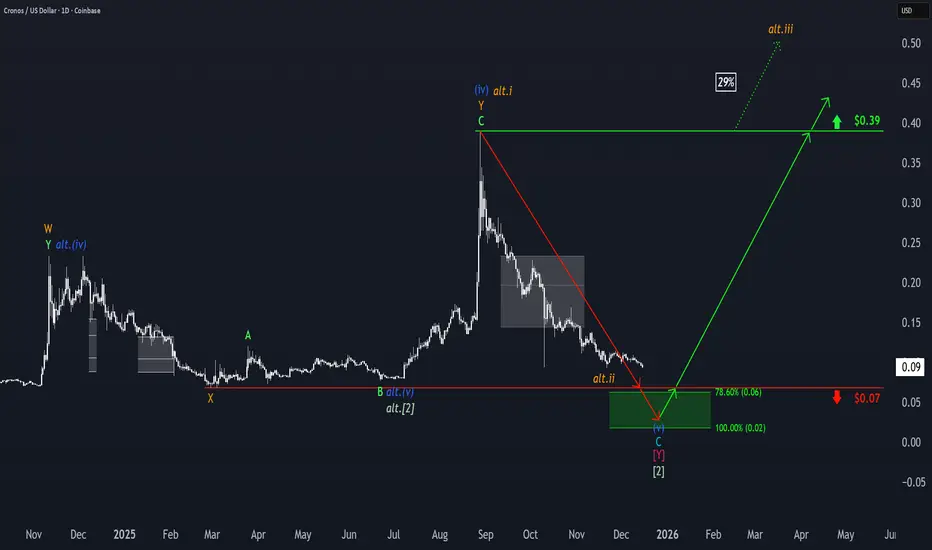
Cronos: Approaching the Target ZoneCrypto.com coin Cronos has continued its move toward the green Target Zone between $0.06 and $0.02. We expect the low of the large wave correction to form within this range. A sustained upward move should only become the main focus once this significant bottom is in place. There is a 29% probability that the low of the green wave alt. has already been reached. If that’s the case, the next step could be a breakout above the resistance at $0.39, rather than a drop below the $0.07 support.
BTCUSDT Analysis: Support Turns Resistance + Next Move LoadingBTCUSDT (Bitcoin) – Intraday Price Action Analysis
This chart presents a clear intraday structure shift on Bitcoin, highlighting how price is currently reacting around a major Support–Resistance Interchange (SR Flip) zone. The overall behavior suggests that the market is no longer trending aggressively and has entered a decision phase, where confirmation becomes more important than prediction.
Higher-Timeframe Context & Structure
From the left side of the chart, Bitcoin shows volatile, two-sided price action, with strong impulsive moves followed by sharp rejections. This tells us that liquidity is being actively hunted on both sides of the range rather than a clean trend being established.
As price progressed, we can observe multiple failed breakouts and fake pushes, which often occur near important institutional levels. These failures weaken directional confidence and prepare the market for a structural flip.
Support–Resistance Interchange Zone
The grey highlighted area marks a key SR Interchange zone. Historically, this level has acted as:
Support during previous bullish attempts
Resistance after breakdowns
Price is now reacting inside this zone, which makes it a high-risk area for impulsive entries. Markets often pause here to absorb liquidity before the next expansion.
The presence of multiple candle rejections around this zone confirms that buyers and sellers are equally active, creating compression.
Recent Breakdown & Pullback
A strong bearish impulse pushed price below the SR zone, indicating temporary bearish control. However, instead of immediate continuation, price pulled back toward the same SR level, showing that sellers are now defending this area.
This pullback is critical. If the zone holds as resistance, it strengthens the bearish case. If price reclaims and holds above it, the breakdown becomes a false move.
Entry Logic: Pattern Before Trade
The marked note “Need Pattern Then Entry” is key. At this location, blind buying or selling is not justified. Traders should wait for:
Clear rejection patterns for short setups
Or strong bullish confirmation (engulfing / structure break) for long setups
This approach protects against whipsaws that are common near SR flips.
Projected Price Scenarios
Bearish Continuation Scenario:
If price rejects from the SR zone with strong bearish candles, continuation toward the lower liquidity area becomes likely. This move would align with the recent impulsive sell-off and trend continuation logic.
Bullish Recovery Scenario:
A strong reclaim and hold above the SR zone could trigger a short squeeze and push price back into the previous range, invalidating the bearish breakdown.
Trading Psychology & Risk Insight
This is a classic patience zone. Many traders lose money here by anticipating instead of reacting. The chart clearly suggests that confirmation is the edge, not early entries.
Conclusion
Bitcoin is currently trading at a make-or-break level. The SR Interchange zone will decide whether price continues lower or transitions into a recovery phase. Until a clean pattern forms, waiting is the most professional decision.

XAUUSD 30M: Bullish Structure Meets Major Reversal ZonesGOLD (XAUUSD) – 30 Minute Chart Detailed Analysis
This 30-minute XAUUSD chart shows a strong bullish structure with clear smart-money behavior, corrective moves, and an approaching decision zone where price is likely to react sharply.
Market Structure & Trend Context
Gold is currently trading in a higher high – higher low structure, confirming that buyers are in control on the intraday timeframe. The impulsive bullish leg on the left side of the chart shows strong momentum, followed by a deep corrective move. That correction was not random — it respected key technical levels and formed the base for the next bullish continuation.
After the sharp sell-off, price performed a clean retest of demand, labeled as Retesting, where selling pressure was absorbed and buyers stepped back in aggressively. From that zone, price resumed its bullish move with steady candles, showing healthy trend continuation rather than weak or choppy price action.
Impulse, Correction & Continuation
The marked vertical move highlights a strong impulsive rally, followed by a proportional pullback (measured correction). This type of behavior usually indicates institutional participation rather than retail-driven noise.
Once the retest was completed, price continued upward with controlled bullish candles, confirming that the previous resistance had flipped into support. This is a classic bullish continuation setup.
Current Price Behavior (Rising Wedge / Flag)
At the current level, price is consolidating in a tight bullish flag / rising wedge structure near the highs. This tells us two important things:
Buyers are still present, but momentum is temporarily slowing.
Price is approaching a reaction zone, not an immediate breakout level.
Small-bodied candles and upper wicks indicate hesitation and potential profit-taking by short-term traders.
Key Supply & Reversal Zones
Above the current price, two clearly defined zones stand out:
Reversal Zone 1:
This is the first supply area where price is expected to react. A rejection here could lead to a healthy pullback toward the previous structure low or the highlighted demand zone.
Reversal Zone 2 (Volume Burst Area):
This higher zone represents a strong liquidity and volume imbalance area. If price breaks above Zone 1 with strength, this area becomes the next bullish target. However, aggressive selling pressure is expected here, making it a high-probability reversal or deep correction zone.
Possible Scenarios
Bullish Scenario:
If price breaks and holds above the current consolidation with strong candles, continuation toward Reversal Zone 1 is likely, followed by an extension into Reversal Zone 2 if volume supports the move.
Bearish / Pullback Scenario:
Rejection from the current structure or from Reversal Zone 1 could trigger a pullback toward the marked support area (green circle), providing a potential higher-low formation within the overall uptrend.
Trading Insight
This chart favors a buy-the-dip mindset rather than chasing price at highs. Patience is key near these supply zones. Smart traders will wait for either:
A clean breakout with confirmation, or
A controlled pullback into demand for higher-probability entries.
Conclusion
Overall, XAUUSD remains bullish on the 30-minute timeframe, but price is currently at a sensitive area where reactions are expected. The next move will likely be decisive, either expanding toward the upper volume zone or correcting to rebalance before another push higher.

Gold Continues Its Upward TrendHello everyone — let’s take a look at today’s gold price.
At the start of the new week, gold continues to extend its bullish streak, currently trading around USD 4,326. The precious metal remains strong amid expectations that the U.S. Federal Reserve (Fed) will cut interest rates next year, and it is still on track to close the year with an increase of around 60%, marking its strongest annual gain since 1979.
Regarding this week’s outlook, results from Kitco’s weekly gold price survey show that both investors and analysts continue to expect further upside. In the Wall Street survey, 13 analysts participated, with 85% believing that gold prices will continue to rise. Notably, none forecast a decline, while 15% expect prices to move sideways.
Similarly, in the Main Street online survey, 237 investors took part. Among them, 71% anticipate gold advancing to new highs, 11% predict a decline, and the remaining 18% expect prices to consolidate.
From a personal perspective, the chart structure remains clearly bullish, supported by solid demand zones. The immediate target is the USD 4,350 area , followed by the key psychological level at USD 4,400.
I remain optimistic — how about you? Share your thoughts in the comments section.

Gold Price Movement Forecast (XAU/USD - M30)The overall trend in the short term remains bullish due to the price finding strong support at the VAH (4,254.130) and successfully breaking through recent resistance levels.
1. Continuation of Uptrend Scenario (Preferred Scenario)
This is the most likely scenario based on the current momentum.
Condition: The price needs to hold firmly above the upward trendline and the nearest static support level of 4,302.985 - 4,304.870.
Movement: If buying pressure is maintained, the price will consolidate around the current region (4,344.220) and continue to push higher.
Target: The next upside target will be the potential peak projected on the chart, around 4,389.422 and possibly the 4,400 area thereafter.
Result: The uptrend is confirmed and extended.
2. Healthy Correction Scenario (Buying Opportunity)
The price needs a "rest" after a strong rally to seek liquidity and consolidate.
Condition: Profit-taking pressure emerges, but selling pressure is not strong enough to break the bullish structure.
Movement: The price may experience a slight pullback to test the dynamic upward trendline or the static support zone 4,302.985 - 4,304.870.
Key Point: If the price approaches these support levels and shows rejection signals (such as a pin bar or bullish engulfing candle), it will be a potential opportunity for traders to enter long positions in line with the main trend.
Result: After completing the correction, the price is expected to resume its rise according to Scenario 1.
3. Reversal/Downturn Scenario (Risk Scenario)
This scenario would invalidate the current uptrend.
Condition: A major negative news event or strong selling pressure occurs, causing the price to decisively break and close below 4,302.985 and the upward trendline.
Movement: If the above condition occurs, the price will quickly slide to test the extremely important structural support level: VAH 4,254.130.
Warning: A break and close below VAH 4,254.130 would be the strongest signal that the short-term uptrend has ended and may shift towards a downtrend or a larger consolidation phase.
In summary, the bullish momentum remains dominant. Traders should focus on looking for buy signals at key support areas, especially if the price corrects to the trendline or the 4,302.985 level.

XAUUSD Bullish Structure Intact Ready for Takeoff📊 XAUUSD Analysis – Pullback Complete, Bulls Regaining Control
Gold pulled back sharply after tapping the upper resistance zone, but the correction found support right inside the Ichimoku cloud + previous breakout region, which acts as a high-probability bullish reaction zone.
Price has already shown a strong bounce from this support, indicating that buyers are defending structure and preparing for another leg higher.
Your chart points toward a likely retest and continuation path, suggesting the uptrend remains intact.
---
🔍 Key Technical Points
Trend: Still bullish despite the sharp correction.
Pullback: Price corrected into cloud support + previous breakout base.
Reaction: Strong bullish rejection shows buyers stepping back in.
Outlook: Expecting a move toward 4,330 – 4,350 (resistance retest).
Continuation Signal: Higher-low formation followed by a push above 4,310.
Invalidation: Break below 4,265 weakens the bullish structure.

ETH Sharp Drop: Watching the Retracement Trap Zone📉 ETH Analysis – Breakdown, Retest Incoming
ETH has broken down sharply from the previous consolidation block, confirming a bearish continuation structure. The price has dropped cleanly below the range and is now forming a temporary bounce from the 3,060–3,090 zone.
Your chart highlights a potential retest zone around 3,220–3,250, aligned with:
The bottom of the previous range
The cloud resistance
The breakdown retest zone
A typical liquidity sweep level before continuation
This suggests the market may produce a ** corrective pullback** toward that marked area before sellers step in again.
---
🔍 Key Points
Trend: Bearish after breaking the ascending structure.
Current Move: Relief bounce from oversold region.
Main Target: Retest toward 3,220–3,250.
Expectation: From that zone, ETH likely faces selling pressure and resumes downside.
Invalidation: Break and hold above 3,260.

Bitcoin Breakdown Pullback Target Locked In📊 BTC Analysis – Breakdown With Incoming Retracement
Bitcoin has broken cleanly below the previous consolidation block, confirming a shift from neutral to bearish short-term structure. After the breakdown, price found temporary support around 90,000, where buyers are attempting a relief bounce.
Your chart highlights a likely retracement path toward the 92,500 – 93,000 zone.
This area lines up with:
The bottom of the last range (now turned resistance)
Ichimoku cloud resistance
A typical breakdown retest zone
A potential liquidity grab level before continuation
This makes it the most probable reaction zone for sellers to re-enter the market.
---
🔍 Key Technical Points
Trend: Short-term bearish after the breakdown.
Current Move: Relief bounce forming from local support.
Main Target: Retest into 92.5K–93K before resistance kicks in.
Expectation: BTC may bounce upward first, then face strong rejection from the marked zone.
Invalidation: A sustained break above 93,200 would weaken the bearish idea.

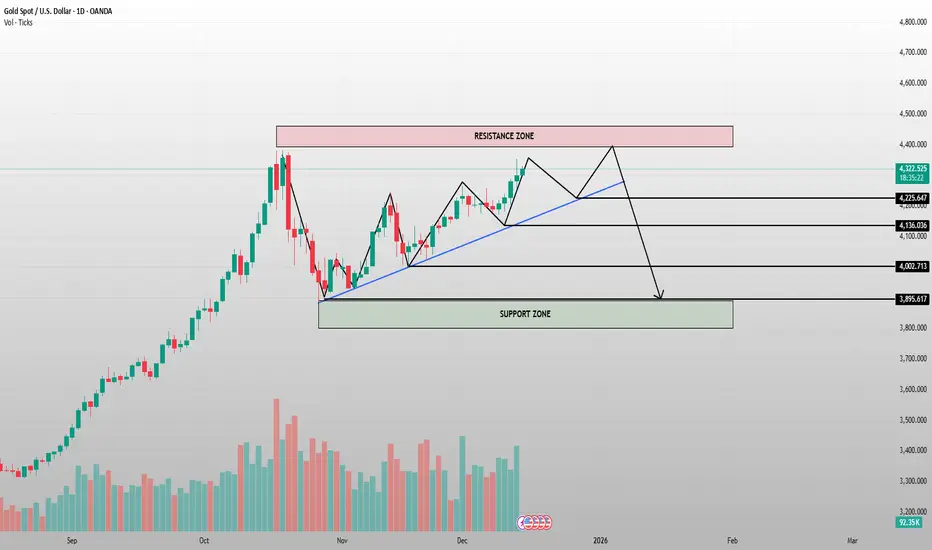
Gold at a Critical Crossroad — One Last Push Before the Trap?MARKET BRIEFING – GOLD (XAU/USD) | 1D
Market Structure:
Gold remains in a rising structure, respecting the ascending trendline. However, price is now approaching a major resistance zone, where selling pressure has previously stepped in aggressively.
Key Levels to Watch:
– Resistance Zone: 4,380 – 4,420
– Intermediate Support: 4,225 / 4,136
– Major Support Zone: 3,900 – 3,950
Price Action Read:
– As long as price holds above the rising trendline, bulls still have control.
– A final push into resistance is possible, but momentum is weakening near the highs.
– Failure to break and hold above resistance could trigger a sharp pullback toward the 4,000 handle and deeper into the support zone.
Bias:
➡️ Short-term: Cautious bullish into resistance
➡️ Medium-term: Watch for rejection → corrective move likely
Trader Focus:
This is decision time — either a clean breakout with acceptance above resistance, or a liquidity sweep followed by a downside rotation. Patience > prediction
Chumtrades XAUUSD Trading PlanMarket Context
During Friday’s session, after the previous range breakout, the market saw strong profit-taking pressure from buyers.
Large capital exits triggered a sharp sell-off of ~96 prices, while the 426X base zone supported price very well.
Overall structure remains bullish.
Session Expectation
Price is likely to move in a sideways range, with the upper–lower boundary around 423X – 428X (personal expectation).
Key Support Zones
• 4280 – 4282
• 4264 – 4266
• 4255 – 4257
• Deeper support: 424X
Key Resistance Zones
• 4330 – 4336
• 4347 – 4351 (±4353)
Good day, traders

Gold Just Paused at a Strange Level What is Coming Nex🔹 MARKET BRIEFING – XAU/USD (1H)
Market State:
– Price has broken out of the short-term consolidation, followed by a clean retest structure forming right at the breakout zone a classic continuation signal.
Key Levels from Chart:
– Entry Zone: around the retest area just above 4280–4286
– Stop Loss: 4262 – 4264
– Take Profit 1: 4317
– Take Profit 2: 4381
Next Move:
– As long as price holds above the SL zone and respects the breakout retest structure, XAU/USD is positioned for a continuation leg toward 4317, with potential extension toward 4381.

GBPUSD: Market Pullback Before the Next Upside Expansion1. MARKET CONTEXT
- GBPUSD has just completed a mild corrective pullback after a strong bullish leg, reflecting a healthy market reaction following the latest UK GDP release.
- The GDP data came in stable and slightly better than expected, not spectacular but strong enough to ease recession fears.
This creates a constructive environment for GBP not explosive, but certainly not bearish.
2. MACRO DRIVERS
✓ UK GDP Stability Supports GBP
Yesterday’s GDP print showed steady growth, reinforcing the view that the UK economy is gradually improving.
→ This reduces downside pressure on GBP in the short term.
✓ BOE Expected to Hold Rates Higher for Longer
With services inflation still sticky, the market is pricing in that the BOE will delay any rate cuts.
→ This acts as a tailwind for GBP during pullbacks.
✓ USD Softening as Markets Price Early Fed Cuts in 2025
Not aggressively bearish, but the USD is losing momentum as traders anticipate a shift toward Fed easing.
→ This opens the door for GBPUSD to resume its upside.
3. TECHNICAL STRUCTURE
On the GBPUSD 1H chart, price is forming a clean corrective pullback into the 1.3375 – 1.3380 support zone.
Key technical signals:
- Price is building a Higher Low after the pullback → bullish continuation structure
- Long lower wicks → declining sell pressure
- The 1.3375 support has been retested multiple times → strong demand
- The ascending trendline remains intact → uptrend not broken
→ The structure currently shows accumulation before upward breakout.
4. TRADE IDEA / PRICE EXPECTATION
As long as price holds above 1.3375, the bullish continuation setup remains valid.
Upside targets (matching your chart):
TP1: 1.34156
TP2: 1.34379
TP3: 1.34716
Expected behavior:
✔ Minor pullback
✔ Sideways accumulation
✔ Bullish leg toward TP1 → TP2 → TP3
5. MARKET SENTIMENT & OUTLOOK
With supportive GDP data, BOE’s higher-for-longer stance, mild USD weakness, and a clean bullish structure on the chart:
→ Short-term Trend: Sideways → Support → Bullish Continuation
→ Directional Bias: Upside toward all 3 targets

Bitcoin Rejected at Supply1. MARKET CONTEXT
Bitcoin on the 1H timeframe has just tapped into a clear resistance / supply zone, where previous bearish impulses originated.
The reaction is identical:
- Immediate slowdown
- Loss of bullish momentum
- Selling pressure absorbing every attempt to push higher
This confirms the market is still range-bound, with liquidity building between supply above and demand below.
2 . TECHNICAL ANALYSIS
The chart structure highlights:
• Supply Zone Rejection
Price entered the resistance zone and instantly stalled — showing strong sell orders waiting in that area.
• Lower-Timeframe Shift
The current candlestick sequence shows a micro shift from bullish impulse → correction → bearish intent.
• Liquidity & Imbalance Below
There is an unfilled region between current price and the demand zone, creating a clean path for the market to drop.
• Demand Zone Waiting at 89,300 – 87,770
This is where previous strong buy orders originated, making it the most logical target for the next bearish leg.
Overall, the structure favors a continuation downwards after a small corrective pullback.
3. TRADE IDEA
Bias: Short from the Supply Zone
The entry is positioned inside the resistance zone, aligning with institutional sell reaction.
Expected Price Behavior:
Minor bullish correction
Bearish continuation
Price targets the Demand Zone at 89,300 – 87,770
Trade Structure Shown on Chart:
Stop Loss: Above the supply zone
Entry: At resistance rejection
Take Profit: Demand zone below
This setup follows clean smart-money flow from supply → demand, with no structural break supporting a bullish reversal yet.

FED Turns Hawkish — Bitcoin Drops HardBitcoin has begun to move exactly in line with the projected downside structure. After rejecting the resistance zone around 91,543, price has broken below the short-term support and is now entering a clean retracement phase.
At this stage, BTC is likely to continue following the descending path toward the key liquidity zones highlighted on your chart:
Target 1: 89,068
Target 2: 87,794
Target 3: 86,386
The market structure shows clear lower highs and lower lows, signaling that sellers are currently in control. Until BTC can reclaim the mid-range zone above 90,800–91,000, the bearish outlook remains valid.
This corrective move is healthy for the broader trend, helping sweep liquidity and rebalance price before any larger directional expansion.
