ETH Sharp Drop: Watching the Retracement Trap Zone📉 ETH Analysis – Breakdown, Retest Incoming
ETH has broken down sharply from the previous consolidation block, confirming a bearish continuation structure. The price has dropped cleanly below the range and is now forming a temporary bounce from the 3,060–3,090 zone.
Your chart highlights a potential retest zone around 3,220–3,250, aligned with:
The bottom of the previous range
The cloud resistance
The breakdown retest zone
A typical liquidity sweep level before continuation
This suggests the market may produce a ** corrective pullback** toward that marked area before sellers step in again.
---
🔍 Key Points
Trend: Bearish after breaking the ascending structure.
Current Move: Relief bounce from oversold region.
Main Target: Retest toward 3,220–3,250.
Expectation: From that zone, ETH likely faces selling pressure and resumes downside.
Invalidation: Break and hold above 3,260.
Chartanalysis

Bitcoin Breakdown Pullback Target Locked In📊 BTC Analysis – Breakdown With Incoming Retracement
Bitcoin has broken cleanly below the previous consolidation block, confirming a shift from neutral to bearish short-term structure. After the breakdown, price found temporary support around 90,000, where buyers are attempting a relief bounce.
Your chart highlights a likely retracement path toward the 92,500 – 93,000 zone.
This area lines up with:
The bottom of the last range (now turned resistance)
Ichimoku cloud resistance
A typical breakdown retest zone
A potential liquidity grab level before continuation
This makes it the most probable reaction zone for sellers to re-enter the market.
---
🔍 Key Technical Points
Trend: Short-term bearish after the breakdown.
Current Move: Relief bounce forming from local support.
Main Target: Retest into 92.5K–93K before resistance kicks in.
Expectation: BTC may bounce upward first, then face strong rejection from the marked zone.
Invalidation: A sustained break above 93,200 would weaken the bearish idea.

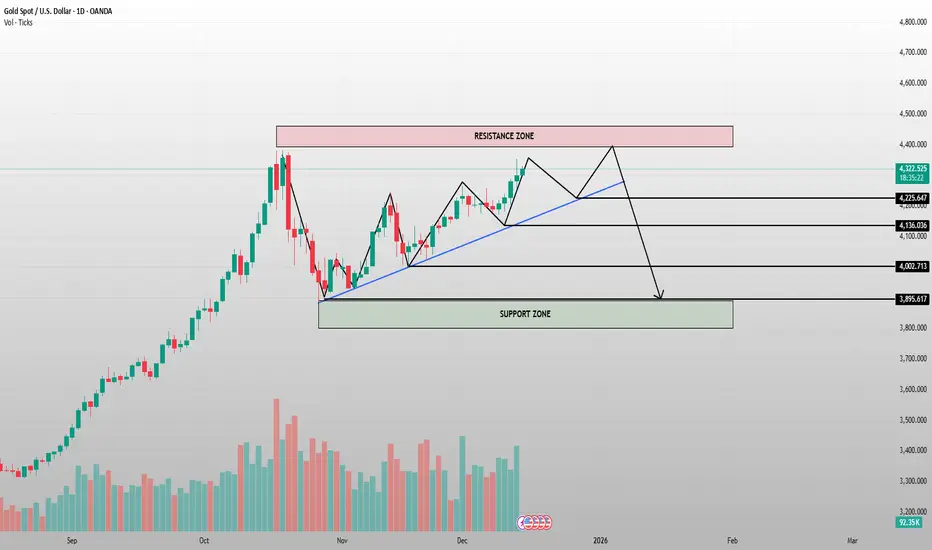
Gold at a Critical Crossroad — One Last Push Before the Trap?MARKET BRIEFING – GOLD (XAU/USD) | 1D
Market Structure:
Gold remains in a rising structure, respecting the ascending trendline. However, price is now approaching a major resistance zone, where selling pressure has previously stepped in aggressively.
Key Levels to Watch:
– Resistance Zone: 4,380 – 4,420
– Intermediate Support: 4,225 / 4,136
– Major Support Zone: 3,900 – 3,950
Price Action Read:
– As long as price holds above the rising trendline, bulls still have control.
– A final push into resistance is possible, but momentum is weakening near the highs.
– Failure to break and hold above resistance could trigger a sharp pullback toward the 4,000 handle and deeper into the support zone.
Bias:
➡️ Short-term: Cautious bullish into resistance
➡️ Medium-term: Watch for rejection → corrective move likely
Trader Focus:
This is decision time — either a clean breakout with acceptance above resistance, or a liquidity sweep followed by a downside rotation. Patience > prediction
Chumtrades XAUUSD Trading PlanMarket Context
During Friday’s session, after the previous range breakout, the market saw strong profit-taking pressure from buyers.
Large capital exits triggered a sharp sell-off of ~96 prices, while the 426X base zone supported price very well.
Overall structure remains bullish.
Session Expectation
Price is likely to move in a sideways range, with the upper–lower boundary around 423X – 428X (personal expectation).
Key Support Zones
• 4280 – 4282
• 4264 – 4266
• 4255 – 4257
• Deeper support: 424X
Key Resistance Zones
• 4330 – 4336
• 4347 – 4351 (±4353)
Good day, traders

Gold Just Paused at a Strange Level What is Coming Nex🔹 MARKET BRIEFING – XAU/USD (1H)
Market State:
– Price has broken out of the short-term consolidation, followed by a clean retest structure forming right at the breakout zone a classic continuation signal.
Key Levels from Chart:
– Entry Zone: around the retest area just above 4280–4286
– Stop Loss: 4262 – 4264
– Take Profit 1: 4317
– Take Profit 2: 4381
Next Move:
– As long as price holds above the SL zone and respects the breakout retest structure, XAU/USD is positioned for a continuation leg toward 4317, with potential extension toward 4381.

GBPUSD: Market Pullback Before the Next Upside Expansion1. MARKET CONTEXT
- GBPUSD has just completed a mild corrective pullback after a strong bullish leg, reflecting a healthy market reaction following the latest UK GDP release.
- The GDP data came in stable and slightly better than expected, not spectacular but strong enough to ease recession fears.
This creates a constructive environment for GBP not explosive, but certainly not bearish.
2. MACRO DRIVERS
✓ UK GDP Stability Supports GBP
Yesterday’s GDP print showed steady growth, reinforcing the view that the UK economy is gradually improving.
→ This reduces downside pressure on GBP in the short term.
✓ BOE Expected to Hold Rates Higher for Longer
With services inflation still sticky, the market is pricing in that the BOE will delay any rate cuts.
→ This acts as a tailwind for GBP during pullbacks.
✓ USD Softening as Markets Price Early Fed Cuts in 2025
Not aggressively bearish, but the USD is losing momentum as traders anticipate a shift toward Fed easing.
→ This opens the door for GBPUSD to resume its upside.
3. TECHNICAL STRUCTURE
On the GBPUSD 1H chart, price is forming a clean corrective pullback into the 1.3375 – 1.3380 support zone.
Key technical signals:
- Price is building a Higher Low after the pullback → bullish continuation structure
- Long lower wicks → declining sell pressure
- The 1.3375 support has been retested multiple times → strong demand
- The ascending trendline remains intact → uptrend not broken
→ The structure currently shows accumulation before upward breakout.
4. TRADE IDEA / PRICE EXPECTATION
As long as price holds above 1.3375, the bullish continuation setup remains valid.
Upside targets (matching your chart):
TP1: 1.34156
TP2: 1.34379
TP3: 1.34716
Expected behavior:
✔ Minor pullback
✔ Sideways accumulation
✔ Bullish leg toward TP1 → TP2 → TP3
5. MARKET SENTIMENT & OUTLOOK
With supportive GDP data, BOE’s higher-for-longer stance, mild USD weakness, and a clean bullish structure on the chart:
→ Short-term Trend: Sideways → Support → Bullish Continuation
→ Directional Bias: Upside toward all 3 targets

Bitcoin Rejected at Supply1. MARKET CONTEXT
Bitcoin on the 1H timeframe has just tapped into a clear resistance / supply zone, where previous bearish impulses originated.
The reaction is identical:
- Immediate slowdown
- Loss of bullish momentum
- Selling pressure absorbing every attempt to push higher
This confirms the market is still range-bound, with liquidity building between supply above and demand below.
2 . TECHNICAL ANALYSIS
The chart structure highlights:
• Supply Zone Rejection
Price entered the resistance zone and instantly stalled — showing strong sell orders waiting in that area.
• Lower-Timeframe Shift
The current candlestick sequence shows a micro shift from bullish impulse → correction → bearish intent.
• Liquidity & Imbalance Below
There is an unfilled region between current price and the demand zone, creating a clean path for the market to drop.
• Demand Zone Waiting at 89,300 – 87,770
This is where previous strong buy orders originated, making it the most logical target for the next bearish leg.
Overall, the structure favors a continuation downwards after a small corrective pullback.
3. TRADE IDEA
Bias: Short from the Supply Zone
The entry is positioned inside the resistance zone, aligning with institutional sell reaction.
Expected Price Behavior:
Minor bullish correction
Bearish continuation
Price targets the Demand Zone at 89,300 – 87,770
Trade Structure Shown on Chart:
Stop Loss: Above the supply zone
Entry: At resistance rejection
Take Profit: Demand zone below
This setup follows clean smart-money flow from supply → demand, with no structural break supporting a bullish reversal yet.

FED Turns Hawkish — Bitcoin Drops HardBitcoin has begun to move exactly in line with the projected downside structure. After rejecting the resistance zone around 91,543, price has broken below the short-term support and is now entering a clean retracement phase.
At this stage, BTC is likely to continue following the descending path toward the key liquidity zones highlighted on your chart:
Target 1: 89,068
Target 2: 87,794
Target 3: 86,386
The market structure shows clear lower highs and lower lows, signaling that sellers are currently in control. Until BTC can reclaim the mid-range zone above 90,800–91,000, the bearish outlook remains valid.
This corrective move is healthy for the broader trend, helping sweep liquidity and rebalance price before any larger directional expansion.

ETH Holding the Trendline - Bulls Aiming for the Resistance Zone1. MARKET CONTEXT
Macro sentiment remains stable, with crypto recovering after minor pullbacks. No major bearish catalysts risk assets are still supported as liquidity conditions remain favorable.
2. TECHNICAL ANALYSIS
Price is riding a clean ascending trendline.
A support zone sits directly below current price, providing a strong demand base.
Market structure remains higher highs – higher lows, confirming bullish control.
Expectation: a small pullback into trendline + support → continuation move upward.
3. TRADE IDEA
Bias: Long on retracement into support/trendline
Target: Resistance zone at 3440–3450
Invalidation: Break below the support zone
ETH is primed for a trend-continuation move as long as price respects the ascending structure.

ETH/USD Just Found Key Support - Is the Next Breakout Coming?🔹 MARKET BRIEFING – ETH/USD (1H)
Market State:
– Ethereum is holding strong above the key support level around 3,050, showing bullish momentum after bouncing from this level. A retest of the support zone seems to have set up the potential for another leg higher.
Key Levels:
– Support Zone: 3,050
– Target 1: 3,100
– Target 2: 3,150
– Resistance Zone: 3,200
Next Move:
– With price respecting support at 3,050, ETH/USD is poised for another rally toward 3,100 and 3,150, aiming for a test of the 3,200 resistance.

Is BTC Ready for a Major Breakout? Watch These Levels!BTC/USD 1-Hour Market Analysis
1. Current Price Structure
BTC has been trading within a range, bouncing between the resistance zone around 94,000 and the support zone near 89,300.
The chart shows clear retracements with higher lows forming within the support range, signaling potential for upward movement.
2. Liquidity Zones
The resistance zone (94,000) continues to act as a solid barrier. A breakout above this level could pave the way for price to surge higher towards the target levels.
On the downside, support zones (89,300) have been effectively holding, providing a floor for the price action.
3. Potential Scenarios
Bullish Scenario: If BTC breaks the resistance level (94,000), we can expect an impulsive rally targeting 94,500 and then reaching 95,000+.
Bearish Scenario: If BTC fails to hold above 89,300, it might retest the support zone, opening the door for a decline towards 87,000.
4. Market Sentiment
The market seems to be in a consolidation phase with liquidity accumulation at key support and resistance levels.
Investors should be cautious of false breakouts in this range as the market is in a waiting mode before key data releases (i.e., NFP, ADP) that could dictate the next major move.
5. Trading Strategy
Buy near Support at 89,300 with a target around 94,000.
Sell near Resistance at 94,000 if price fails to break through, targeting 92,000-91,500.
Be sure to monitor the liquidity closely as this could indicate a potential breakout or breakdown.

Is Rivian Setting Up For a Breakout?Hi Traders!
On Nov. 5th, Rivian created a daily bullish CHOCH pushing price to resistance at $18. The following weeks showed price returning back to retest that daily CHOCH. Since then, it looks to me that Rivian is working to complete a cup and handle pattern (Lower TFs).
IMO the daily and weekly look bullish, and Rivian could be setting up to break past resistance at $18. Therefore, my plan is to long swing Rivian to a potential target at $20. My ideal entry would be around/in between $16-$16.50, but when looking at a lower TF $17 area could be respected. Watching closely, and alerts are set!
*DISCLAIMER: I am not a financial advisor. The ideas and trades I take on my page are for educational and entertainment purposes only. I'm just showing you guys how I trade. Remember, trading of any kind involves risk. Your investments are solely your responsibility and not mine.*

EURGBP Analysis - Bearish Supply Loading + Reversal Zone📊 EURGBP – Detailed Structural Analysis (2H Timeframe)
The current EURGBP chart shows a well-defined sequence of structural shifts, liquidity sweeps, and supply–demand interactions that build a compelling bearish narrative—but only if the market respects the highlighted zone. Here's an expanded breakdown of what the chart communicates:
🟦 1. Major Supply Zone (Primary Reaction Area)
Price has pushed into a clearly marked bearish supply zone, formed by a previous displacement move to the downside.
This zone represents the origin of the earlier impulsive sell-off, meaning institutional orders may still reside here.
Inside this zone:
A Pattern Must label marks the exact sub-level where the reaction is expected.
A red highlight indicates the precision entry or rejection area within the broader supply range.
The market is attempting a retest of this supply after reclaiming short-term highs.
The reaction from this zone will determine whether the pair continues lower or attempts a deeper pullback.
🟩 2. Reversal Zone (Demand Base)
Lower on the chart, a large demand region is labeled Reversal Zone, showing where price consolidated and reversed previously.
Key insights:
This zone captured liquidity through several wick rejections.
Buyers stepped in aggressively, initiating the bullish move that is now challenging the upper supply.
This zone becomes an important downside target, should bearish structure confirm.
📉 3. Market Structure Overview
The sequence leading into the supply zone shows:
A series of higher highs and higher lows, indicating bullish momentum.
However, much of this movement appears corrective as it climbs into a previously unmitigated supply.
The sharp arrow drawn downward indicates a bearish expectation, anticipating that supply may overpower current bullish correction.
This aligns with a classic “rally into supply” distribution pattern.
🔍 4. Liquidity Considerations
The chart reflects:
Sweeps of internal liquidity during the climb.
A likely hunt for liquidity above the minor swing before reacting at the supply.
Clean equal lows below—perfect targets for a downside continuation.
The market may be engineering a liquidity trap before reversing.
🔄 5. Expected Scenario
If the supply zone holds:
A bearish rejection from the marked “Pattern Must” area could trigger a structure break to the downside.
Sellers may then push price toward the Reversal Zone to rebalance inefficiencies left during the rally.
If price invalidates the supply zone:
Expect continuation into a deeper premium region before reassessment.

GOLD at cut n reverse Level? What's next??GOLD - perfect move as per our last idea regarding Xauusd and now market have single supporting area that is around 4305-06
keep close it because that is our key level now n holding of that area can create a further bounce.
stay sharp
NOTE: we will go for cut n reverse below 4305.
good luck
trade wisely

USDJPY Analysis - Bullish Target + Targeting Unmitigated SupplyUSDJPY 2H – Reversal Zone Reaction & Targeting Unmitigated Supply
1. Market Structure Overview
USDJPY is currently trading inside a corrective phase after a strong bullish rally that topped out around the 156.7–157.0 region. After that peak, sellers stepped in aggressively, creating a deep displacement to the downside that shifted the market temporarily into a bearish structure.
The decline formed a clean QL (Liquidity Run) and then stabilized as price entered a deeper retracement.
2. Key Liquidity Events
The chart highlights two important liquidity operations:
• Liquidity Grab (QL)
Price swept liquidity below a major structural low, triggering a strong reaction from buyers.
This confirms that smart money was accumulating positions around this region.
• Volume Burst Above (Unmitigated Supply)
There is a visible imbalance and unmitigated supply zone higher above, marked by a wide green zone.
This zone is likely to attract price as institutions tend to push markets back into these inefficient areas to fill remaining orders.
This creates a bullish short-term target even if the larger structure remains mixed.
3. Reversal Zone Reaction
Price dipped into the Reversal Zone (Demand Zone), where:
Previous selling pressure weakened
Multiple rejection wicks formed
A bullish engulfing structure signaled buyer aggression
Price reclaimed minor structure levels
This confirms the zone as a valid demand region and explains the strong bullish reaction seen on the 2H timeframe.
4. Intraday Structure Shift
After tagging demand, price broke above a minor swing with a clean iBo (Internal Break of Structure).
This is significant because:
It validates the bullish continuation toward the next major target
It signals that intraday momentum has shifted upward
It gives buyers a roadmap toward the unmitigated supply zone
This upward move is the rally currently in progress.
5. Target Zone (First Objective)
The chart highlights a Target Zone just below the Volume Burst area.
This is the first take-profit region for longs because:
It contains unfilled imbalance
Short-term liquidity sits above recent highs
Supply exists at the base of the previous major sell-off
Once price reaches this area, traders should watch for:
Exhaustion candles
Bearish confirmation patterns
Failure swings
Rejection wicks
This zone is crucial for potential trend reaction.
6. Volume Burst Zone (Major Reversal Supply)
The upper green zone (Volume Burst) represents a high-probability reaction area where the previous heavy selling originated.
Expect possible behavior such as:
Sudden rejection
Liquidity sweep and reversal
Consolidation before a deeper drop
Bearish confirmation patterns (engulfing, MS shift, etc.)
This zone is likely where the next major short opportunity may form, as indicated by the arrow pointing downward.
7. Expected Price Path
Based on the chart's arrows and structure:
Short-Term:
Price continues pushing upward to fill inefficiencies and tap into the target zone.
Mid-Term:
Depending on flow, price may reach the deeper Volume Burst zone.
Reversal Scenario:
A bearish pattern in these upper zones would signal a potential move back toward the mid-range or even the Reversal Zone again.
Patience is key—confirmation is required before entering any short position.

BTCUSD Analysis - Major Supply Zone + Reversal1. Higher-Timeframe Context
BTC is currently trading inside a broad consolidation range after a strong impulsive leg to the upside followed by an equally sharp corrective decline. The market has created clear liquidity pockets both at the top and bottom of the range, suggesting price is hunting for inefficiencies rather than trending cleanly.
The current structure shows that BTC is in the middle of a retracement phase after rejecting the lower boundary of the range.
2. Impulse Move & Liquidity Grab
A significant vertical bullish impulse can be seen near the left side of the chart, creating a sharp displacement candle. This move broke short-term structure and left behind a clean imbalance.
After the rally, price failed to maintain directional continuation and rotated back lower, indicating the move acted more like a liquidity sweep rather than genuine trend continuation.
This is important because markets typically return to revisit these inefficient zones before deciding the next major direction.
3. Reversal Zone (Key Supply Area)
The highlighted green zone represents a high-probability supply area where:
Volume Burst: Indicates aggressive buy-side activity that may have come from late buyers or trapped longs.
Reversal Zone: This is the last major bearish origin block that caused the breakdown. Price re-entering this area signals a likely reaction.
A reaction here is expected because this zone contains both:
Unmitigated supply
Liquidity engineered above recent swing highs
This combination often creates a magnet for price and a turning point afterward.
4. Expected Price Behavior
Price is currently climbing back toward the Reversal Zone.
The chart suggests two possible scenarios:
Scenario A – Pattern Confirmation Before Short
Price taps the reversal zone, forms a bearish confirmation pattern (e.g., bearish engulfing, 2-candle reversal, break of intraday low), and begins trending downward.
This aligns with the diagram arrows showing rejection and continuation down.
Scenario B – Liquidity Grab Then Rejection
Price may wick slightly above the zone to collect liquidity, then sharply drop.
This is common behavior in areas with heavy wick rejections on history.
A clear message noted on the chart: “Need Pattern Here” – meaning that entries should only be attempted once the market shows clear reversal structure, not by blindly shorting the zone.
5. Short-Term Targets if Rejection Happens
If rejection confirms, potential downside targets include:
Return to mid-range
Retest of intraday support around recent consolidation
Lows near 90,800–91,200
Possible extension toward the range bottom if momentum increases
These levels are visible on the chart where previous structural lows were formed.
6. Market Psychology at This Zone
This area is important because:
Buyers who bought late in the impulse are trapped
Short sellers are waiting for optimal entries
Liquidity accumulates above swing highs
Institutions often push price into such zones to fill large orders
This creates a high-probability reversal environment, but confirmation is essential.

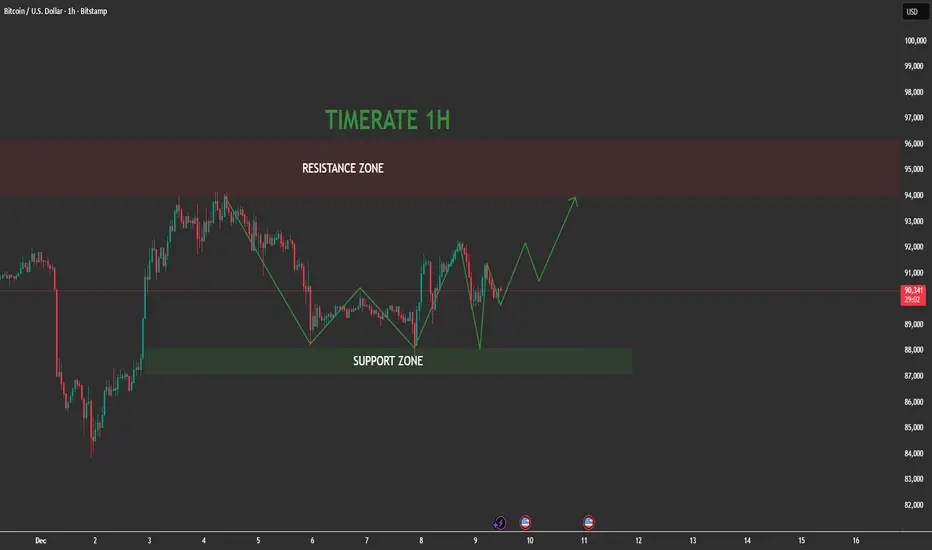
Is Bitcoin Quietly Building Power for a Breakout?📌 1. Market Structure
Bitcoin on the 1H timeframe is forming a clear higher-low structure off the support zone.
Price rejected the green support block aggressively, showing buyer absorption.
The current structure is transitioning from a consolidation phase into a potential bullish continuation leg.
📌 2. Key Zones
Support Zone (Strong Demand):
- Located around the $88,800 – $89,400 region.
- Price has tapped this zone multiple times and continues to bounce — clear demand.
Resistance Zone (Major Supply):
- The large red block at $94,000 – $97,600.
- This is the target zone for the next impulse move.
📌 3. Price Action
- Price formed a V-shaped recovery from support.
- Followed by a sequence of HL → HH attempts, signaling trend resumption.
- The latest pullback is shallow — a bullish sign showing sellers are weak.
- The green projection aligns perfectly with standard bullish market flow:
higher low → push up → correction → strong breakout leg.
Momentum is slowly shifting from neutral to bullish.
📌 4. Technical Confirmation
-Buyers defended support with strong reaction wicks.
-No breakdown beneath the key swing low — bullish structure intact.
-Mid-range is now acting as a local accumulation zone.
-Liquidity above $91,200 and $92,500 is likely to be targeted next.
This setup aligns with classic trend continuation inside a wide range.
📌 5. Trading Plan (Entry – SL – TP)
🎯 Long Setup
Entry: 90,300 – 90,450
Stop Loss: 89,650 (below last swing low & support zone)
Take Profit 1: 92,500
Take Profit 2: 94,800
Final Target: 97,500 (top of resistance zone)
Why this works:
You’re entering on a bullish higher low, with low risk and high reward as price moves toward the resistance block.
BTC Is Coiling Up — One Big FED Candle Will Decide....BTC MARKET ANALYSIS – 1H
1. Current Price Structure
- BTC continues to move inside a wide sideway range, with price repeatedly rejecting both the resistance zone and the support zone.
- After the strong drop earlier, the market has entered a compression structure, signaling accumulation rather than continuation of the downtrend.
- The sideway zone is clearly defined:
+ Resistance zone: 92,500 – 93,500
+ Support zone: 88,700 – 89,500
The repeated sweep of highs and lows shows liquidity collection, a classic sign of market-makers positioning before major macro events.
2. Liquidity Zones
- Resistance liquidity: A large cluster located at the top of the range. Price has tapped this zone multiple times → liquidity is building for a potential breakout.
- Support liquidity: Several wick spikes into the support zone indicate stop-loss hunts and accumulation by larger players.
- BTC is effectively building a liquidity box, preparing fuel for the next impulsive move.
3. Today’s Market Scenario
🔹 Main Scenario – Sideway Until FED → Then Breakout
- BTC is entering a news compression phase, where the market moves sideways waiting for high-impact events.
- With FED policy statements and U.S. inflation data approaching, traders and institutions are delaying large entries.
The structure suggests:
+ Price continues ranging inside the sideway zone.
+ More false breaks (liquidity taps) both at support and resistance.
+ Once FED news is released → volatility expansion.
+ Highest probability: BTC breaks the resistance zone upward after news clears uncertainty.
This aligns perfectly with your green-path projection on the chart.
4. Market Psychology
Before major macro announcements, the market often freezes, showing:
- Low volatility
- Tight consolidation
- Fake moves above and below the range
Smart money avoids early positioning; instead, they accumulate inside the range.
Retail traders become confused or trapped → ideal environment for MM to collect orders.
Sideway → Liquidity → News → Expansion.
This is exactly the structure BTC is showing now.
5. Intraday Strategy
Do not chase breakouts before FED → high probability they are false moves.
Best strategies:
- Buy near support zone with tight SL.
- Sell near resistance zone if price rejects and stays below.
- Wait for FED announcement → then trade breakout with confirmation.
Upside target after clean breakout: 94,500 – 96,000
Potential expansion if momentum is strong: 98,000+
Stay patient. Sideways is not weakness — it’s preparation.
The market is saving energy for the traders who know how to wait.

XAU/USD Technical Analysis: Breakout & Bullish Target Senario📈 XAU/USD (Gold) 30M Technical Analysis: Breakout & Two Key Scenarios
📌 Summary of Current Setup
The XAU/USD pair has recently shown a clear break to the upside out of a well-defined short-term consolidation pattern, suggesting a bullish shift in immediate momentum. The price is currently resting right at the top of a crucial short-term resistance level, which is being tested by a high-momentum candlestick.
📝 Detailed Analysis
1. Consolidation Breakout
Previous Pattern: The chart highlights a period of sideways movement within a downward-sloping channel (or bullish flag/pennant in a larger context, though locally defined as a channel). This channel, visible from the late hours of the previous day into the current day's trading, represented a period of accumulation/distribution.
The Break: Price has successfully broken above the upper boundary of this consolidation channel/zone around the 4,275 - 4,280 area. This breakout is a significant bullish signal, indicating that buyers have overpowered sellers at this stage.
2. Key Price Levels & Zones
Current Price Action: The price is trading right around 4,288.49 (Ask), positioned above the previous structure.
Mixed IFC Candle: The chart points to a "Mixed IFC Candle" (likely referring to an Institutional Flow Candle or a candle indicating indecision after a move). This candle, placed near 4,290.00, suggests a momentary pause or a minor struggle at the immediate resistance before the potential move higher.
Central Zone (Resistance/Target 1): The first major resistance area, marked as the "Central Zone," is identified roughly between 4,303.00 and 4,308.00. This zone is crucial as a near-term target for buyers and a potential turning point for a bearish reversal if the rally loses steam.
Target (Target 2): The ultimate bullish target for this specific setup is clearly marked around 4,335.00.
🔭 Two Potential Scenarios (Conditions)
The analysis correctly outlines two primary paths based on how the price interacts with the immediate resistance near 4,290.00 and the Central Zone.
Scenario 1: Bullish Continuation (Condition 1 - Preferred Path)
Trigger: Price manages to close decisively above the Central Zone (4,308.00) or successfully tests the immediate support/retest zone and pushes through the Central Zone without a deep pullback.
Action: This confirms strong bullish momentum and targets the ultimate price objective.
Target: 4,335.00 (Potential extension towards 4,340.00)
Invalidation: A decisive break and close below the recent breakout level (around 4,275.00).
Scenario 2: Short-Term Pullback/Retracement (Condition 2)
Trigger: The price rejects the immediate resistance near 4,290.00 or, more likely, rejects the Central Zone (4,303.00 - 4,308.00).
Action: A pullback towards the recently broken consolidation channel's upper boundary for a retest of support (the breakout level) is expected.
Retest Zone: A likely retest area would be near 4,275.00 - 4,280.00. A successful defense of this retest zone would re-establish Scenario 1.
Risk: If the retest fails and price drops back into the consolidation channel, the bullish bias is temporarily negated, and the pair may revisit the lower end of the previous range.
💡 Trader's Mindset & Strategy
Entry Strategy: Look for entries on a successful breakout above the Central Zone (4,308.00) or, more conservatively, look for a confirmation of support holding during the anticipated retest (Scenario 2) near 4,275.00.
Risk Management: A stop-loss should be placed logically below the established breakout level (e.g., below 4,270.00) to protect against a false breakout.
Profit Taking: Partial profits can be taken at the Central Zone (4,303.00 - 4,308.00), with the remainder targeting 4,335.00.

GOLD CYCLE ANALYSIS - WAVE 5 PATTERN EMERGING1️⃣ MACRO CONTEXT — GLOBAL CONDITIONS ARE RELOADING GOLD’S NEXT MEGA WAVE
Gold is entering a multi-year super-cycle powered by a rare combination of global instability and monetary shifts:
- Ongoing geopolitical conflicts (Ukraine, Middle East) continue to elevate safe-haven demand.
- U.S. economic momentum is slowing → rising recession probability.
- The market is pricing in aggressive Fed rate cuts in the coming year → real yields cooling, a direct catalyst for gold upside.
- Central banks (China, India, Turkey) are buying gold at the fastest pace in 50 years, diversifying away from the USD.
These macro foundations perfectly align with the repetitive growth cycle pattern displayed in chart.
2️⃣ STRUCTURAL ANALYSIS — GOLD IS REPEATING ITS 5-WAVE GROWTH CYCLE
On the 1D chart, gold is moving exactly within a classic 5-wave impulsive cycle:
Wave 1: A long accumulation zone → first breakout.
Wave 2: Shallow correction, maintaining higher lows.
Wave 3:The strongest expansion phase — identical to the 2024–2025 rally.
Wave 4: A consolidation wedge + sideway pullback inside the green zone you marked.
Wave 5 (Forming Now): The next explosive leg upward, projected by the white path on your chart.
Price is currently sitting inside Accumulation Zone 4, building energy before launching the final impulsive wave.
3️⃣TRADE SCENARIO — BASED ON STRUCTURE + MACRO ALIGNMENT
🔵 Primary Scenario: Bullish Super-Cycle Continues
If price holds the ascending yellow trendline and the Zone 4 support:
- Gold completes its corrective zigzag → then accelerates into Wave 5, aiming for new all-time highs.
Macro factors reinforce this bullish scenario:
- Fed rate cuts expected → lower real yields.
- USD entering a weakening cycle.
- Geopolitical tensions remain elevated.
- Central banks increasing gold reserves aggressively.
→ This is the dominant, high-probability scenario.
🔴 Secondary Scenario: Macro Repricing Pullback
Only triggered if:
- The Fed unexpectedly turns hawkish again (low probability),
- Geopolitical tensions ease significantly (low probability).
In that case, gold may retest lower zones:
3125 → 2523, exactly as marked on your chart.
4️⃣ RISK MANAGEMENT — WHEN THE MODEL FAILS
The super-cycle view becomes invalid if:
- Daily close breaks below the green Wave 4 accumulation zone.
- U.S. bond yields spike sharply higher again.
- DXY rallies above 115.
These conditions contradict the current global macro trajectory, so the probability remains low.
5️⃣ GOLD’S 5-WAVE PATTERN IS NOT RANDOM
Each accumulation zone (1–2–3–4) shares identical behavior:
- 6–12 weeks of tight consolidation
- Breakout triggered by macro news
- Each impulsive wave larger than the previous one
This is the footprint of a long-term impulsive super-cycle, currently unfolding from 2023–2026.
Given the macro backdrop and repeated structural pattern, Wave 5 is positioned to become the strongest and most extended wave of this entire cycle.
I

OVERVIEW MARKET XAUUSD #3 I 12/12📌 Market Context
Gold continues to maintain strong bullish momentum after a solid push from lower support levels. Price has now reached a short-term high and is trading near a high-liquidity zone, an area where the market typically shows consolidation or hesitation.
The overall trend remains bullish, supported by the rising trendline.
Key Volume Profile zones are still located much lower, indicating that price is currently trading in a premium zone — not ideal for initiating new buy positions at this level.
Buyers remain in control, but the current highs may trigger a corrective reaction before the next move develops.
📌 Price Scenarios
🔵 Scenario 1: Break Above the High → Bullish Continuation
If price completely breaks the current high with a strong H1 candle:
Nearest upside targets:
4,295
4,305
This scenario follows the trend, but the R:R will not be attractive for buyers entering at these elevated levels.
🔴 Scenario 2: Pullback into Volume Zones → Ideal Buy Opportunities
This is the main and safest scenario: If price fails to break the high and begins to retrace, potential buy zones include:
VAH zone: 4,221
POC zone: 4,200 – 4,206
VAL zone: 4,182 – 4,189
These Volume Profile zones previously generated strong bullish momentum, making them highly likely to produce a reaction or bounce.
🟡 Scenario 3: Trendline Break → Bullish Weakness
If price breaks below the rising trendline: The short-term trend turns weak.
Downside targets:
4,205
4,188
Potentially deeper to 4,170 if strong selling pressure occurs. This scenario only activates when buyers lose control.
📌 Summary
- Price is currently at the highs, making it unsuitable for new buy entries.
- Wait for a pullback into Volume Profile zones to secure better entries and improved R:R.
- The main trend remains bullish, so prioritize buying at support zones — avoid selling unless there is a very clear signal.
- Watch price behavior around VAH – POC – VAL for the safest entry confirmation.

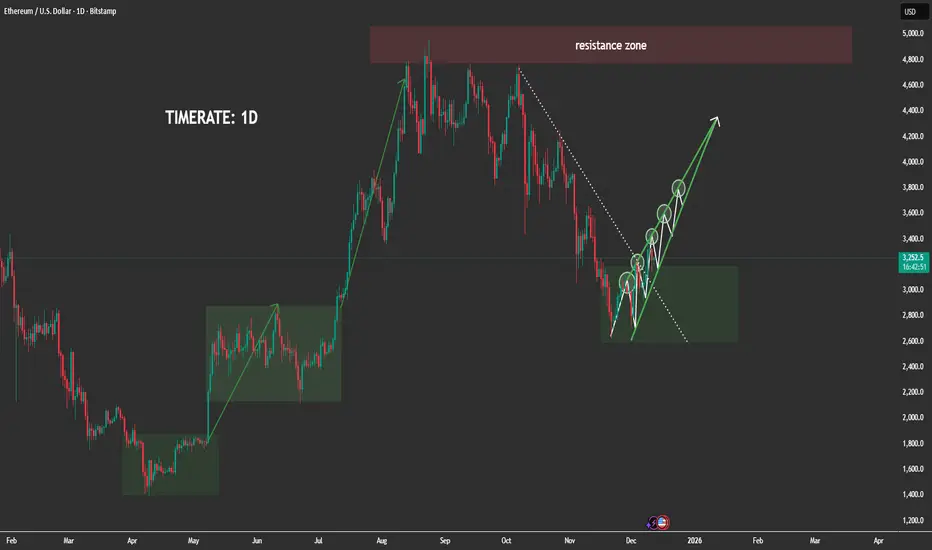
The ETH Move No Trader Is ExpectingETHEREUM 1D MARKET ANALYSIS
1. Current Price Structure
- ETH previously completed a strong bullish impulsive wave, breaking through multiple resistance levels before reaching the major 4,800–5,000 resistance zone, where the market formed a clear distribution top.
-After distribution, price entered a large corrective decline, following the descending dotted trendline visible on your chart.
-Recently, ETH has formed a broad accumulation block (highlighted in green), similar to the previous accumulation phases that triggered massive ETH rallies earlier in the year.
Inside this zone, ETH is now building a series of higher lows, showing early signs of bullish reconstruction.
-The current rising green structure indicates that price is forming a stair-step bullish pattern, preparing for a potential macro reversal.
2. Key Liquidity Zones
-Major Resistance Zone: 4,800–5,000
-This is the next major destination if ETH successfully completes the accumulation and transitions into expansion.
-Accumulation Block: 2,750–3,150
-This is where smart money is currently active — sweeping liquidity, trapping sellers, and accumulating long positions.
-Multiple liquidity grabs have already occurred inside this range, confirming strong institutional absorption.
-The current structure closely mirrors previous accumulation rectangles on the chart that led to massive bullish expansions.
3. Today's Market Scenario (1D Outlook)
Matches perfectly with the upward projection on your chart.
🔹 Main Scenario – Bullish Continuation After Accumulation
ETH is likely to follow this sequence:
-Continue building higher lows inside the accumulation block.
-Retest the inner structure trendline without breaking the macro zone.
-Form a clean break above the descending dotted trendline — signaling a bullish structure shift.
-Retest the broken trendline to form the final higher low.
-Begin expansion to the next major liquidity magnets:
-Short-term targets: 3,600 → 3,800
-Mid-term continuation: 4,200 → 4,500
-Macro target: 4,800–5,000 resistance zone
This is fully aligned with the green arrow projection you drew.
4. Market Psychology
-Big players are actively accumulating within this wide range clear repeated liquidity sweeps prove institutional activity.
-Retail traders are losing positions during sudden spikes and false breakdowns, which is typical behavior during accumulation phases.
-The market is more likely preparing for a major trend reversal, not a continuation downward.
-The price behavior mirrors earlier patterns:
Accumulation → Trendline Break → HL Retest → Massive Expansion
-This repetition increases confidence in the bullish outlook.
5. Intraday Strategy Guidance (1D)
Given the macro accumulation:
-Avoid selling aggressively the probability is against sustained bearish continuation.
-Best opportunities come from buying dips inside the accumulation zone.
-Watch for liquidity sweeps below local lows to identify smart-money entries.
High-probability setups:
✔️ Strategy 1: Buy the Bottom of the Range
Entry zones: 2,750–3,150
Targets: 3,600 → 3,800
✔️ Strategy 2: Buy the Retest After Trendline Breakout
This is the cleanest and safest setup.
Targets: 4,200 → 4,500 → 4,800+
ETH is currently in the prime zone where large investors position themselves before a new bullish cycle.
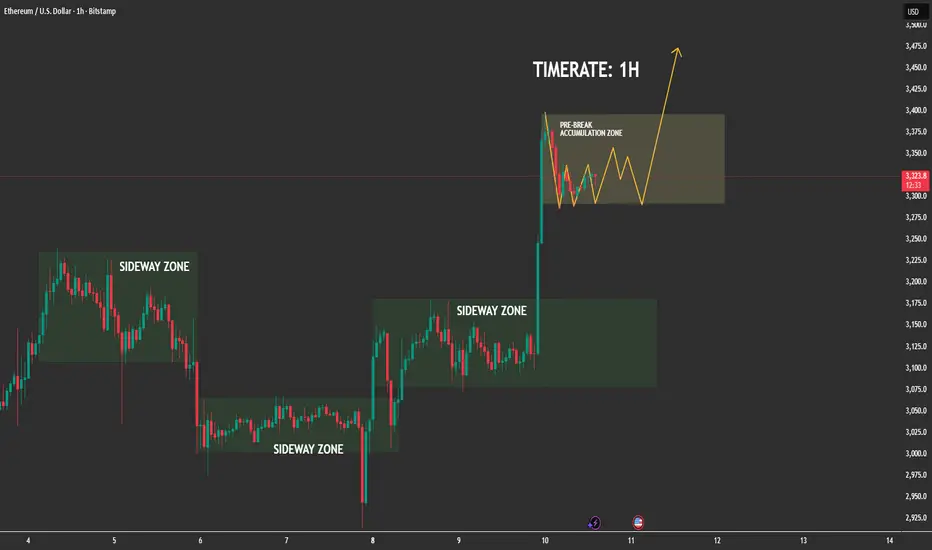
Ethereum Has Entered Its Pre-Expansion Accumulation📊 (1) MARKET STRUCTURE — CLEAN SIDEWAY → BREAKOUT → RE-ACCUMULATION
The chart shows a repeating pattern:
✔ Phase 1: Sideway Zone
ETH repeatedly compresses in sideways zones, forming liquidity pools and equal highs/lows.
✔ Phase 2: Breakout With Strong Momentum
Each sideways block ends with a powerful impulsive candle clear evidence of aggressive buy-side imbalance.
✔ Phase 3: Post-Break Re-Accumulation (CURRENT PHASE)
Price is now inside the highlighted pre-break accumulation zone,
moving in a tight, controlled structure a textbook bullish continuation setup.
This is the phase where institutional traders rebalance orders before the next run.
📍 (2) PRICE BEHAVIOR — BULLS IN FULL CONTROL
-No sharp rejections after the breakout
-Dips are shallow and quickly absorbed
-Market is forming higher low micro-structures
-Momentum clearly stays in the hands of buyers
This confirms the market is not distributing, but absorbing liquidity and building a base.
🌐 (3) MACRO FACTORS SUPPORTING ETH UPSIDE
✔ ETH ETF Approval Momentum (US + Asia)
Regulatory mood continues shifting positively, with multiple jurisdictions preparing Ethereum ETF products. Institutional demand keeps increasing quietly in the background.
✔ Falling US Inflation & Dovish Fed Expectations
Recent CPI and PPI reports show cooling inflation. The market widely expects 2025–2026 rate cuts, which historically push liquidity into risk assets ETH benefits directly.
✔ Ethereum Supply Shock
-Over 27% of ETH is staked
-Net supply remains deflationary under high network activity
-Reduced exchange reserves signal accumulation
This creates a tightening supply environment that amplifies price expansion.
✔ Altcoin Rotation Phase
BTC dominance stabilizing → capital increasingly flows into ETH and large-cap alts.
Macro + on-chain + liquidity flows all align with a bullish continuation.
⏳ (4) HTF CONTEXT — BULL CYCLE CONFIRMED
Higher timeframes show:
-ETH broke out of a weekly compression range
-Structure is fully bullish
-Market currently resetting before next leg
-No bearish reversal signals anywhere in sight
This supports the thesis that the current 1H accumulation is not random, it is part of a much larger bullish leg forming.
🚀 (5) EXPECTATION — HIGH PROBABILITY SCENARIO
ETH is expected to:
-Continue oscillating inside the pre-break accumulation zone
-Form a series of small higher lows as drawn
-Absorb liquidity from both sides
-Break out toward 3,400 → 3,450+
The path of least resistance remains upward.
🎯 (6) TRADING INSIGHT (Non-Signal)
Markets only explode after liquidity is collected.
ETH is doing exactly that holding strong after a breakout and compressing before expansion.
This is the signature behaviour of a healthy bullish trend.