USDJPY 4H Buy Setup with Levels!Hello Everyone,
Let's see how this pair will perform based on the analysis.
Based on my analysis I'm sharing my view.
Make sure you do your research, and based on your confluence, please look for the entry.
Don't rush your trades without any confirmation.
Use proper risk management always and trade safe.
Thank You All in advance for checking my trade idea for your Likes, Comments & Follows, Highly Appreciated your support!
Get the updated ideas.
FOLLOW | LIKE | COMMENT | SHARE
If this analysis helps you plan better 📈
Chartanalysis

Nvidia: Downside Pressure Nvidia has recently faced notable downward pressure, but so far has managed to hold above the support level at $176.21. As a result, we continue to anticipate an imminent rally as part of the beige wave V, which should lift the stock into the now-red Target Zone between $227.38 and $260.60. However, if the stock immediately drops below the $176.21 mark, we would expect a new low for the beige wave alt.IV, with the lower $145.50 level still likely to hold.

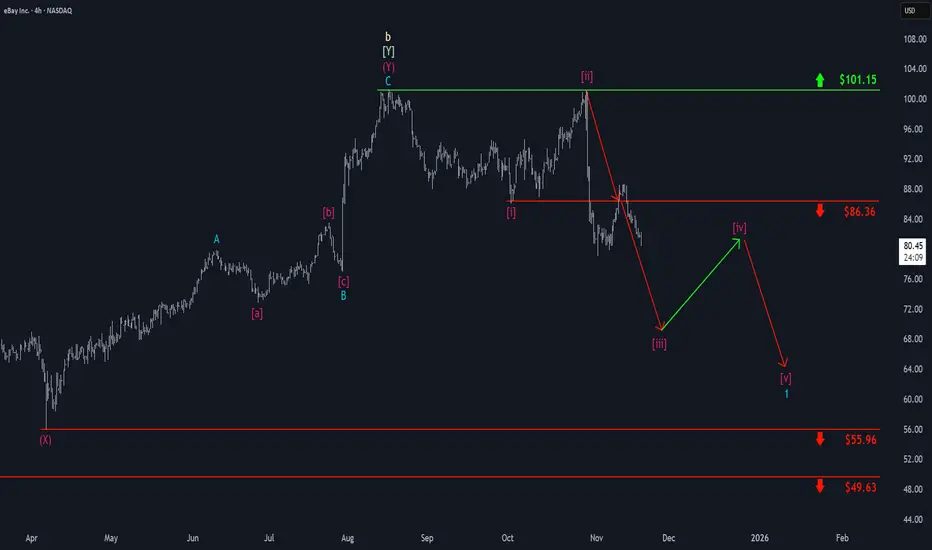
eBay: Set for Further DeclineseBay has recently made another move higher, briefly reclaiming the $86.36 level. However, the stock has since resumed its downward trajectory as anticipated and is expected to continue selling off soon as part of magenta wave . Overall, this magenta downward impulse should push price closer to support at $55.96, completing turquoise wave 1.
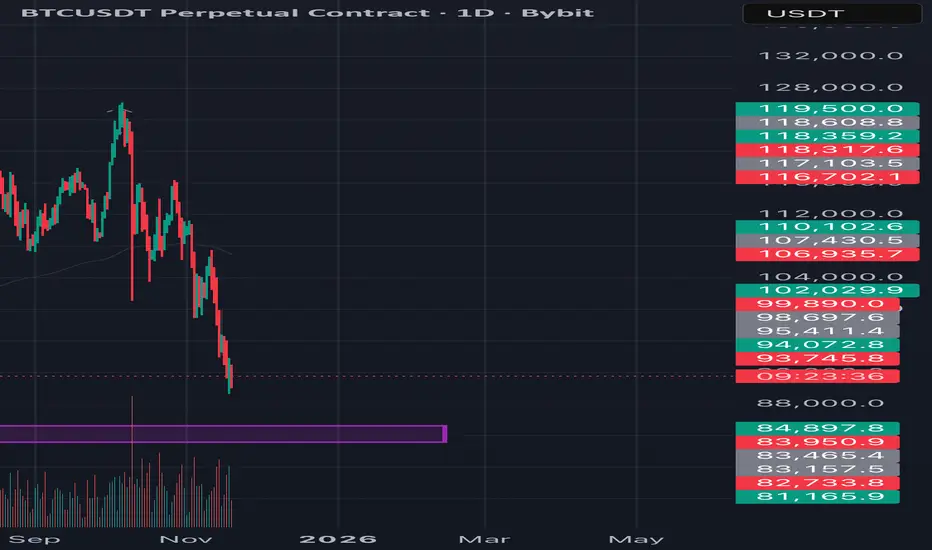
BTC DAILY KEY LEVEL APPROACHING BTC has been on a down trend for a while now and is currently approaching a daily demand zone which is the zone that caused the break of structure of the previous high on the daily time frame. So let wait for price to Tap into the zone and see if buyers will eventually kick in or probably break below it to continue the downtrend. Let wait for clear confirmation.
SONACOMS: Bullish Momentum ActivatedThis is the daily timeframe chart of SONACOMS.
The stock is trading within a well-defined upward channel, with the lower-boundary (LOP) support positioned near the 470–480 range. It is currently sustaining above this support zone.
If the stock continues to hold this level and the ongoing bullish momentum remains intact, SONACOMS may potentially move toward the channel resistance near the 600 level.
Thank you.

XAUUSD Bullish Setup Toward 4100XAUUSD is showing a bullish setup after sweeping liquidity and rejecting strongly from the order block zone. Price is pushing upward toward the 4100 target, supported by previous range breakout, FVG imbalance, and clear resistance levels above. The chart signals continuation to the upside.

Tesla: DownwardShortly after our last update, Tesla experienced noticeable downward momentum, initially entering our previously magenta alternative target zone, which has already been stopped out. We currently consider the green wave complete, and the alternative target zone has been deactivated and grayed out. However, there's still a chance the stock could rise sharply, confirming an ongoing upward trend. If this alternative scenario, which has a 35% probability, plays out, we would mark blue wave alt.(II) as complete and expect gains above the resistance at $509.50 and $532.92 within a magenta upward impulse. Primarily, we anticipate further sell-offs and expect the regular wave-(II) correction low to occur first in our green target zone between $157.88 and $46.70. This green zone could potentially be suitable for long entries, protected by a stop 1% below the zone's lower edge.

Gold Price Retest Setup – Key Supply Zones in FocusGold (XAUUSD) has broken below its ascending structure, forming a clear weak low and shifting into a bearish environment. Price is now attempting a recovery toward two major supply zones highlighted on the chart.
The first reaction zone sits near 4099–4121, where sellers may re-enter. If this level is breached, price could extend toward the upper supply zone around 4160+, where a deeper retracement is expected.
Market structure shows earlier BOS, CHoCH, and a clear EOH, confirming the bearish shift. Until a strong reversal forms, rallies into marked supply levels may act as sell opportunities
Gold has broken its bullish trendline and formed a weak low, confirming bearish control. Price is now pulling back toward the 4099–4121 supply zone, where the first rejection is likely. If buyers push higher, the next strong supply sits near 4160, expected to cap any deeper retracement. Until these zones break with strength, rallies remain sell-biased.

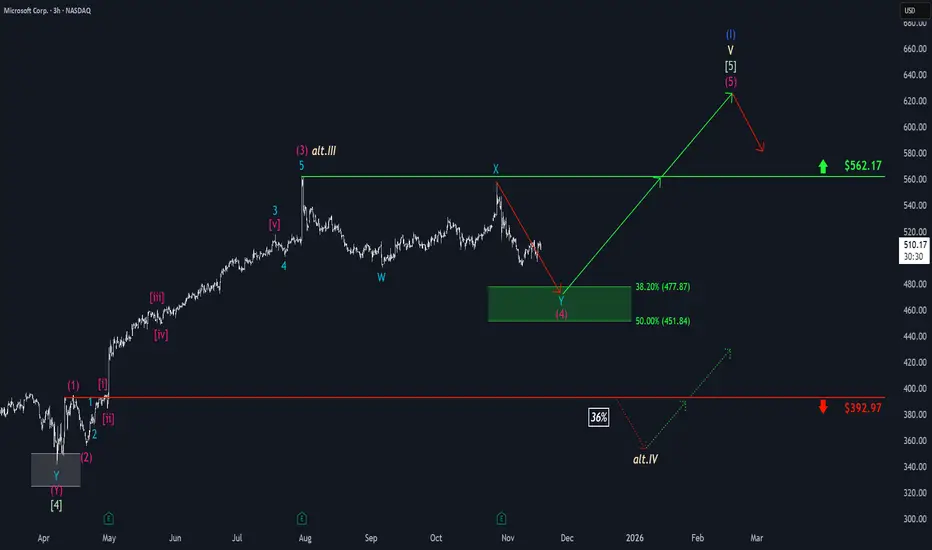
Microsoft: Stuck in Sideways PatternMicrosoft shares have continued to show weakness recently, although the stock has shifted into more of a sideways pattern. In the near term, we anticipate another downward move, which should establish the low for wave (4) in magenta within our green Target Zone between $477.87 and $451.84. From our perspective, this range remains attractive for long entries, as we expect a new upward impulse to follow as part of magenta wave (5). This move should push the stock above resistance at $562.17 and complete the larger blue wave (I). Alternatively, there is a scenario in which the high at $562.17 marks the end of beige wave alt.III (probability: 36%). In that case, we would expect a substantial decline below support at $392.97, where the low of wave alt.IV would be found.
Silver Price Ready for Lift-Off: Bullish Channel Silver (XAG/USD) is consolidating within a rising channel, with strong Ichimoku cloud support hinting at a potential bullish breakout. After a brief pullback to the lower channel boundary, price action shows signs of rebound momentum targeting the $54 resistance zone. A confirmed break above $53 could trigger an upward move equal to the channel height, continuing the bullish trend. Traders are watching for a breakout confirmation above the midline for a potential long setup.
🧭 Chart Overview
Timeframe: 30-minute chart
Indicator: Ichimoku Cloud (9, 26, 52, 26)
Price: $52.67 (as of the chart time)
Trend Channel: Rising (ascending parallel channel)
---
📊 Price Action Analysis
1. Trend Structure:
The chart shows Silver trading inside a well-defined ascending channel, respecting both upper and lower boundaries.
Price recently bounced off the lower channel support, which often acts as a bullish signal within an ongoing trend.
2. Ichimoku Cloud (Kumo):
The price is hovering around the top of the Ichimoku cloud, suggesting neutral-to-bullish sentiment.
The cloud’s future span (Senkou Span A > Span B) points slightly upward — a sign of potential continuation of the uptrend.
Support lies near the $52.50–$52.60 zone, which aligns with both the lower channel line and the top of the cloud — a strong confluence area.
3. Momentum Observation:
The recent correction looks more like a healthy retracement than a reversal.
Buyers are likely waiting for confirmation before pushing higher.
4. Breakout Levels:
Immediate Resistance: $53.40 (mid-channel + previous top).
Major Resistance: $54.00 (upper channel target).
Support Zone: $52.50–$52.00 (Ichimoku + trendline confluence).
---
🚀 Bullish Scenario
If price closes above $53.40, it would confirm a breakout of the short-term consolidation pattern.
The projected move (based on the channel height) suggests a target near $54.50–$54.60.

Chart Analysis on SPY. Week of November 17 will be ImportantChart Analysis on SPY. Week of November 17 will be Important. Spy could go down to next support or next major resistance. Next week will be very interested

“XAUUSD Trendline Break: Possible Retracement Before Next Move”Gold (XAUUSD) has broken below the rising trendline and Ichimoku support zone, showing strong bearish momentum. Price is currently trading around 4112, after rejecting the upper consolidation zones marked on the chart.
The chart highlights two potential retest zones:
1️⃣ First Retest Zone: 4155–4160 (Minor Supply)
This is the first reaction area after the breakdown.
If price retests this zone and rejects, sellers may re-enter strongly.
Ideal for short-term bearish continuation setups.
2️⃣ Major Retest Zone: 4175–4180 (Strong Supply)
A deeper pullback level where previous support has turned into resistance.
If price reaches this region, look for bearish confirmation signals before entering.
Bulls need a clean breakout above this zone to regain control.
Overall Outlook
Trendline break indicates a temporary shift in momentum.
Watch for pullback → rejection → continuation setups.
A bullish recovery only becomes valid if gold reclaims 4178+ with strong volume.
1️⃣ Trendline Break Confirmed
Price broke below the long-respected ascending trendline.
This signals a shift from bullish to bearish momentum.
The breakdown is strong and supported by a sharp red candle.
---
2️⃣ Ichimoku Cloud Bearish Shift
Price moved below the cloud → bearish signal.
The cloud ahead is thinning, showing weak bullish support.
Momentum is favouring sellers.
---
3️⃣ Previous Consolidation Blocks Marked
You highlighted three old consolidation zones (rectangles).
These zones acted as liquidity pools, and price used them before continuing higher.
Now, price has fallen below them, meaning old support = new resistance.
---
4️⃣ Two Key Retest Levels Identified
First retest (minor): 4155–4160
Closest supply zone.
Price may bounce into this area before rejecting.
Ideal for short-term sell setups.
Major retest: 4175–4180
Stronger resistance zone.
Previously acted as support.
Clean rejection here would confirm continuation to the downside.

RENDER: Slightly higherRENDER recently managed to push higher once again. Currently, within the larger turquoise wave Y—which is developing as a five-wave move in magenta—it is expected to continue its upward momentum in the near term. As a key initial step, price should break above resistance at $5.51.

XAUUSD Breakdown After Trendline Violation –Bearish ContinuationGold has broken below a long-held ascending trendline and slipped under the Ichimoku cloud, confirming a shift in market structure. After the breakdown, price is now forming potential pullback zones near 4130–4155, where sellers may re-enter. The chart highlights previous consolidation blocks, the trendline retest area, and projected bearish continuation levels.
This setup suggests:
Trendline break = bearish momentum shift
Retest zones identified for possible short entries
Lower targets likely if price rejects from resistance zones
Ichimoku showing cloud resistance + bearish sentiment
XAUUSD Technical Analysis – Strong Bearish Momentum After Trendline Breakdown
1. Major Trendline Break (Key Event)
The chart shows gold breaking below a long-term rising trendline that had been respected for several sessions.
This is the strongest signal of a trend reversal from bullish → bearish.
Once price broke the trendline, momentum increased sharply to the downside.
---
2. Ichimoku Confirms Bearish Shift
Price is trading below the Ichimoku cloud, meaning bearish momentum dominates.
The cloud ahead is thin and declining, suggesting weak future support.
Trend bias = Downtrend.
---
3. Key Pullback (Rejection) Zones
Two major resistance areas are marked on your chart:
Zone 1: 4130 – 4140
A shallow pullback zone where early sellers may enter.
If price retests here and rejects, expect continuation downward.
Zone 2: 4148 – 4155
The higher, stronger resistance zone.
This aligns with:
Broken trendline retest
Ichimoku cloud edge
Previous structure zone
This is the ideal short-entry zone for institutional/smart money traders.
---
4. Structure Breaks Confirm Bearish Bias
Market broke:
Previous consolidation blocks
Higher lows
Support levels around 4080–4100
This indicates clear displacement and strong bearish intent.

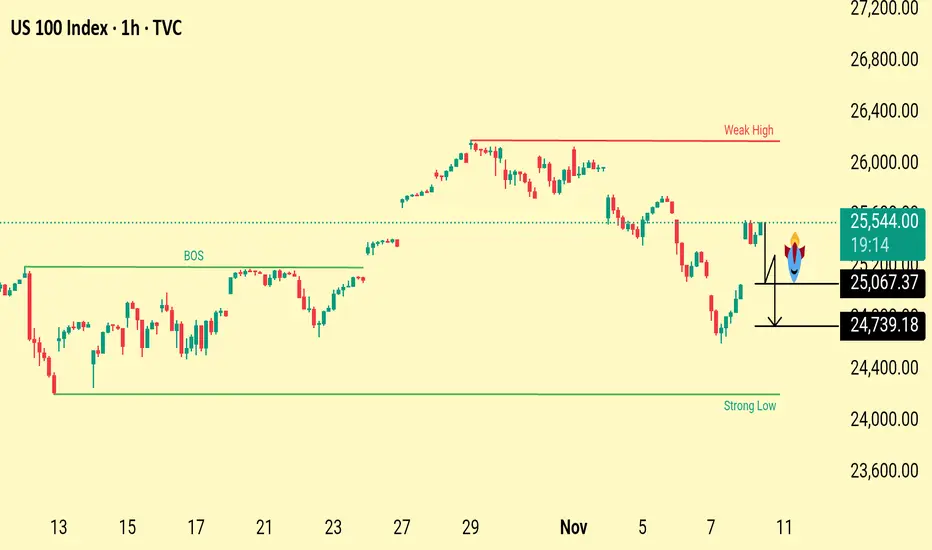
US100 Price Action Outlook Weak High Target&Liquidity SweepZonesThe chart highlights a weak high above current price action, suggesting potential upside liquidity targets. Below, key downside levels at 25,067 and 24,739 mark liquidity pools and possible retracement zones if price rejects current resistance. The structure shows a recent break of structure with both bullish and bearish scenarios in play.
Price is reacting near a resistance area after a recent bounce. The weak high above suggests liquidity may be targeted before any reversal. If price rejects this zone, the next downside levels to watch are 25,067 and 24,739, where liquidity sits and buyers may step in. Structure remains mixed, with both upward liquidity grabs and potential pullbacks likely
Uber: Pulling BackUber has recently pushed higher toward resistance at $101.99 before pulling back noticeably from that level. This move aligns perfectly with our primary scenario, as we continue to expect a broader sell-off into the turquoise Target Zone between $68.29 and $59.15 as part of turquoise wave 4. Within this zone, we anticipate price will reverse and resume its broader upward trend, eventually breaking through the $101.99 resistance. However, if Uber reverses course soon and breaks above the $101.99 mark without setting new lows, we would then expect a new high for turquoise wave alt.3 . We currently assign a 35% probability to such a delay in the ongoing upward impulse.

GOLD at major support and Cut n Reverse area??#GOLD... market just reached near to his today ultimate area that is around 4112 13
Keep close and if market holds than bounce expected otherwise not at all..
NOTE: we will go for cut n reverse below that on confirmation ..
Good luck
Trade wisley

E2E Networks : Future Multi-Bagger in Data Center IndustryE2E Networks is currently moving inside a large symmetrical triangle on the weekly chart, indicating a phase of long-term consolidation before a potential major move.
🔹 Support Trendline : The lower trendline has been respected multiple times since mid-2023
🔹 Resistance Line : Price is repeatedly getting rejected from the upper descending trendline
🔹 Key Buying Zone : Around ₹2,280 – ₹2,300, which aligns with the long-term support trendline
🔹 Volume : Noticeable spikes during pullbacks, showing active participation on dips
As long as the price holds the ascending support line, this zone can offer a favorable risk–reward setup for long-term investors. A breakout above the upper trendline may trigger the next strong uptrend.
📌 Not financial advice. Do your own analysis before investing.

Q4 | W46 | D14 | Y25 |GBPUSD FRGNT FUN COUPON FRIDAY 📅 Q4 | W46 | D14 | Y25 |
📊 GBPUSD FRGNT Daily Forecast
FRGNT FUN COUPON FRIDAY
🔍 Analysis Approach:
I’m applying Smart Money Concepts, focusing on:
Identifying Points of Interest on the Higher Time Frames (HTFs) 🕰️
Using those POIs to define a clear trading range 📐
Refining those zones on Lower Time Frames (LTFs) 🔎
Waiting for a Break of Structure (BoS) for confirmation ✅
This method allows me to stay precise, disciplined, and aligned with the market narrative, rather than chasing price.
💡 My Motto:
"Capital management, discipline, and consistency in your trading edge."
A positive risk-to-reward ratio, paired with a high win rate, is the backbone of any solid trading plan 📈🔐
⚠️ Losses?
They’re part of the mathematical game of trading 🎲
They don’t define you — they’re necessary, they happen, and we move forward 📊➡️
🙏 I appreciate you taking the time to review my Daily Forecast.
Stay sharp, stay consistent, and protect your capital
— FRNGT 🚀
FX:GBPUSD

Strategy: Downward Pressure Intensifies Strategy has continued to develop downward pressure as anticipated since our last update, bringing it closer to the targeted low of the turquoise wave 2. Our alternative—and now grayed-out—Target Zone has been breached to the downside, allowing us to remove the alternative scenario of a premature breakout to the upside. Investors who speculated on this alternative and entered within the alternative Target Zone with a stop 1% below the lower edge have likely been stopped out by now. For now, we are still allowing some room for turquoise wave 2 to move lower; however, it should find its bottom above the support at $102.40 to set the stage for wave 3 to advance further above the resistance at $674.18.

Gold Price Faces Resistance Near 4,207—Potential Pullback AheadGold (XAU/USD) is testing the upper channel resistance around 4,207 after a strong rally. The chart suggests a possible short-term correction toward the 4,200–4,158 support zone before the next directional move.
🟡 1. Current Trend
Gold (XAU/USD) is trading in an ascending channel, indicating an overall bullish trend.
Price action has been forming higher highs and higher lows, confirming steady upward momentum.
---
🔴 2. Resistance Zone
The upper boundary of the channel and price level around 4,207 USD is acting as a strong resistance.
The chart shows multiple rejections near this zone, suggesting a potential short-term top or profit-taking area.
---
🟢 3. Support Levels
The first key support is near 4,200 USD, aligning with previous price consolidation.
A deeper correction could test 4,158 USD, which matches the lower channel trendline and Ichimoku support zone.
---
⚫ 4. Price Action Pattern
The boxed consolidations represent sideways accumulation phases before each breakout — a sign of strong buying pressure.
However, the latest consolidation near the channel top hints at buyer fatigue, which could lead to a pullback.
---
🟣 5. Expected Move (Short-Term Outlook)
The downward arrows on the chart suggest a potential retracement within the channel.
Price could dip toward 4,158–4,200 USD before finding fresh buying interest.
As long as price remains above 4,158, the bullish structure remains intact.
---
⚙️ 6. Trading Implications
Aggressive traders: May look for short opportunities near resistance (~4,207) with tight stops above the channel.
Conservative traders: May wait for a bounce confirmation around 4,158–4,200 to rejoin the uptrend.

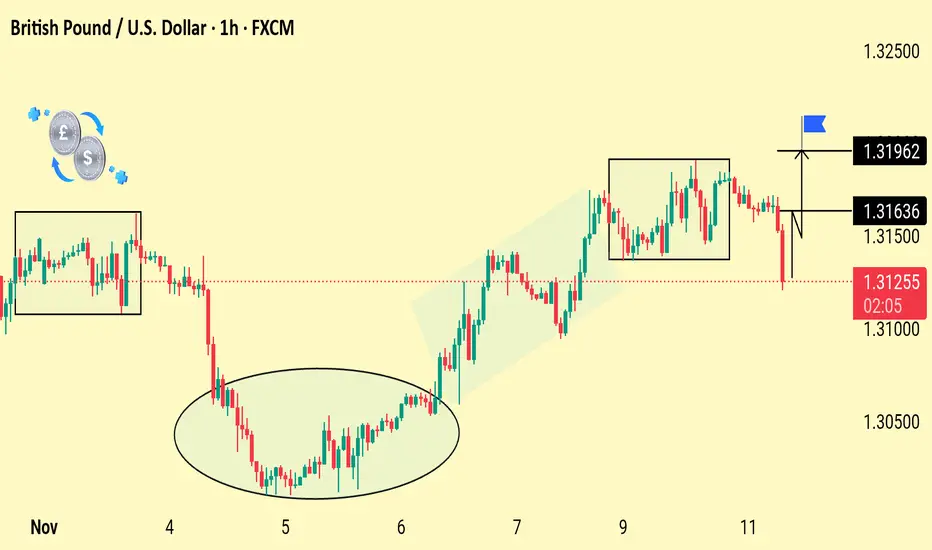
GBP/USD Breakout Watch: Key Levels in FocusGBP/USD is trading inside a consolidation zone after a sharp recovery. A breakout above 1.31636–1.31962 may signal bullish continuation, while failure to hold support increases downside risk.
Price dropped out of the recent consolidation box and is now trading below 1.31636 support. This breakdown shows short-term bearish pressure. If the pair stays below this zone, it may retest lower levels toward the recent lows. Bulls need a quick recovery back above 1.31636 to regain control.
PayPal: Further Downside ExpectedPayPal initially extended its decline as anticipated, before a modest upward rebound began to emerge. Overall, bearish momentum should primarily persist, likely pushing price below the $50.18 support level and completing the broader correction of the beige wave II. However, there is also a 39% probability that beige wave alt.II has already concluded. In that scenario, the stock would currently be developing a magenta upward impulse and would be in the process of forming (or would have already formed) the low of wave alt. . Wave alt. would then bring further gains, potentially breaking through resistance at $94.97.
