Gold Hits a New All-Time HighHello everyone, let’s take a look at XAUUSD today.
Gold continues its strong rally, trading around 4,480 USD, up more than 111 USD compared to the same time yesterday. Notably, this marks a new all-time high, decisively breaking above the previous peak.
The sharp rise is driven by surging safe-haven demand at the start of a shortened trading week due to holidays, amid escalating geopolitical tensions.
Gold gained further momentum after weekend reports that the United States is pursuing a third oil tanker near Venezuela. According to a U.S. official, President Trump has intensified oil sanctions against the government of Nicolás Maduro.
Bloomberg reported that the tanker being pursued was operating under a false flag and is subject to a court seizure order, believed to be the Bella 1, a Panama-flagged vessel sanctioned by the U.S.
These actions follow earlier incidents in which the U.S. military boarded the supertanker Centuries and previously the vessel Skipper. The blockade appears to be pressuring Venezuela’s oil storage capacity and could lead to production declines and broader civil instability.
From a technical perspective, the next upside target for February gold futures bulls is a break above the strong resistance at 4,500 USD per ounce. Initial support is seen at 4,400 USD, followed by the overnight low at 4,365 USD.
I remain bullish on gold—what’s your view?
Chartanalysis

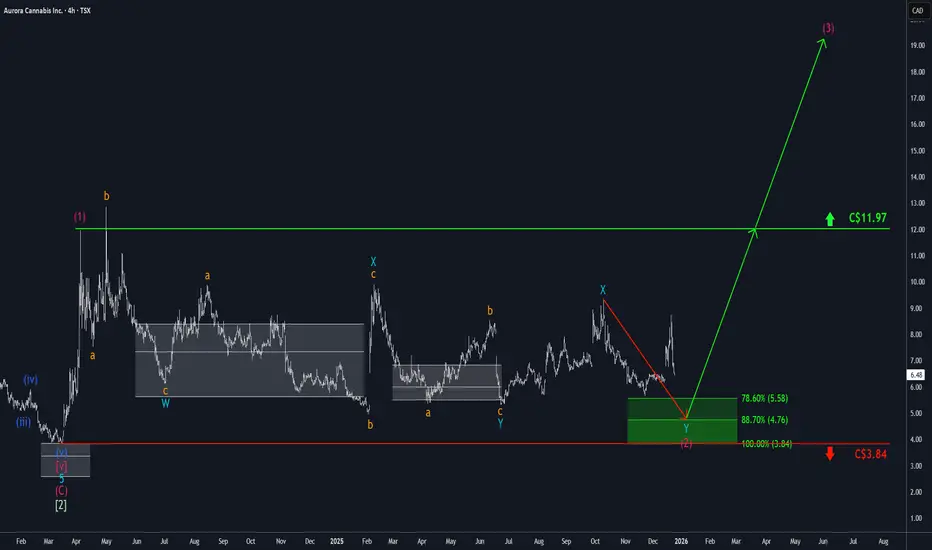
Aurora: PullbackIn the last seven days, Aurora initially saw a significant move upward, but sharp sell-offs at the end of last week erased nearly all of December's gains. These declines are, however, in line with our expectations: We still anticipate new lows within our green Target Zone between C$5.58 and C$3.84. Once the interim correction of the magenta wave (2) is complete, we expect a sustainable continuation of the overarching upward impulse. Wave (3) should then pave the way for gains above the resistance at C$11.97.
ETH/USD is on the Edge...🔹 MARKET BRIEFING – ETH/USD (1H)
Market State:
– Ethereum is currently trading within a descending channel, with price testing the lower boundary of the demand zone. There’s a clear structure setting up for a potential downside move toward the lower targets.
Key Levels:
– Supply Zone: ~3,170 – 3,180
– Demand Zone (Support): ~3,060 – 3,070
– Target 1 (TP1): ~3,014
– Target 2 (TP2): ~2,913
Next Move:
– A rejection at the supply zone may trigger a strong downside move toward the demand zone, with targets set for 3,014 and 2,913. If the demand zone holds, ETH/USD could rebound to test the upper boundary of the descending channel.

Based on the XAUUSD (Gold) 1h I 23/12Market Structure and Trend Primary Trend: Gold is currently in a very strong and steep uptrend. Trendline: There is an ascending trendline (black line) providing excellent support for the price. Currently, the price is trading above this line, indicating that buyers are in complete control of the market.
Value Area Analysis (Volume Profile) VAH (Value Area High): 4,474.525. The price has now moved above this zone, showing a state of bullish imbalance (the price is in a Bullish Discovery phase). POC (Point of Control): 4,408.760. This is the level with the highest trading volume from the previous period, acting as a very strong psychological support level if a deep correction occurs. VAL (Value Area Low): 4,378.692. This marks the lower boundary of the previous value area.
Candlestick Action and Market Pressure Buying Power: Continuous long green candles indicate very decisive upward momentum. Current Signs: After creating a short-term peak near the 4,500 area, the price is undergoing a slight pullback toward the VAH zone. The most recent candle is a green candle attempting to hold the price above the 4,474 level (VAH). Volume: The Volume Profile on the right shows a large accumulation of volume at the POC and a volume gap (low volume node) where the price spiked, meaning the price moved up very quickly with little resistance.
Potential Scenarios
Scenario 1: Retest and Continuation (Retest & Go) The price may correct to touch the VAH zone (4,474) or the black trendline. If buying pressure appears here (long lower wicks), the price will likely continue its momentum to reach higher milestones such as 4,520 or beyond.
Scenario 2: Deeper Correction (Deep Pullback) If the price closes below the 4,474 level and breaks the trendline, a deeper correction toward the POC zone (4,408) could occur to re-accumulate before new developments take place.
Technical Notes Key Support: 4,474 (VAH) and 4,408 (POC). Target Resistance: The 4,500 - 4,510 area.
In such a steep uptrend, remembering the goal and maintaining discipline is very important. You should prioritize observing reactions at the trendline and the VAH zone to find trend-following opportunities.

GBP/USD ANALYSIS H1 CHART I 12/23Market Structure and Trend Current Trend: The price is moving within a very clear ascending channel (Uptrend channel) marked by two parallel upward lines. Price Position: The price has just touched the upper boundary of the channel and is showing signs of a wick rejection, indicating short-term profit-taking pressure at this resistance zone.
Value Area Analysis VAH (Value Area High): This is the top of the value range, currently coinciding with the price level around 1.3500. The price is reacting exactly at this threshold. POC (Point of Control): Located around 1.3459. This is the level with the highest accumulated trading volume, acting as a magnet for the price if a correction occurs. VAL (Value Area Low): Situated lower at the 1.3412 area, marking the lower limit of the value area during this period.
Price Action and Volume Price Push: Previous long green candles show very active buying power as the price climbed along the center line of the rising channel. Current Signal: The most recent candle is a red candle (or has a long upper wick) right at the VAH zone. This suggests the price is struggling to completely break above the high value area to establish a new price floor.
Potential Scenarios
Scenario 1: Technical Correction (Healthy Correction) The price may correct from the top of the channel to retest the POC zone (1.3459). This is a necessary pullback to gain momentum before continuing the uptrend. If the POC holds firm, the uptrend remains very sustainable.
Scenario 2: Continued Momentum (Breakout) If the price consolidates sideways around 1.3490 - 1.3500 and then breaks decisively above the upper channel line, GBP/USD will enter a strong acceleration phase (moving outside the current value area).
Notes for Trading Goals Immediate Support: 1.3459 (POC) and the lower boundary of the channel. Immediate Resistance: 1.3500 (Round number and VAH zone).
A suitable strategy is usually to observe the reaction at the POC to find trend-following buying opportunities, or to be cautious with "chasing" buys at the top of the channel without a clear breakout.

BTC/USD 1h chart analysis I 12/231. Market Structure & ContextShort-term Trend:
The price is currently in a clear downswing after peaking near the $91,000$ area.
Trendline: A descending trendline (the black diagonal line) is acting as heavy resistance. As long as the price remains below this line, the bears maintain control.
Volume Profile (Value Area):
VAH (Value Area High): $89,678$
POC (Point of Control): $88,207$ (The level with the highest traded volume).
VAL (Value Area Low): $87,927$
2. Current Price Action Analysis
Value Area Breakdown: The price has recently dropped below the VAL ($87,927$). Trading below the Value Area is typically a bearish signal, indicating that the market perceives the current price as "expensive" relative to the previous value zone.
Failed Retest: There was an attempt to reclaim the POC ($88,207$), but it was rejected by strong selling pressure (long red candles).
Current Momentum: The latest candle shows a small wick at the bottom, but it remains near the local lows. Without a significant "bounce" or buy-side liquidity, the price is likely to hunt for support at lower levels (around $86,500$ – $86,000$).
3. Potential Scenarios
Scenario A: Continued Bearish Pressure (Higher Probability)
If the price fails to close back above the $88,000$ (VAL) mark within the next few hours, the sell-off will likely continue. The descending trendline remains the primary psychological and technical barrier.
Scenario B: Technical Recovery (Mean Reversion)
For a meaningful recovery to occur, BTC needs to:
Break and close above the black descending trendline. Reclaim the POC ($88,207$) as support.The next target would then be the VAH ($89,678$).
4. Trading Strategy Summary
Key Resistance: $88,200$ (POC) and $89,670$ (VAH). These are potential "sell-on-rally" zones unless there is a massive spike in buying volume.
Key Support: The previous swing low around $87,000$. If this level breaks, the downward momentum will likely accelerate.
Note: The price is currently in a "Price Discovery" phase below the Value Area. In professional trading, this is a risky zone for "bottom fishing." It is often safer to wait for a trendline break or a clear reversal pattern (like a Bullish Engulfing candle) on a lower timeframe.

EURUSD Is Quiet — But This Structure Signals the Next MoveEURUSD – H1 | Technical + Macro Analysis
Technical Structure
Price has broken the descending trendline and is now stabilizing above the key support zone.
The market is forming higher lows, signaling selling pressure is weakening.
Price is holding near the EMA cluster, suggesting a transition from correction to accumulation.
Upside targets sit at the previous supply zone, where a range breakout could accelerate.
Macro Context (EUR vs USD)
USD momentum is fading as markets price in slower US growth and future rate cuts.
ECB policy remains restrictive relative to growth risks, helping stabilize EUR.
Risk sentiment has improved slightly, reducing defensive USD demand.
Outlook
Primary scenario: Consolidation above support → gradual push toward resistance.
Invalidation: Clean break below the support zone would reopen downside risk.
Bottom Line
EURUSD is no longer trending down it’s building a base.
If macro pressure on USD continues, this structure favors a controlled upside rotation, not a breakdown.

this ETH Structure Usually Breaks Higher — Most Traders Miss ItETH/USD – H1 |
Technical Structure
ETH is holding firmly above the key support zone and both EMA 34 & EMA 89, confirming trend control by buyers.
Recent pullbacks are shallow and corrective, forming higher lows → classic bullish continuation behavior.
Price is compressing below the next resistance around 3,100, indicating energy build-up rather than distribution.
As long as support holds, the structure favors step-by-step expansion, not reversal.
EMA 34 & EMA 89 remain below price, acting as dynamic support.
Macro Context
Risk appetite remains supported as markets price in softer USD conditions and future Fed easing.
ETH benefits from capital rotation into majors, especially when BTC stabilizes.
No major macro headwinds at the moment → momentum stays with trend-following buyers.
Outlook
Primary scenario: Hold above support → consolidation → push toward 3,100+.
Invalidation: Only a clean breakdown below the support zone would delay the bullish continuation.
Bottom Line
ETH is not overextended it’s absorbing liquidity above support.
This structure typically resolves higher, not sideways or lower.

Bitcoin Isn’t Weak — It’s Building the Break That Traps BTC / USD – H4 ANALYSIS
Market Structure
BTC is still locked inside a broad high-liquidity range, not in a downtrend.
Multiple failed breakdowns from the support zone confirm buyers are defending aggressively.
Price is compressing back toward the range mid–upper area → classic re-accumulation behavior.
EMA Behavior
EMA 34 & EMA 89 are flattening, not sharply sloping down.
This indicates balance → absorption, not trend reversal.
Strong moves usually start after EMAs go flat, not when they’re trending.
Liquidity Context
Current price action is designed to shake both early longs and late shorts.
Liquidity is concentrated:
Above range highs (buy stops)
Below range lows (sell stops)
Market is preparing for expansion, not distribution.
Macro Alignment
No macro shock forcing risk-off right now.
BTC is behaving independently → capital rotation + positioning phase.
This favors range → expansion, not collapse.
Expectation
Short-term: continued choppy movement inside the box.
Medium-term: range high sweep → breakout attempt toward the upper resistance zone.
Only a clean, high-volume breakdown below support would invalidate this structure.

Bitcoin Isn’t BreakingBTCUSD (H1) — Focused Analysis
Market Structure
BTC remains in a clear range-bound market.
Price is rotating between strong support and resistance, not forming a trend.
The prior downtrend has transitioned into accumulation / balance.
Key Zones
Resistance Zone: ~90,500
Support Zone: ~85,200
Current Price: Mid–upper range → liquidity-driven moves dominate.
Liquidity Context
The highlighted area is a high-liquidity price range.
Price is designed to sweep both sides:
Push up to resistance → trap longs
Flush to support → trap shorts
This environment favors range trading, not breakout chasing.
Scenarios
Primary Scenario (High Probability):
Continued sideways oscillation inside the range.
Expect fake breakouts and sharp reversals.
Breakout Scenario (Lower Probability):
Only valid with a strong close above 90,500 + volume expansion.
Until then, upside spikes are likely liquidity grabs.
Summary
Bitcoin is not trending it’s absorbing orders.
Patience is the edge. Wait for confirmation, or trade the range with discipline.

Gold Is Not Topping — It’s Loading for $4,500XAUUSD – H1 Analysis
Market Structure:
Gold is maintaining a strong bullish structure, consolidating tightly below the previous high. This is a classic continuation setup, not a distribution phase.
Key Zones:
- Resistance Zone: The former high area has now been tested and absorbed. Price acceptance above this zone signals strength.
- Support Zone: Buyers continue to defend the higher support band, confirming higher lows and trend control.
Price Action Insight:
Sideways movement under resistance = bullish consolidation.
No aggressive sell-off after breakout → sellers are weak.
Volume remains stable, suggesting institutional accumulation rather than exhaustion.
Primary Scenario:
A brief pullback to retest the breakout zone, followed by continuation toward new highs, with $4,500 as the next psychological magnet.
Risk Scenario:
Only a strong breakdown back below the consolidation range would invalidate the bullish bias.
Conclusion:
Gold is building energy above key levels. As long as price holds above support, dips are opportunities the trend favors continuation, not reversal.

Wave 3 Is Complete — Gold Is Resetting for the Final ExpansionXAUUSD (H1) — MARKET ANALYSIS
1. Market Structure
- Gold has respected the major demand / support zone around 4,350 – 4,360, where strong buying pressure entered and pushed price aggressively higher. From this base, the market completed a clean impulsive Wave (1) → (3) sequence.
- The sharp rally into the 4,410 – 4,420 area confirms that buyers are fully in control of the trend.
2. Elliott Wave Context
Wave (1): Breakout from the support zone with increasing momentum.
Wave (2): Shallow pullback, holding above the demand area → bullish sign.
Wave (3): Strong expansion leg, accelerating vertically (the strongest wave).
Current Phase: Price is now expected to enter Wave (4) — a healthy technical correction.
Next Move: After Wave (4) completes, Wave (5) is projected to extend toward new highs.
This wave behavior confirms a trend continuation structure, not a reversal.
3. Key Levels to Watch
- Support Zone: 4,350 – 4,360
Must hold to keep the bullish structure intact.
- Wave (4) Correction Zone: Around 4,380 – 4,395
Ideal area for price to stabilize and build energy.
- Wave (5) Target: 4,450+
Final expansion of the current impulsive cycle.
4. Price Action & Momentum
No distribution behavior at the top pullback is controlled.
Momentum remains strong despite short-term profit-taking.
Structure shows higher highs and higher lows, confirming trend strength.
5. Scenario Outlook
🔼 Primary Scenario (High Probability):
Price corrects modestly into Wave (4)
Holds above the 4,350 support zone
Expands into Wave (5) toward higher targets
🔽 Invalidation:
Strong breakdown below 4,350
→ would signal a deeper correction and delay the bullish continuation.
Conclusion
Gold is not topping it is resetting. The current pullback is a technical pause within a strong impulsive uptrend. As long as the support zone holds, the market is structurally aligned for one more upside expansion toward new highs.
This is a classic buy the dip in an impulsive trend, not a sell-the-rally environment.

EURUSD Is Not Rebounding — It’s Preparing for the Next Leg DownEURUSD – 1H SHORT ANALYSIS
Market Structure
Price is holding below a clear resistance zone, with repeated failures to reclaim higher levels.
Current movement shows weak reaction from support, indicating demand is not aggressive.
Structure remains lower highs → range-to-bearish continuation, not a reversal.
Technical Bias
Consolidation above support looks more like distribution, not accumulation.
Any short-term bounce is likely a liquidity pullback before continuation.
As long as price stays below resistance, sell pressure dominates.
Scenarios
Primary: Minor bounce → rejection → continuation toward Target 1, then Target 2.
Invalidation: Strong acceptance back above resistance zone.
Bottom Line
This is sell-the-rally structure, not a buy-the-dip market.
Patience favors shorts direction is decided below resistance, not at support.

Gold Is Executing the Next Wyckoff LegGOLD (XAUUSD) – 30M STRUCTURE UPDATE
Price is confirming Wyckoff Phase C → D, with a clean breakout from Phase B.
Structure shows impulsive markup followed by controlled pullbacks — classic continuation behavior.
Price holds above EMA 34 & EMA 89, confirming trend strength and acceptance at higher levels.
The move labeled (1) → (2) → (3) reflects a healthy bullish sequence, not exhaustion.
Near-Term Path
Base case: Short consolidation / shallow pullback → continuation toward (5).
Invalidation: Only if price loses the EMA cluster and falls back into the prior range.
Bottom line:
Gold is not topping it is advancing in phases.
Patience favors continuation, not counter-trend trades.

Smart Money Is Executing the Next PhaseGOLD MARKET ANALYSIS (XAUUSD) — DAILY UPDATE
📌 Market Context
Gold continues to follow a Wyckoff schematic, transitioning from Phase B into Phase C/D.
The breakout from the prolonged range confirms active participation from large players, not retail-driven noise.
🔎 Structure & Technicals
Price holds above key moving averages, keeping the primary uptrend intact.
Current advance represents a markup leg, followed by a healthy technical pullback.
Momentum indicators remain elevated → volatility is expected, but no reversal signals are present.
📈 Today’s Scenarios
Primary Scenario:
Mild correction → re-accumulation above new support → continuation toward higher targets.
Alternative Scenario:
Deeper pullback = liquidity test (Spring / Shakeout) before the next leg higher.
Daily Bias:
BUY with structure. Avoid FOMO.
🎯 Strategic Insight
This move is driven by smart money positioning, not emotional buying.
Patience and phase recognition remain the edge.
TODAY’S LIMITED STRATEGY — DEC 22
Intraday Focus: Re-Accumulation
📌 Setup 1 — Timing Sell Zone
Sell Zone: 4418 – 4421
TP: 4415 – 4410
SL: 4425
📌 Setup 2 — Timing Buy Zone
Buy Zone: 4332 – 4335
TP: 4338 – 4343
SL: 4328
⚠️ Strict risk management required. Protect capital first.
Bottom Line:
The trend is bullish.
The edge is patience not speed.

Gold Maintains Its UptrendHello everyone, what’s your view on today’s global gold price?
Gold is rebounding above 4,350 USD early in the session, supported by escalating geopolitical tensions. The Israel–Iran conflict, along with developments involving the U.S. and Venezuela, is driving investors toward gold as a safe-haven asset.
At this stage, the bullish trend remains intact. The 4,400 USD level has been reached for the first time and successfully closed in the short term. As no new peak has yet been firmly established, the upside bias continues to dominate.
Do you agree with this outlook?

EUR/USD Rejects Resistance: Bears Setting Up the Next Move📊 EUR/USD Chart Analysis
1. Strong Resistance Hit at ~1.1700
The price made a sharp impulsive rally into the 1.1700 zone, which is marked as a major horizontal resistance.
Wicks at the top suggest rejection pressure, meaning buyers struggled to break higher.
---
2. Possible Pullback Structure Forming
The black “M-shape” sketch on your chart suggests the idea of a short-term distribution pattern forming after the rally:
First drop after hitting resistance
Small corrective bounce
Potential continuation downward
This usually signals exhaustion after a strong move.
---
3. First Support Level: 1.1684 – 1.1670
You marked a key support shelf:
This is the first liquidity pool below current price
Price may retest this area after the rejection at resistance
A break below it could trigger momentum toward deeper support
---
4. Deep Support Zone: ~1.1664
Highlighted in red on your chart:
This aligns with the top of the Ichimoku cloud
Also sits near previous consolidation and structure
If price reaches this level, it may act as a strong reaction zone
---
5. Broken Downtrend Line Re-Test
Earlier in the chart, price broke above the diagonal downtrend line.
It's common after such a breakout for the pair to:
Pull back into the broken trendline
Retest it as support
Then resume upward movement
Your current price action looks like it is setting up for such a retest.
---
6. Ichimoku Cloud Context
Price is well above the cloud, showing:
Current momentum is still bullish
Pullbacks are expected but do not invalidate overall strength
Cloud’s angle is turning upward, reinforcing bullish shift.
---
7. “No Sell” Icon Meaning
The chart includes a crossed-out SELL symbol, implying:
Selling immediately after a breakout is risky
Market may still show bullish continuation despite pullbacks
Bears only gain control if support breaks decisively
---
📌 Summary
Based on the chart:
Strong resistance at 1.1700 rejected price
Short-term pullback is likely toward 1.1684 → 1.1670
Major support at 1.1664 may be the deeper target
Trend remains bullish, but retracements are natural
Key decision zone is the support shelf beneath current price

Gold Holding Key Structure – Bulls Preparing Next LegXAUUSD (Gold) – 30M Technical Analysis
Market Structure
Gold is moving inside a well-defined range, showing accumulation after a strong impulse.
Previous manipulation spike (liquidity grab) above resistance failed, but price did not break structure, indicating strength, not weakness.
The market is compressing → volatility expansion is near.
Key Levels
Resistance: 4,350 – 4,360
Range High (Breakout level): 4,365+
Support: 4,315 – 4,300
Invalidation: Below 4,290
Price Behavior
Multiple rejections show buyers defending the range low.
Equal highs were taken → liquidity cleared, preparing price for continuation.
Current candles show higher lows, signaling bullish pressure building.
Bias & Scenarios 🔹 Bullish Scenario (High Probability)
Clean break and close above 4,365
Target zones:
🎯 4,380
🎯 4,400+
Momentum likely fast after breakout.
🔻 Bearish Scenario (Alternative)
Failure to hold 4,315
Drop toward 4,290 – 4,270 for deeper liquidity.

Ripple: Downtrend ContinuesRipple’s XRP has continued its downward trajectory, further developing the blue bearish structure we primarily anticipate. This move is expected to ultimately bring XRP into the green Target Zone between $1.03 and $0.38, where the larger turquoise wave B is projected to complete. We still assign a 30% probability to the alternative scenario in which turquoise wave alt.B has already finished. This alternative could be confirmed if XRP breaks above the resistance levels at $3.19 and $4.09.

EURJPY M30 – Strong Bullish Impulse Into Reversal Zone📊 EURJPY – M30 Strong Impulse Move into Premium Reversal Zone
🔍 Technical Analysis
EURJPY on the 30-minute timeframe is showing a powerful bullish impulse, driven by strong momentum and aggressive buying pressure. Price has expanded sharply from the lower consolidation area, leaving behind minimal retracement, which often signals institutional participation and urgency in order flow.
📈 Impulsive Move & Momentum Analysis
The chart shows a clean bullish expansion, characterized by large-bodied candles and shallow pullbacks.
This type of movement typically represents a liquidity-driven breakout, where sellers are forced to exit and buyers chase higher prices.
Momentum remains bullish, but price is now entering a premium zone, where risk-to-reward for new longs becomes unfavorable.
🟥 Premium Reversal Zone (Upper Area)
The marked Reversal Zone represents a key supply and reaction area.
This zone aligns with:
Prior high-liquidity levels
Potential institutional sell interest
Overextended price conditions after an impulsive leg
The highlighted circle emphasizes the decision point, where market intent will become clear.
⚠️ “Pattern Must” – Confirmation Is Key
This is not a blind sell zone.
A clear bearish pattern must form, such as:
Strong rejection wicks
Bearish engulfing candles
Lower high / micro structure shift
Without confirmation, price may continue consolidating or push slightly higher to sweep liquidity before reacting.
🔄 Possible Market Scenarios
Scenario 1 – Bearish Reaction (Pullback / Correction):
If sellers defend the reversal zone, a corrective move lower is likely.
This would be a healthy retracement within a larger bullish context.
Scenario 2 – Continuation Higher:
A strong close above the reversal zone with volume would indicate acceptance at higher prices.
In this case, the bearish idea is invalidated, and price may target higher liquidity levels.
🧠 Trading Insight
Strong trends often end or pause at premium zones, not in the middle of expansion.
Let the market show rejection before committing to a trade.
Structure + reaction + volume = probability.
📌 Key Levels to Watch
Resistance: Premium Reversal Zone
Support: Internal pullback levels from the impulsive move
Bias : Bullish momentum, cautious bearish reaction only with confirmation
💬 Trade confirmation, not emotion. Patience protects capital.

EURGBP – Bearish Momentum Approaching Reversal Zone📊 EURGBP – H1 Market Structure, Supply Breakdown & Volume-Based Reversal Setup
🔍 Technical Analysis
EURGBP on the 1-hour timeframe is currently trading in a clear bearish environment. The pair has transitioned from consolidation into a strong impulsive sell-off, signaling increasing dominance from sellers. The chart highlights a key breakdown from supply, followed by aggressive momentum toward a high-interest demand area.
📉 Market Structure & Momentum
Price respected a descending structure, forming lower highs and lower lows.
A previous internal consolidation range failed to hold, confirming bearish continuation.
The sharp bearish candles reflect strong order flow imbalance, suggesting institutional participation rather than retail-driven movement.
🟥 Broken Supply (BR Supply)
The marked BR Supply level acted as a strong resistance in the past.
Once price broke below this level, it confirmed a market structure break (MSB).
After the breakdown, price used this area as a distribution zone, accelerating further downside.
This validates the level as a key decision point in the trend.
🟩 Demand Zone with Volume Burst (Lower Area)
The lower green zone represents a high-probability demand and volume burst area.
Historically, this zone shows strong buying reactions, indicating accumulation.
The presence of a Volume Burst suggests liquidity absorption and potential exhaustion of sellers.
This is a zone where reversal or corrective pullback becomes technically valid.
🔄 Reversal Zone & Pattern Expectation
The highlighted Reversal Zone is not a blind entry area.
A clear bullish pattern must form (e.g., strong rejection wicks, bullish engulfing, or shift in structure).
Without confirmation, price may continue lower due to prevailing bearish pressure.
The annotation “Pattern Must” emphasizes confirmation over anticipation.
🧠 Trading Scenarios
Scenario 1 – Bullish Reaction (Corrective Move):
If buyers step in with volume confirmation, price may react upward toward broken structure.
This move would likely be a pullback within a broader bearish trend, not an immediate trend reversal.
Scenario 2 – Bearish Continuation:
Failure to hold the demand zone could lead to continued downside, targeting deeper liquidity pools.
Strong bearish closes below the zone invalidate reversal expectations.
📌 Key Levels to Watch
Resistance: Broken Supply / Prior Structure
Support: Volume Burst Demand & Reversal Zone
Bias: Bearish overall, cautious bullish reaction only with confirmation
💡 Trading Insight
Trend is bearish; counter-trend trades require patience and confirmation.
Volume behavior at key zones gives better insight than indicators alone.
Trade reaction, not prediction.

EURUSD H1 – Institutional Volume Zones & Reversal Setup📊 EURUSD – H1 Market Structure & Volume-Based Reversal Analysis
🔍 Technical Analysis
EURUSD on the 1-hour timeframe shows a corrective phase after a prior bearish move. Price previously experienced aggressive selling pressure, followed by consolidation and a gradual recovery. The chart highlights key volume reaction zones that are now playing a decisive role in short-term direction.
📉 Previous Price Action
The left side of the chart shows strong bearish momentum, characterized by long red candles and impulsive downside moves.
This selling phase ended with capitulation-style candles, indicating exhaustion of sellers.
After the sell-off, price transitioned into a range-bound structure, forming higher lows and absorbing liquidity.
🟩 Demand Zone & Volume Burst (Lower Area)
The lower green zone represents a high-volume demand area.
Multiple rejections from this zone confirm institutional buying interest.
Volume bursts at this level indicate absorption of sell orders, often seen before a directional move.
This zone acted as a base for the current bullish push, validating it as a strong short-term support.
📈 Bullish Reaction & Structural Shift
Price broke above internal consolidation highs, signaling a short-term bullish structure shift.
Higher highs and higher lows suggest buyers are currently in control.
The bullish candles show improving momentum, but price is now approaching a critical area.
🟥 Supply / Reversal Zone (Upper Area)
The upper marked zone is a potential reversal and supply area, aligned with:
Previous price imbalance
Prior rejection zone
Expected volume expansion (Volume Burst)
This area is likely to attract profit-taking and fresh sell orders.
The highlighted circle marks a reaction point, where price may show:
Rejection wicks
Slowing momentum
Bearish candle formations
🔄 Expected Scenarios
Scenario 1 – Bearish Rejection (High Probability):
If price shows rejection within the upper zone, a pullback toward the demand zone is likely.
This would be a healthy retracement within the current structure.
Scenario 2 – Bullish Continuation:
A strong break and close above the reversal zone with volume would invalidate the short-term sell bias.
This could open the door for trend continuation toward higher liquidity levels.
🧠 Trading Insight
Avoid chasing price inside premium areas.
Best opportunities come from reaction, not prediction.
Watch for volume behavior and candle confirmation at the highlighted zones.
📌 Key Levels to Watch
Support: Lower Volume Burst / Demand Zone
Resistance: Upper Reversal & Volume Expansion Zone
Bias: Neutral to bearish at resistance, bullish only on clean breakout
💬 Always wait for confirmation. Volume + structure gives clarity, not indicators alone.

BTCUSDT Break of Structure & Clean Retest – Bullish Continuation📊 Bitcoin (BTCUSDT) – 1H Timeframe | Detailed Price Action & Market Structure Analysis
This chart represents Bitcoin / TetherUS Perpetual (BTCUSDT) on the 1-hour timeframe, focusing on market structure shift, breakout confirmation, and retest logic, which are key concepts in professional price action and smart money trading.
🔹 Overall Market Structure
Bitcoin was previously moving in a choppy and corrective structure, showing mixed momentum with sharp bullish and bearish swings. This type of behavior often indicates liquidity grabs and accumulation, especially near key support levels.
As price stabilized, BTC formed a higher low, signaling a potential trend shift from bearish to bullish.
🔹 Major Breakout Level
The chart clearly marks a “Major Break” level, which acted as a strong resistance zone in the past. Price finally broke above this level with strong bullish candles, indicating:
A break of structure (BOS)
Increased buyer dominance
Acceptance above a key resistance
This breakout is critical because it confirms bullish intent in the market.
🔹 Retest Zone (Support Flip)
After the breakout, price pulled back into the highlighted blue zone, labeled as “Retesting”. This area now acts as:
Previous resistance turned support
A high-probability buy-on-dip zone
A zone where institutions may re-enter long positions
Price respecting this zone strengthens the idea that the breakout is valid, not a fake move.
🔹 Price Action Behavior
Within the retest zone, price shows:
Strong bullish rejections
Small-bodied candles followed by expansion
Gradual upward pressure
This suggests buyers are absorbing sell orders, preparing for the next impulsive move.
🔹 Bullish Projection & Targets
The projected path on the chart shows:
Continuation after a successful retest
Higher highs forming above the recent structure
Momentum aiming toward 90,800 – 91,600 and potentially higher if volume supports
As long as price holds above the retest zone, the bullish bias remains intact.
🔹 Trading Psychology & Strategy Insight
This setup aligns with a classic Break → Retest → Continuation model:
Avoid chasing the breakout
Wait for price to return to value
Enter trades with better risk-to-reward
Discipline and patience are key here.
🧠 Fin al Thoughts
Market bias: Bullish
Key confirmation: Hold above retest zone
Invalidation: Strong close below the support zone
Best approach: Confirmation-based buys
This chart reflects clean technical structure, making it suitable for both intraday and short-term swing traders.
