NZDUSD > The Prefect Place to Look for A Buy EntryAnalysis of #NZDUSD
Another Idea I am watching this week, is the NZDUSD, as you can see the market broke its structure support level and the worst performing pair on Friday, I expect the market to keep falling to test the lows where I think we will have a bullish reaction.
The last time the market was near this structure support level it did rally more than 400 pips, and the market as you know tends to remember, so keep an eye on this idea, it might come soon.
Please support me by boosting this idea so it can get to more and more traders
________________________________________
💭 | Comment your thoughts below, I always answer.
📥 | Feel free to message me if you have any questions.
Thanks for your continued support!
Chartpaterns

Bitcoin Falling wedge ShortDiary OBV divergence with LTA and forming a Rising Wedge. I think it's gonna form a double bottom touching in the weekly LTB of the Huge falling wedge about 17k.

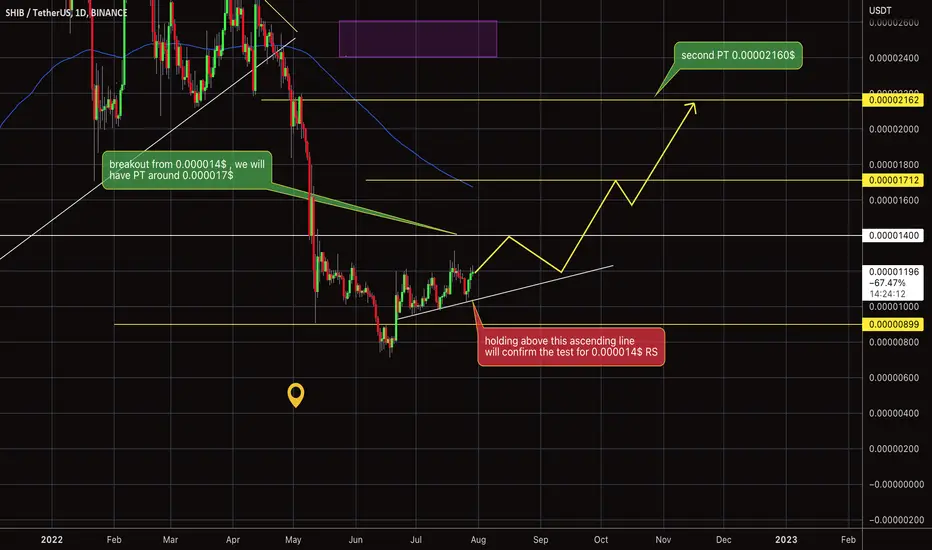
SHIBAINU breakout levelwe will have our breakout above the 0.000014 resistant , after we continue holding above our current ascending liner support , and after the breakout from our resistant , we will have 2 profit taking , first around the 0.000017$ , and second around the 0.00002160$ levels .
BINANCE:SHIBUSDT
USD/CHF short on daily chartSL = 0.98823
ENTRY = 0.96573
TP1 = 0.94323
Two positions with the same stop loss and x1 target for the first position
The stop loss of the second position to breakeven when the first position hits the target1.
The second position has no target, only exit
Risk= 2% of account capital (1% each position

VRM Breakout $ we need to hold the gap price above the 2.50$, in order to have 2 profit taking , the first around the 2.90$+, and the second around the 3.30$+.

EURNZD > A Very Interesting Chart, Waitng for A Sell..Analysis of #EURNZD
The EURNZD is in between support and resistance, which makes a very interesting chart, now I am waiting for a sell if we to the resistance zone, where I will definitely look for a valid ell if the rules for entry are met
_ _______________________________________
💭 | Comment your thoughts below, I always answer.
📥 | Feel free to message me if you have any questions.
Thanks for your continued support!

AUDUSD > Waiting for Confirmation to Buy!Analysis of #AUDUSD
The AUDUSD has a confirmed head and shoulders pattern, not its testing neckline, which is now a support zone, also we have a trend line support.
watch NASDAQ today if it does not find support then forget about his idea, also watch AUDUSD to find support here and provide a valid reversal pattern on the lower time frame
_ _______________________________________
💭 | Comment your thoughts below, I always answer.
📥 | Feel free to message me if you have any questions.
Thanks for your continued support!

EURAUD > The Perfect Place for A Buy Entry!Analysis of #EURAUD
Strong demand zone, near strong key level 1.4350, waiting for the market to push down further to look for a reversal pattern before getting in a buy trade if the rules are met.
_ _______________________________________
💭 | Comment your thoughts below, I always answer.
📥 | Feel free to message me if you have any questions.
Thanks for your continued support!

USDCAD > Simple Classic Trendline EntryAnalysis of #USDCAD
The USDCAD might test its trendline support where I will look for abuy entry if the rules for entry are met.
Simple classic trendline entry nothing complicated just watch for a confirmation
_ _______________________________________
💭 | Comment your thoughts below, I always answer.
📥 | Feel free to message me if you have any questions.
Thanks for your continued support!

GBPCHF > Watch for Breakout First, Then Entre.Analysis of #GBPCHF
the GBPCHF consolidating inside this triangle pattern and we can expect the market to break out soon, usually, this pattern breaks to the downside but let's have a plan for either way.
_ _______________________________________
💭 | Comment your thoughts below, I always answer.
📥 | Feel free to message me if you have any questions.
Thanks for your continued support!

EURJPY > A Fantastic Strong Demand Zone for A Buy.Analysis of #EURJPY
EURJPY soon might test its strong daily demand zone, where I think the market will show some bullish reaction.
if the market tests my structure support zone, I will then look for a buy entry near 134.00 if the rules for entry are met.
________________________________________
💭 | Comment your thoughts below, I always answer.
📥 | Feel free to message me if you have any questions.
Thanks for your continued support!

EURUSD > The Perfect Level for A Sell Entry!Analysis of #EURUSD
Following up on my last idea on EURUSD, I still want to sell near trendline resistance, 1.03500-1.04000, and the structure resistance zone where the market broke to the downside.
as you can see the traders in this market have no appetite to buy EURUSD and finding a good valid sell setup is the right choice for me
________________________________________
💭 | Comment your thoughts below, I always answer.
📥 | Feel free to message me if you have any questions.
Thanks for your continued support!

US100 > The Best Places for A Buy Entry!Analysis of #US100
The NASDAQ tested trend line resistance and now waiting for the FED meeting to decide what is the next move will be, not expecting a major move before the meeting.
Currently, the market expects a 0.75% raise, but the press conference is very important.
I am watching the market to see if we can test the first support level, near 12200 to start looking for a buy, if that 12200 level did not hold, 11700 will be the next support level to look for a buy, also the trendline support level.
_ _______________________________________
💭 | Comment your thoughts below, I always answer.
📥 | Feel free to message me if you have any questions.
Thanks for your continued support!

GBPUSD > The Best Levels for A Buy or A Sell..Analysis of #GBPUSD
Last week I posted an idea on GBPUSD, it was head and shoulders, and indeed it went as I expected and broke out to the upside by more than 200 pips.
now as you can see on my chart, i see we are reaching to structure resistance zone also trendline resistance, where I will look for a selling opportunity.
________________________________________
💭 | Comment your thoughts below, I always answer.
📥 | Feel free to message me if you have any questions.
Thanks for your continued support!


Bull Flag trading Long GoldAll information is on the Chart.
Gold chart is found on a descending channel and a Bull Flag has formed. Bull Flags are measured moves.
Entry: 1717
Stop: 1700 (Below the Flag)
Take Profit: 1800
Successful Investing is the ability to manage risk and foresee possible opportunities in the near or further future, prepare ourselves and take the risk when the opportunity presents itself.
Invest safe and Happy trading.
As always, appreciate the like, comments and share.


EURJPY > Beautiful Bullish Harmonic Bat Pattern!Analysis of #EURJPY
EURJPY is forming a beautiful bullish harmonic Bat pattern, might complete near strong demand zone, also strong key support level 137.00.
it will be a good idea to start looking for a buy entry near the completion of this beautiful bullish harmonic bat pattern
_ _______________________________________
💭 | Comment your thoughts below, I always answer.
📥 | Feel free to message me if you have any questions.
Thanks for your continued support!

GOLD > On-Demand Analysis for A Small Buy.Analysis of #GOLD
I got many requests from members and followers to do analysis for gold, you can message me here your request too.
the XAUUSD tested its weekly support zone and showed a bullish reaction as expected, still, the move is not convincing a lot of buyers to get in and buy gold, and I am favoring selling strength in this market as I have a fundamental belief that gold should be lower than thee levels.
however, if the market retests the lows near 1680 we can look for a small buy entry at the lower time frame to retest 1700-1720, and not more than that
_ _______________________________________
💭 | Comment your thoughts below, I always answer.
📥 | Feel free to message me if you have any questions.
Thanks for your continued support!

EURAUD > Detailed Trading Plan For Buy and Sell.Analysis of #EURAUD
Simple broken trendline setup, for sell entry, if market retraced back to test trendline also resistance level, we can look for a sell if the rules are met.
if the market continues down from here, we can expect a retest of the lows, which is also a good spot to look for a buy entry if the rules are met.
_ _______________________________________
💭 | Comment your thoughts below, I always answer.
📥 | Feel free to message me if you have any questions.
Thanks for your continued support!

Balkrishna Industries forming Triangle pattern in daily TFBalkrishna industries has formed triangle pattern in a daily time frame if strongly broke expect higher higher targets

A cup pattern in the ADA chart
How interesting
In most charts we see a pattern.
We take a short position by observing the loss limit according to the rule of classical patterns.
And we sit and drink a tea or coffee while waiting to reach the target.
.......................................................................................................................
What do you think??
Short or Long ??
flw me
