Can BTC hit $100k or will Sellers break $60 support? While the current Market is holding to the $66k, can the BTC Bulls get reinforcement to kick the $100k to $104 resistance area before further downside?
The current support area is one to watch out for, the bulls have strong chances of gathering Longs here as there is most likely going to be a sideways for a while followed by a bounce. This bounce will likely attack the $84k resistance and if the bulls persist we hit the $94k but this is expected to be an area of more resistance as they climb up, the resistance will persist and it's likely if they break the $98k resistance it gets tougher as they hit the 100k area.
What if they failed at holding the $66k to $68k current support then expect the dump to continue to the $58k to $54k support area.
I am still waiting to buy $44k BTC if they gods permit.
Chart Patterns

$TRIA (1H) price analysis.BYBIT:TRIAUSDT is currently trading in a key decision zone, with price approaching major demand areas that will determine the next directional move. Based on current market structure and liquidity positioning, two clear scenarios are in play.
Scenario 1 – Bullish Continuation:
If price makes a healthy retracement into the Buying Breaker Block at $0.02052–$0.01853 and shows bullish confirmation, buyers are likely to step in. Holding this zone keeps the structure bullish and opens the path for upside continuation toward higher resistance levels, with momentum targeting the $0.025–$0.028 range.
Scenario 2 – Deeper Pullback / Trend Risk:
If price fails to hold the breaker block and takes a sharp retrace into the Last Buying Zone at $0.01449–$0.01347, this area becomes the final support for bulls. A strong reaction here can still lead to a bullish reversal; however, a clean breakdown and acceptance below the last buying zone would officially confirm a bearish trend, signaling a shift in market control to sellers.
Summary:
Holding above demand zones favors bullish continuation, while a loss of the last buying zone confirms bearish market structure. Traders should wait for confirmation at key levels to manage risk effectively.

Dogecoin (DOGE): Breakout Happened | Another 200% Incoming!Dogecoin has had a really good rally so far, but that's not all; we might see another 200% movement from the current market price!
More in-depth info is in the video—enjoy!
Swallow Academy
DLong

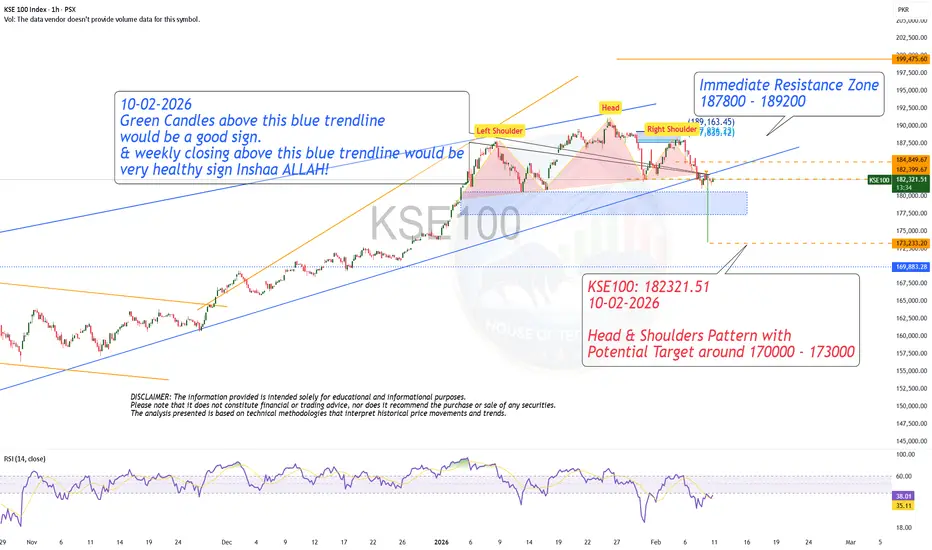
H & S Pattern - Cautious Approach!KSE100: 182321.51
10-02-2026
Head & Shoulders Pattern with
Potential Target around 170000 - 173000
**VVV — Moderate Bull Signals **VVV — Moderate Bull Signals But Extreme Futures Manipulation With Whale Selling & Long Liquidations**
**Overview**
VVV is presenting one of the most dangerous divergences a trader can encounter. The multi-timeframe scoring reads 64.2% bullish with a parabolic 13.8x recovery ratio from a -10.5% retrace — on the surface, this looks strong. But the volume intelligence tells a completely different story: 121.75x futures-to-spot ratio (Manipulation tier), climactic futures volume at 5.55 Z-score, active whale selling, long liquidations firing, and bear-dominant directional flow. This is a textbook ghost market where leveraged speculation is creating a false price reality.
**Price**
Trading at 3.788 spot / 3.778 futures. Premium at -0.26% is near neutral (Z: 0) but the yield reads -289% APY which structurally favors longs through funding. The slight backwardation seems harmless until you look at the volume profile underneath — the premium is being held artificially neutral while futures volume runs at 121x spot. StdDev at 0.276% reads Volatile on both short and long windows, confirming unstable conditions.
**Bias**
Moderate Bull with 28.3% spread. EMA structure is perfect at 8:0 — every timeframe with a reading shows price above EMA50 above EMA200. Ichimoku TK reads 8:5 bull. Candle bias at 8:6 bull. C>T at 8:6 bull. Two Three White Soldiers detected with zero bearish. These are genuinely bullish signals — the problem isn't the signals, it's what's driving them. When futures volume is 121x spot, the price action generating these signals is being manufactured by leveraged speculation, not real accumulation. The 143.7% bounce that created the parabolic recovery ratio was largely a futures-driven move.
**Volume**
This is the critical section. Spot Z at 1.69 (Strong) looks healthy, but futures Z at 5.55 is Climactic — an extreme rarely seen in normal trading. Combined Z at 5.53 confirms the climactic reading. The F/S ratio at 121.75x places this firmly in Manipulation territory — for every $1 of real spot trading, there's $121.75 of futures activity. Spot volume is just 1.6M ($6.03M) while futures volume is 194.3M ($734.08M). Bull:Bear Z is massively skewed at -0.43:8.65 — the bear side of the volume is at an extreme 8.65 Z-score while bull volume is below average. Directional flow confirms Bear Dominant despite the bullish price action. Volume momentum is accelerating at 2.7 with structural momentum expanding at 460.2%, but this expansion is futures-driven, not spot-driven.
**Whale & Liquidation Activity**
Whale SELL is active — large players are distributing into the move. Long liquidations are firing (LONG REKT), meaning leveraged longs are being force-closed. The futures squeeze just fired while spot squeeze shows nothing — this Squeeze Divergence is flagged as "Fut Only (Trap!)" which is the clearest warning signal available. When a squeeze fires only on futures but not on spot, the resulting move is built on leveraged air rather than genuine buying. The ceiling reading at 15.78σ shows volume is at a statistical extreme that is unsustainable.
**S/D**
dd:2 ss:2 — evenly balanced with 2 demand and 2 supply zones. This neutral structure provides no directional edge from a zone perspective and means there's limited structural support if the futures-driven move unwinds.
**Momentum**
Momentum reads Bull ↑ with bandwidth at 123.49% — extremely wide, reflecting the violent nature of the recent moves. Pattern totals are even at 2:2 (Two Soldiers bull vs one Evening Star and one Harami bear). MeanZ at -0.42σ is Normal, suggesting the premium regime hasn't shifted structurally despite the chaos in the volume profile.
**Scenarios**
🔴 Bear (Primary — Manipulation Unwind): The 121.75x F/S ratio, climactic futures Z, whale selling, long liquidations, and futures-only squeeze fire all point to a manufactured move that will unwind. When futures volume at these extremes normalizes, the price action it created evaporates. The 8.65 bear Z-score on the volume side suggests enormous selling pressure is being absorbed temporarily — when it overwhelms, the reversal could be violent. The "Fut Only Trap" squeeze divergence is the system explicitly flagging this as a high-probability trap for longs.
🟢 Bull (Structural — If Spot Confirms): The 8:0 EMA structure, Two Three White Soldiers, and -289% APY yield are real bullish inputs. If spot Z maintains Strong (above 1.5) and the F/S ratio normalizes below 50x without price collapse, it would mean the futures activity was front-running a genuine move rather than manufacturing a fake one. Watch for spot volume to rise proportionally — that would be the single most important confirmation that this isn't purely manipulation.
**Watch**
F/S ratio normalization is the primary tell. If it drops from 121x toward 20-30x while price holds, the move has real support. If price drops as the ratio normalizes, it confirms the manipulation thesis. Whale activity needs to flip from SELL to neutral or accumulation. Long liquidations need to clear. The futures-only squeeze divergence is the highest-priority warning — until spot volume catches up and generates its own squeeze, treat any bullish price action with extreme skepticism. The 15.78σ ceiling means this statistical extreme will resolve, the question is only direction.
**Risk**
This is a high-danger environment regardless of direction. The climactic volume readings at 5.55 Z on futures, 121x F/S ratio, active whale selling, and long rekt liquidations create a setup where the primary risk is to longs despite the bullish signals. The parabolic 13.8x recovery ratio was manufactured by leverage, not earned by spot accumulation. Position sizing should be minimal to zero until the manipulation indicators normalize. If trading this, use spot only — adding leverage into a 121x F/S ratio environment is adding gasoline to a fire. The -289% APY yield means shorts are paying heavily, which can keep the manipulation going longer than expected, but gravity always wins against a 15.78σ ceiling.
👆More analysis on my profile.
---
Tags: `VVV` `VVVUSDT` `crypto` `manipulation` `bearish` `multitimeframe` `technicalanalysis` `volumeanalysis` `premium` `whale` `liquidation` `priceaction` `futures` `trap`

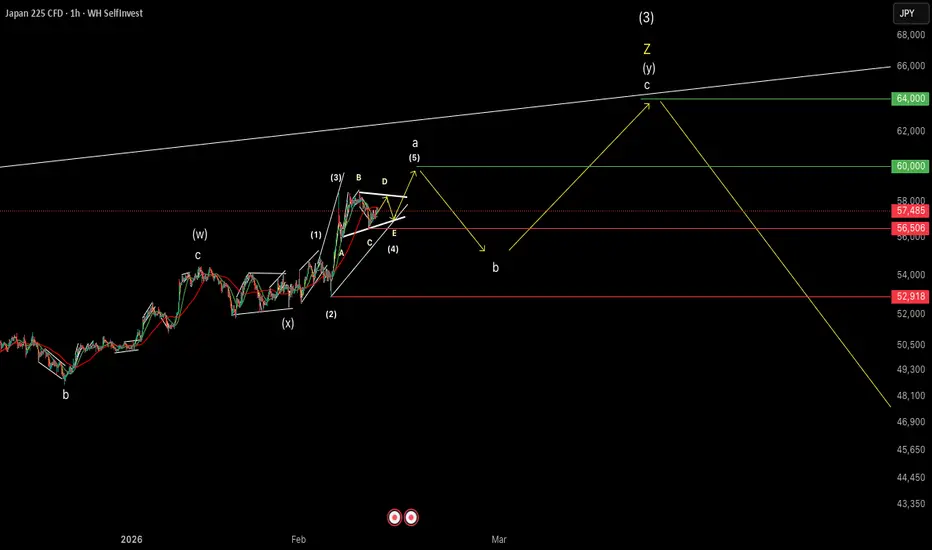
Nikkei 225: Bullish Wave 5 if 56,506 Holds【🇯🇵 Nikkei 225 (JAPAN225CFD) - 1H】
Main Scenario
Holding 56,506 next week is the absolute key condition
→ If it holds, we head into Wave 5 upside
Bias & Position
Bullish ⤴️⤴️⤴️
#Nikkei225 #ElliottWave #TradingView
SKPC turning bullish once it closes above 16 with strong volumeSKPC turning bullish once it closes above 16 with strong volume 📈🔊.
That move would break a major resistance, confirm a change in character, and complete the triangle breakout 📐✔️.
🔎 Key confirmations to watch: 16.8 and 17.65
🎯 Target 1: 19.1
🚀 Target 2: 21
📈 Target 3: 24
👍 If you like my posts, please consider boosting
📲 Follow me on Thndr to check my entries, exits, and portfolio
👤 Username: @nagaway

Floki (FLOKI): Looking For Buy Entry | Aiming For +22%Floki has been in a healthy bullish trend here after buyers overtook the zone of EMAs. With current momentum on markets, we might see a proper breakout from the local resistance area, which is marked as our entry as well.
As soon as we see a breakdown there, we are going to go into a long position, but keep in mind—there is a huge bearish CME gap that we have to pay attention to, as if we see any strong sell-off, then this would be our target for short.
Swallow Academy

SOL/USDT | FVG midpoint! (READ THE CAPTION)In the weekly chart of SOLUSDT we can see that after it swept away the Sellside Liquidity, and it went as low as 67.50, it bounced back up and it is now being traded at $89. As long as it stays above the 87.50 level (FVG Consequent Encroachment/midpoint), I expect Solana to challenge the FVG high at 97.14.
If it goes below the FVG midpoint, I'd like to see it go for the FVG Low and then go for the Sellside Liquidity sweep.
Targets: 92.00, 94.00, 96.00 and 98.00
Targets if it goes below the FVG midpoint: 87.00, 85.00, 83.00 and 81.00

BUYING SOME UNI HERE🔥 Fortune AI Radar — CRYPTOCAP:UNI
Fresh activity detected on CRYPTOCAP:UNI today.
Data suggests increasing market interest & buyers stepping in.
Technicals currently lean bullish, with momentum trending upward.
Whales showing hints of accumulation and hype rising among trader

#ETC/USDT The price is moving within an ascending channel#ETC
The price is moving within a descending channel on the hourly timeframe. It has reached the lower boundary and is heading towards a breakout, with a retest of the upper boundary expected.
The Relative Strength Index (RSI) is showing a downward trend, approaching the lower boundary, and an upward bounce is anticipated.
There is a key support zone in green at 8.41, and the price has bounced from this level several times. Another bounce is expected.
The indicator is showing a trend towards consolidation above the 100-period moving average, which we are approaching, supporting the upward move.
Entry Price: 8.70
First Target: 8.95
Second Target: 9.20
Third Target: 9.50
Stop Loss: Below the green support zone.
Remember this simple thing: Money management.
For any questions, please leave a comment.
Thank you.

Dominane down, Alts upOnce Bitcoin Domniance falls below 57, Alts take off. Not every Alts, some alts will have their seasons and some won't and some will later and some will never. position accordingly. not finandial advice

FOR DA BOIS!!!A guide that is similar to the xrp chart. I believe the lows are in keep liquidations below 8c. Build your longs for the long term and join me for the rise to Valhalla!!! The journey has just started and we have a long path ahead of us. I am happy you are all here and am ready for this ADVENTURE!

EURUSD Analysis: The Bullish ReversalChange of Character (CHoCH) and the establishment of a Higher High (HH), signaling that the previous bearish dominance is fading. However, the projected "Red Path" suggests a tactical liquidity sweep is imminent, where price is expected to dip sharply toward the major support floor at 1.1700 to "hunt" stop losses and collect buy-side liquidity before a sustained reversal. Traders should monitor this deep discount zone for bullish rejection candles, targeting an initial recovery to the 1.1850 pivot and an ultimate long-term expansion toward the 1.2050 supply zone. This "stop run" strategy requires patience, as the high-probability entry lies not at current market prices, but within the demand pocket created by the projected spring move, offering a superior risk-to-reward ratio for a move back to the range highs.

USDCAD | FRGNT DAILY FORECAST | Q1 | W7 | D16 | Y26📅 Q1 | W7 | D16 | Y26
📊 USDCAD | FRGNT DAILY FORECAST |
🔍 Analysis Approach
I’m applying a developed version of Smart Money Concepts, with a structured focus on:
• Identifying Key Points of Interest (POIs) on Higher Time Frames (HTFs) 🕰️
• Using those POIs to define a clear and controlled trading range 📐
• Refining those zones on Lower Time Frames (LTFs) 🔎
• Waiting for a Break of Structure (BoS) as confirmation ✅
This process keeps me precise, disciplined, and aligned with market narrative, rather than reacting emotionally or chasing price.
💡 My Motto
“Capital management, discipline, and consistency in your trading edge.”
A positive risk-to-reward ratio, combined with a high-probability execution model, is the backbone of any sustainable trading plan 📈🔐
⚠️ On Losses
Losses are part of the mathematical reality of trading 🎲
They don’t define you — they are necessary, expected, and managed.
We acknowledge them, learn, and move forward 📊➡️
🙏 I appreciate you taking the time to review my Daily Forecast.
Further context and supporting material can be found in the Links section.
Stay sharp 🧠
Stay consistent 🎯
Protect your capital 🔐
— FRGNT 🚀📈
FX:USDCAD

US30so i trade alot of consolidation/accumulation which or how ever you guys call it, 1st thing is 1st
price on us30 has been moving up but in all reality not really JAN 13,2026 was the high of the market, and JAN 21, 2026 was the low after that price just kept moving sideways, price broke to the upside on FEB 6 2026
1) price/banks showed us there true move,
2) price broke structure to the down side on a 15min time frame also doing accumulation price broke up then dropped then went back up to grab a little more liq before droping
3) the 5HR time frame shows us clear FU signature of the banks same candle broke structure
4) waiting on the Re-Test on the 5 hr time frame without breaking its high
my personal entry would be 50283 and stoploss at 50433
5) the 7hr also confirms a FU set up taking out liq
6) 6Hr also has a FU signature and the 12 hr also
i can make a whole 13+ confirmations starting from daily but thats to much for me to write, and also i get super busy during the day so i dont look at my charts as much as id like too but when some charts catch my attention i mark mark mark

Falling towards key support?USTEC is falling towards the pivot and could bounce to the 1st resistance, which is a multi-swing high resistance.
Pivot: 23,884.65
1st Support: 22,744.65
1st Resistance: 26,218.10
Disclaimer:
The opinions given above constitute general market commentary and do not constitute the opinion or advice of IC Markets or any form of personal or investment advice.
Any opinions, news, research, analyses, prices, other information, or links to third-party sites contained on this website are provided on an "as-is" basis, are intended to be informative only, and are not advice, a recommendation, research, a record of our trading prices, an offer of, or solicitation for, a transaction in any financial instrument and thus should not be treated as such. The information provided does not involve any specific investment objectives, financial situation, or needs of any specific person who may receive it. Please be aware that past performance is not a reliable indicator of future performance and/or results. Past performance or forward-looking scenarios based upon the reasonable beliefs of the third-party provider are not a guarantee of future performance. Actual results may differ materially from those anticipated in forward-looking or past performance statements. IC Markets makes no representation or warranty and assumes no liability as to the accuracy or completeness of the information provided, nor any loss arising from any investment based on a recommendation, forecast, or any information supplied by any third party.

MercadoLibre – Daily StructureMercadoLibre – Daily Structure
Price is interacting with a major confluence zone: rising support (red) and long-term descending resistance (green). The yellow horizontal level (~1945) is the critical pivot.
Technical View
• Holding above the yellow level → structure remains constructive
• A controlled retest of the yellow zone is technically valid
• Stability after retest → increases probability of upward rotation
As long as price maintains acceptance above this support, the chart favors continuation toward the descending trendline resistance.
Invalidation
• Sustained daily closes below the yellow level → weakens bullish scenario
Bias stays cautiously bullish while support holds.
— Avo.Trades

BTC following 4 year halving cycle.Firstly we will dip to 43K which will be the bottom for current bear market. So and next target will be 215k ATH after 2028 halving. what do you think?

Boeing – 4H StructureBoeing – 4H Structure
Price is trading within a compression phase between rising support and descending resistance, signaling an approaching expansion move. The 243 level remains the key decision zone.
Technical View
• Stability above 243 → bullish pressure intact
• Upside path opens toward 246.82, followed by 254.86
• Failure to hold 243 → corrective rotation risk increases
Market reaction at this level will determine directional control. A confirmed breakout with acceptance, not just a spike, is required for continuation.
— Avo.Trades

S&P 500S&P 500 close the weekly candle at 6836.18
demand floor on monthly is 6030.34 zone
what is S&P 500??
The S&P 500 is a market-cap-weighted index tracking the stock performance of about 500 large U.S. companies across 11 sectors, representing roughly 80% of the U.S. equity market. It's a key benchmark for U.S. large-cap stocks and investor performance.
DXY Impact
The DXY (U.S. Dollar Index) measures the dollar against a basket of major currencies; a rising DXY often pressures S&P 500 multinational firms by raising export costs and reducing foreign earnings value in USD terms. Historically inverse (strong dollar hurts stocks), recent periods show positive correlation amid U.S. growth outlooks and carry trades.
US10Y Impact
The US10Y (10-year Treasury yield) rising increases corporate borrowing costs, discounts future earnings more heavily, and shifts capital to bonds, typically weighing on S&P 500 valuations—especially growth stocks. Peaks in yields and DXY can signal rallies if they stabilize, but sustained rises often correlate with equity pullbacks.
Combined Effects
High DXY and US10Y together amplify headwinds for S&P 500 via tighter financial conditions and reduced risk appetite, though divergences (e.g., yields up, dollar down) can occur from policy shifts.
#S&P500 #STOCKS

EUR/USD Has a Bull Trap_Watch 1.1918 ShoulderHello guys,
I see a bull trap in the EUR/USD currency pair and explained my trading plan for the upcoming week in this video. I hope you like it, and do not hesitate to share your thoughts with me. I am waiting for your comments, so let me know what you think about this bull trap.

EURJPY:Head and Shoulders Breakdown, Bearish ContinuationEURJPY has formed a Head and Shoulders reversal pattern on the H4 timeframe, with a confirmed neckline break around the 181.0-181.2 area, signaling a shift in short-term structure toward the downside.
Following the breakdown, price moved below key moving averages, and the current bounce appears to be a technical retest of the neckline region.
This zone also aligns with the 0.705-0.79 Fibonacci retracement area, increasing the probability of continued bearish momentum. The main scenario favors further downside toward 178.4, with extended targets near the 176.7-176.5 support zone, which represents a stronger higher-timeframe level. As long as price remains below 182.1-182.3, sellers maintain control.
The alternative scenario would activate if price reclaims and holds above 182.3, invalidating the pattern and reopening the path toward 183.5-185.0.
This is not investment advice. Trading decisions should be based on confirmed structure and price reaction.
