USDCAD — Clean Breakdown Setup Toward 1.35000USDCAD presents a very interesting opportunity this week. It looks like one of those setups where, after a clear break of support, we can enter on the pullback.
In my view, this is not a situation that requires multiple confirmations — the breakdown itself could be sufficient reason to enter a short position.
The potential target for this move could be around 1.35000.
Personally, I’ll be closely monitoring this pair at the start of the week.
#Pouyanfa🔥
Chart Patterns

Chart Analysis – Bullish Reversal Toward Resistance
The 1-hour chart of Gold vs US Dollar (XAU/USD) shows a strong bullish recovery after a sharp sell-off. Price has reclaimed a key demand zone and is now pushing toward a major resistance level.
🟢 1. Demand Zone Holding (Bullish Structure Intact)
Price sharply dropped into the 4,880–4,920 support area
Strong rejection from the lows (highlighted reaction zone)
Higher low formed after the bounce
Momentum shifted bullish with consecutive higher highs and higher lows
This confirms buyers stepped in aggressively at discount levels.
🔴 2. Stop Loss Zone
The marked 4,930–4,950 region acts as invalidation.
A break below this zone would:
Disrupt bullish structure
Indicate potential continuation downside
Suggest failed breakout attempt
As long as price remains above this level, bullish bias remains valid.
🟩 3. Current Resistance Zone
Price is now testing 5,020–5,060 supply area
This zone previously acted as consolidation and breakdown area
Reclaiming and holding above it turns it into support
A clean breakout and close above 5,060 increases probability of continuation.
🎯 4. Upside Target
If breakout confirms:
Next major resistance: 5,120–5,150
Strong momentum could extend toward the psychological 5,200 region
📊 Technical Structure Summary
Level Type Price Zone Meaning
Major Support 4,880–4,920 Strong demand reaction
Invalidation 4,930–4,950 Stop loss area
Breakout Level 5,020–5,060 Key resistance flip
Target Zone 5,120–5,150+ Upside objective
📌 Bias: Bullish Above 4,950
Holding above support → continuation likely
Break and close above 5,060 → acceleration expected
Failure below 4,930 → bearish pressure returns
If you'd like, I can also provide:
A short trading plan version
Risk-to-reward breakdown
Intraday scalp vs swing perspective
Or convert this into a caption for social media 🚀

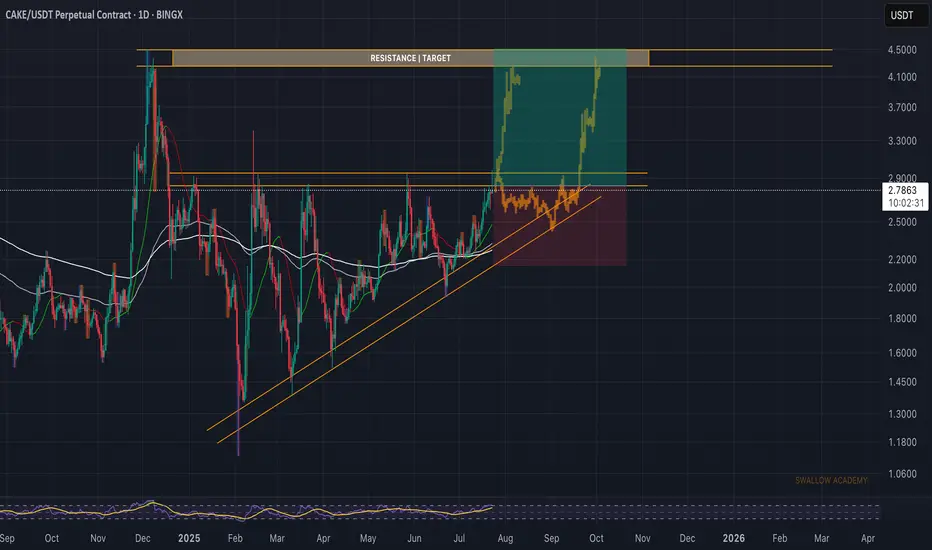
Pancake Swap (CAKE): Looking For Breakout | Bullish TrianglePancake looks good for long here, where we are at the last pressure point in that triangle pattern, which is hinting to an upcoming volatile breakout (or even breakdown, who knows).
Either way, based on the overall market status currently, we are looking more for the bullish breakout here, which would then need to be confirmed with a proper retest on smaller timeframes, which then again would give us a good opportunity for a long position!
Swallow Academy
Polkadot (DOT): Looking For Another 15% Bullish MovementSeeing good potential for another 15% movement where we are about to form a proper BOS on the 30M timeframe, but there is that bearish CME gap that we also keep an eye on!
More in-depth info is in the video—enjoy!
Swallow Academy

WHR ready to runGreat chart for using Momentum Wave oscillator.
WHR is ready to run. It just needs to break that yellow down-slopping trend line. As soon as it does...off to the races.
Here is an interesting summary for each of the "buy" signals and the results. It is on the weekly chart. You can see the green vertical lines. It is when the momentum oscillator goes below -60.
As of now, we have hit the yellow trend line again. But the big support line was hit (white line), so we are probably consolidating to gain strength to break the yellow resistance line. Look for a median move average of 35% from when the signal was given. Could be more depending on the overall S&P market, tariffs, etc. Remember that the average move is 88.5%
Entry: If not already in, look for a small pull back on the 1 hour chart for a good entry.
Metric Result
Total signals: 13
Wins: 12
Losses: 1
Win rate: 92.3%
Average move: 88.5%
Median move: 35%
11/1/74, 100%
2/1/78, 14%
4/2/79, 11%
4/1/80, 235%
12/3/90, 90%
11/1/20, 99%
4/1/09, 212%
1/3/12, 327%
11/1/18, 35%
11/1/22, 18%
1/2/24, -30% (negative)
7/1/24, 14%
1/2/26, 25% (current and end results pending)

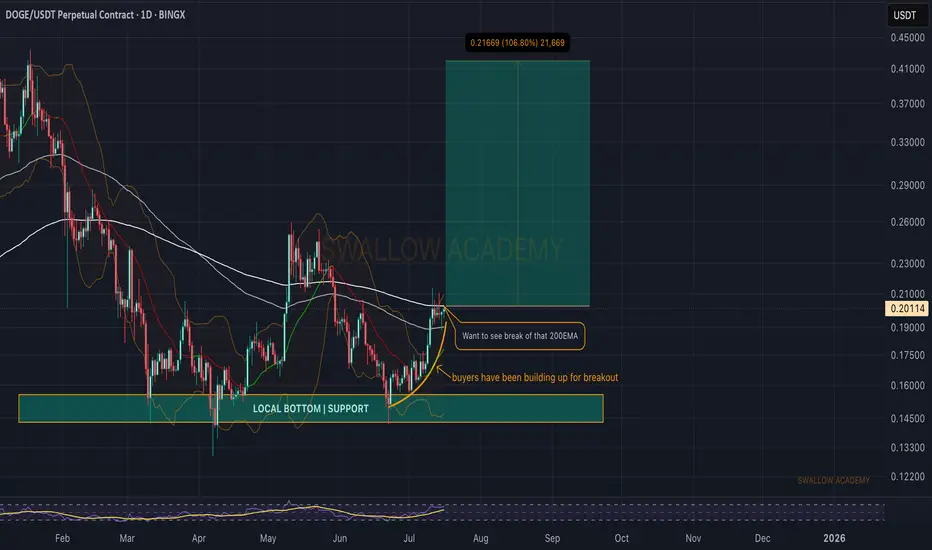
Dogecoin (DOGE): About To Breakout and Start Strong Bullish MoveDogecoin has been on our radars for quite some time, and we had a nice bounce since last time (from the local bottom).
Now we are approaching the breakout point (200 EMA) area, where upon seeing the break we should start a strong upward movement.
Swallow Academy
Shiba Inu (SHIB): Looking For Breakout | Do Not Miss It...Do not miss the breakout that we might see about to happen. We are looking for a breakout on SHIB coin where once we get that breakout from the zone of accumulation (sideways channel), we are going to look for further movement to upper target zones from there!
Swallow Academy

SPY On The Rise! BUY!
My dear subscribers,
SPY looks like it will make a good move, and here are the details:
The market is trading on 681.65 pivot level.
Bias - Bullish
My Stop Loss - 678.64
Technical Indicators: Both Super Trend & Pivot HL indicate a highly probable Bullish continuation.
Target - 687.62
About Used Indicators:
The average true range (ATR) plays an important role in 'Supertrend' as the indicator uses ATR to calculate its value. The ATR indicator signals the degree of price volatility.
Disclosure: I am part of Trade Nation's Influencer program and receive a monthly fee for using their TradingView charts in my analysis.
———————————
WISH YOU ALL LUCK

GBPUSD - SHort - 1.3580GBPUSD is expected to hit the levels of the 1.3580. The Pair is expected to pivot above the levels of 1.3680.
The Pair has had enough retracement and expects the fall on the weekly market open.

AUDCHF Potential Longs I'm expecting some bullishness to kick in from the M30 demand zone, and potentially give us around a 4% reward upon targets. If you'd act ton this analysis, I recommend managing risk and n=most importantly, doing your own research.

#DYDX/USDT Breakout from Falling Wedge |#DYDX
The price is moving within a descending channel on the hourly timeframe. It has reached the lower boundary and is heading towards a breakout, with a retest of the upper boundary expected.
The Relative Strength Index (RSI) is showing a downward trend, approaching the lower boundary, and an upward bounce is anticipated.
There is a key support zone in green at 0.1027, and the price has bounced from this level several times and is expected to bounce again.
The indicator is showing a trend towards consolidation above the 100-period moving average, which we are approaching, supporting the upward move.
Entry Price: 0.0160
First Target: 0.1100
Second Target: 0.1150
Third Target: 0.1198
Stop Loss: Below the green support zone.
Don't forget one simple thing: Money Management.
For any questions, please leave a comment.
Thank you.

US30 BEARS WILL DOMINATE THE MARKET|SHORT
US30 SIGNAL
Trade Direction: short
Entry Level: 49,449.0
Target Level: 48,076.7
Stop Loss: 50,359.3
RISK PROFILE
Risk level: medium
Suggested risk: 1%
Timeframe: 1D
Disclosure: I am part of Trade Nation's Influencer program and receive a monthly fee for using their TradingView charts in my analysis.
✅LIKE AND COMMENT MY IDEAS✅

BTC Liquidity Building Before a Key Breakout
Most indicators are starting to turn positive, especially liquidity behavior, which suggests accumulation around the current zone.
The bounce from this area is technically strong, but the real trigger remains clear:
A sustained move above 75K opens the path toward:
🎯 $80,000
🎯 $85,000
From a time perspective, February 18 is an important cyclical date and could act as a catalyst for a decisive move — either acceleration or rejection.
For now:
Structure is attempting to shift.
Liquidity is improving.
Momentum is stabilizing.
The next few sessions will be critical.
📅 I’ll update the chart and may go live depending on how price reacts around the 75K level.
Let’s see how the market responds.
#Bitcoin #BTC #Crypto #Gann #PriceAction #Liquidity #TradingView

AUDCAD1. Price is reacting to a weekly timeframe down trend line.
2. Price is also reacting to a weekly supply level.
3. In the H4 timeframe, there is bearish engulfing candle already closed signaling price may come down.
4. Early sellers could enter the trade or wait for retest of the supply level.

Dow Jones (US30) sits within an Expanding Wedge formation; suppoThe rally was sold, and the dip was bought, resulting in US30 posting an indecisive doji-style candle on Friday.
From a technical perspective, we hold within a large Expanding Wedge pattern. This formation has an eventual bias to break to the downside. The measured move target is 47,452.
Trendline resistance is currently located at 50,980
Trendline support is located at 48,681. Bespoke support is located at 48,600
Conclusion: There's no clear bias from current levels. The preferred stance would be to buy into a dip close to the 48,600 support level for a corrective move higher

EURUSD | FRGNT DAILY FORECAST | Q1 | W7 | D16 | Y26📅 Q1 | W7 | D16 | Y26
📊 EURUSD | FRGNT DAILY FORECAST |
🔍 Analysis Approach
I’m applying a developed version of Smart Money Concepts, with a structured focus on:
• Identifying Key Points of Interest (POIs) on Higher Time Frames (HTFs) 🕰️
• Using those POIs to define a clear and controlled trading range 📐
• Refining those zones on Lower Time Frames (LTFs) 🔎
• Waiting for a Break of Structure (BoS) as confirmation ✅
This process keeps me precise, disciplined, and aligned with market narrative, rather than reacting emotionally or chasing price.
💡 My Motto
“Capital management, discipline, and consistency in your trading edge.”
A positive risk-to-reward ratio, combined with a high-probability execution model, is the backbone of any sustainable trading plan 📈🔐
⚠️ On Losses
Losses are part of the mathematical reality of trading 🎲
They don’t define you — they are necessary, expected, and managed.
We acknowledge them, learn, and move forward 📊➡️
🙏 I appreciate you taking the time to review my Daily Forecast.
Further context and supporting material can be found in the Links section.
Stay sharp 🧠
Stay consistent 🎯
Protect your capital 🔐
— FRGNT 🚀📈
FX:EURUSD

DXY | FRGNT DAILY FORECAST | Q1 | W7 | D16 | Y26📅 Q1 | W7 | D16 | Y26
📊 DXY | FRGNT DAILY FORECAST |
🔍 Analysis Approach
I’m applying a developed version of Smart Money Concepts, with a structured focus on:
• Identifying Key Points of Interest (POIs) on Higher Time Frames (HTFs) 🕰️
• Using those POIs to define a clear and controlled trading range 📐
• Refining those zones on Lower Time Frames (LTFs) 🔎
• Waiting for a Break of Structure (BoS) as confirmation ✅
This process keeps me precise, disciplined, and aligned with market narrative, rather than reacting emotionally or chasing price.
💡 My Motto
“Capital management, discipline, and consistency in your trading edge.”
A positive risk-to-reward ratio, combined with a high-probability execution model, is the backbone of any sustainable trading plan 📈🔐
⚠️ On Losses
Losses are part of the mathematical reality of trading 🎲
They don’t define you — they are necessary, expected, and managed.
We acknowledge them, learn, and move forward 📊➡️
🙏 I appreciate you taking the time to review my Daily Forecast.
Further context and supporting material can be found in the Links section.
Stay sharp 🧠
Stay consistent 🎯
Protect your capital 🔐
— FRGNT 🚀📈
TVC:DXY

ID – 1H Descending Channel With Short Term AccumulationOn the 1H timeframe, ID is clearly trading inside a well defined descending channel, respecting lower highs and lower lows. The macro intraday trend remains bearish as long as price stays inside that channel.
🔍 Current Structure
Recently, price formed a short term ascending mini range / rising structure near the lower half of the channel. This suggests local accumulation after a strong sell off.
We are currently sitting around the 0.0515 – 0.0530 area, which is acting as an intraday pivot zone.
📌 Key Levels
• 0.0515 → Local support / flip Level
• 0.0445 – 0.0460 → Major channel support & liquidity area
• 0.0652 → Resistance Level
• 0.0926 → Higher timeframe major resistance
🧠 Possible Scenarios
🟢 Bullish Case
If price holds above 0.0515 and breaks the descending channel resistance, we can expect continuation toward 0.065 first, and potentially expansion toward 0.09 zone.
🔴 Bearish Case
If the current structure fails and 0.051 breaks with momentum, market could sweep liquidity around 0.0445 before any meaningful bounce.
For now, short term structure is improving, but confirmation only comes with a clean channel breakout.

Week of 2/15/25: AUDUSDPrice has hit an unmitigated daily supply level after breaking daily structure so we can expect a pullback in structure which it's already doing. We are going to remain bearish until 1h structure is broken.

APPLE: Free Trading Signal
APPLE
- Classic bullish formation
- Our team expects growth
SUGGESTED TRADE:
Swing Trade
Buy APPLE
Entry Level - 255.79
Sl - 251.80
Tp - 264.27
Our Risk - 1%
Start protection of your profits from lower levels
Disclosure: I am part of Trade Nation's Influencer program and receive a monthly fee for using their TradingView charts in my analysis.
❤️ Please, support our work with like & comment! ❤️

#WLD/USDT Pump Anticipated#WLD
The price is moving within a descending channel on the hourly timeframe. It has reached the lower boundary and is heading towards a breakout, with a retest of the upper boundary expected.
The Relative Strength Index (RSI) is showing a downward trend, approaching the lower boundary, and an upward bounce is anticipated.
There is a key support zone in green at 0.4000, and the price has bounced from this level several times and is expected to bounce again.
The indicator is showing a trend towards consolidation above the 100-period moving average, which we are approaching, supporting the upward move.
Entry Price: 0.4088
First Target: 0.4180
Second Target: 0.4314
Third Target: 0.4497
Stop Loss: Below the green support zone.
Don't forget one simple thing: Money Management.
For any questions, please leave a comment.
Thank you.

EURCAD1. Weekly timeframe price shows uptrend
2. Price has move above a major resistance level and currently trading above the level.
3. The resistance level could be used as support level price could retest and move high.

BTC analysis🎯 Upside targets:
75,071 (0.5 Fib)
78,612 (0.618 Fib)
⚠️ Major resistance zone between 75K – 79K, possible rejection area.
✅ This is a pullback buy inside a downtrend → take profits step by step.
