Palantir - TGT 223The Stock is showing exceptional performance and expected to hit higher levels.
Stock expected to hit the levels of 223.
It might see the levels of 180 -172 before flying higher.
Chart Patterns

BNB Price Analysis: Is the Next BNB Rally Taking Shape?* The BNB price is sitting in a zone where the next move really matters, with price reacting around major moving averages and previous resistance.
* While short-term charts have shown early signs of improvement, the market is really waiting for confirmation around the $890–$900 area before it can commit.
* According to on-chain data, this looks more like a cooling-off period rather than a breakdown or capitulation.
When you step back and look at BNB, it’s clear the market isn’t in a hurry to make a decision. There’s no panic and no clean breakout either. After running into resistance, the BNB price has slipped into a slow, uncomfortable phase where momentum has cooled and direction is still in the air.
Over the last few sessions, BNB has been hovering around the same area. This kind of price action usually drains attention. Volume dries up, conviction weakens, and the passion in the story fades. It’s not very exciting, but it doesn’t show weakness either; it simply indicates the market is resting on its laurels after the strong movement.
That’s why this stretch matters. The BNB price isn’t breaking down, and buyers are still stepping in on dips. At the same time, rallies keep stalling as price runs into overhead resistance. Sellers aren’t pushing hard, but buyers also haven’t done enough to force a clean break higher. For now, it’s a pause rather than a breakdown.
We’ve seen this before with BNB. In past cycles, we commonly experienced periods of quiet markets following major breakouts. Prices temporarily stalled, momentum decelerated, and the hype died down. Then, once expectations reset, the structure shifted quickly.
On-chain data lines up with that view. BNB’s market cap has eased back slightly from its recent peak, but there are no signs of stress. Network activity surged during the rally and has since cooled, which fits a digestion phase rather than panic selling.
What’s next for BNB?
From here, structure matters more than sentiment. As long as the BNB price holds key support while pressing against resistance, the broader setup stays intact. This phase doesn’t reward impatience, but it’s often where the next meaningful move quietly takes shape.

[SHORT] XRPUSDT - Another Move?XRP still in accumulation area.
Need to go on Support Zone again.
Waiting for Bearish Engulfing in Golden Area then Entry
The TP is set!

#BTC Complex Consolidation Phase📊#BTC Complex Consolidation Phase📈
🧠We've stabilized at the S/R level. Don't be overly bearish until this area is broken. A valid break below this area refers to the 4-hour closing price falling below it.
➡️My long position, having locked in major profits near 91800 without touching the cost price, is still being held. We can try to expect a breakout above the high H level and target around 98000.
⚠️Note that we are still in a consolidation phase; a trend has not yet emerged.
🤜If you like my analysis, please like💖 and share💬
BITGET:BTCUSDT.P

#VET/USDT – Falling Wedge Breakout?#VET
The price is moving in a descending channel on the 1-hour timeframe. It has reached the upper limit and is heading towards breaking downwards, with a retest of the upper limit expected.
We have an upward trend on the RSI indicator, which has reached near the upper limit, and a downward reversal is expected.
There is a major resistance zone in green at 0.01300. The price has bounced from this zone multiple times and is expected to bounce again.
We have a trend of consolidation above the 100-period moving average, as we are moving close to it, which supports a downward move towards touching it.
Entry price: 0.01172
First target: 0.01150
Second target: 0.01122
Third target: 0.01080
Stop loss: Above the resistance zone in green.
Don't forget a simple thing: money management.
For inquiries, please leave a comment.
Thank you.

Gold Outlook Demand Holding, Upside ProjectedGold forming a classic inverse head and shoulders structure after a sharp bearish impulse. Price established the left shoulder, head, and right shoulder within a clearly defined accumulation base, signaling exhaustion of selling pressure. The neckline is marked around the 4,403 region, and price has reacted strongly from the highlighted buy zone, confirming demand interest. The projected bullish continuation targets the 4,538 resistance/high, aligning with the measured move of the pattern. Overall, the structure suggests a short-term bullish reversal, contingent on sustained acceptance above the neckline.

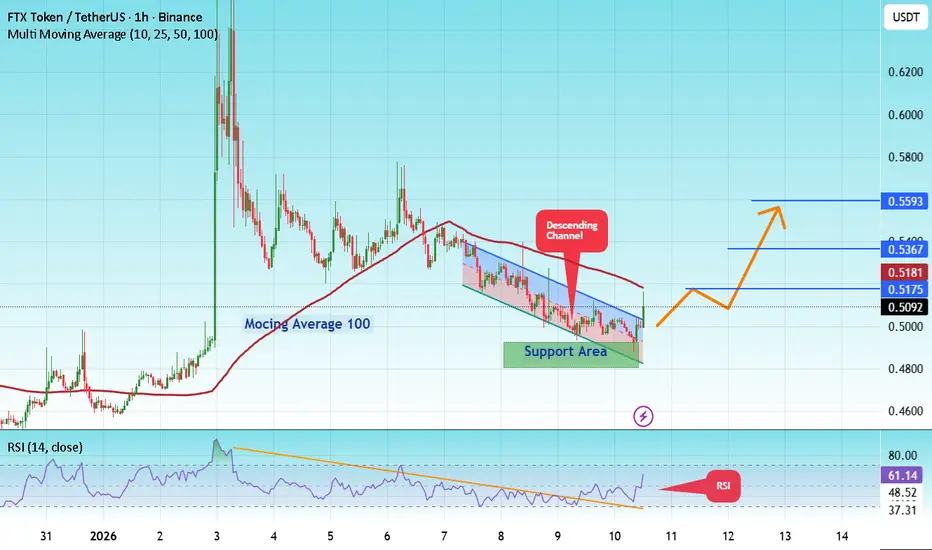
#FTT/USDT : Go to work, it's good#FTT
The price is moving within a descending channel on the hourly timeframe. It has reached the upper boundary and is heading towards breaking it. A retest of this boundary is expected.
The Relative Strength Index (RSI) is showing an upward trend, as it has approached the upper boundary. A bearish reversal is expected.
There is a key support zone in green at 0.4850. The price has bounced from this zone several times and is expected to bounce again.
A consolidation trend is observed above the 100-period moving average, which we are approaching. This trend supports a decline towards this level.
Entry Price: 0.5055
Target 1: 0.5175
Target 2: 0.5367
Target 3: 0.5593
Stop Loss: Above the green support zone.
Remember this simple thing: Money management.
For any questions, please leave a comment.
Thank you.
ARDXrade Setup (Bullish Scenario)
Entry: $6.04 – $6.15 (on confirmation or breakout)
Stop Loss: $5.60 (below structural support)
Target 1: $7.12 – $7.20
Target 2: $7.61 – $7.67
Risk-to-Reward: Favorable (approximately 1:2.5+)

EUR/USD SENDS CLEAR BULLISH SIGNALS|LONG
Hello, Friends!
EUR/USD is making a bearish pullback on the 4H TF and is nearing the support line below while we are generally bullish biased on the pair due to our previous 1W candle analysis, thus making a trend-following long a good option for us with the target being the 1.167 level.
Disclosure: I am part of Trade Nation's Influencer program and receive a monthly fee for using their TradingView charts in my analysis.
✅LIKE AND COMMENT MY IDEAS✅

US READY FOR BREAKOUT🔥 Fortune AI Radar — BMV:US
Fresh activity detected on BMV:US today.
Data suggests increasing market interest & buyers stepping in.
Technicals currently lean bullish, with momentum trending upward.
Whales showing hints of accumulation and hype rising among traders.
This coin is flashing strong signals on short-term charts — worth keeping an eye on 👀
Not financial advice — always research before taking decisions

Organic Meat Company (TOMCL) bullish reversalOrganic Meat Company (TOMCL) is showing strong signs of a bullish reversal after forming a descending channel!
Volume increasing on breakout → buyer conviction rising
Should break key entry level 55.12 with high volumes
Entry: ~55.12-56.12 (confirmed breakout zone)
Stop-loss: 51.24
Target: 66.28

NAS 100 shortstype 3 algo sell setup. the year is still fresh, and the little geo-political thing going on makes stocks vulnerable right now, lets hope i am right.
#NotAFinancialAdvice

XAUUSD – Structure Holding at the Blue BoxHi fellow traders,
On the 1H XAUUSD chart, I am applying Elliott Wave principles to outline a potential continuation scenario. After a sharp corrective move, price is reacting from the blue box and holding above the key structural level, suggesting the correction may be complete and continuation to the upside remains possible.
I am entering at the current price, with a Stop Loss at 4270.00. My Take Profit is set at 4574.60, targeting continuation within the larger impulsive structure.
If price breaks below the stop level, this trade is no longer valid.
Structure first. Noise second.
Good luck and trade safe!


EURUSD BEARISH OUTLOOKIm expecting a bearish movement to the downside as no new highs have been created
the daily candle showing an engulf we might be seeing bearish momentum throughout next year

DXY: Short-Term Momentum Pause After Strong Push HigherThe U.S. Dollar Index has delivered a clean impulsive move higher and is now showing signs of short-term stabilisation. Momentum remains constructive, but price action suggests a pause as the market digests recent gains. This phase may help define the next directional move, with traders watching how price behaves following this consolidation before continuation or deeper rotation develops.
Disclosure: We are part of Trade Nation's Influencer program and receive a monthly fee for using their TradingView charts in our analysis.

UNIUSDT long setup on the 45min TFUNIUSDT long setup on the 45min TF
Entry: 5.435
SL: 5.34
TP1: 6.03
TP2: 6.30
RR: 1:3
Strategy: Bullish divergence with a break of the lower high (LH)

Gann Cycle Alert: January 12th – Critical Pivot Date for BitcoinAs per my custom Gann-based charting system, January 12th, 2026, marks a highly significant time node within the current BTC cycle.
Why This Date Matters :
🟡 Gann Vertical Timing Lines intersect with major channel boundaries and cyclical arcs
🔴 The current candle is approaching multi-timeframe resistance
🟩 Previous Gann pivots (circled) have aligned with major swing highs/lows
📐 Gann angles (1x1, 2x1) and time/price symmetry intersect at this point
Interpretation :
This is a time-based turning point, not a guaranteed reversal. BTC could:
Break out if momentum accelerates
OR reverse from resistance if the market respects the Gann grid
Key Levels :
Support Zone: 82,867 / 74,434
Resistance Zone: 91,000 / 108,000
Cycle Top Projection: 124,500 (bear market top)
This chart blends :
Gann Geometry (square of 9 and square of price/time)
Cycle Arcs (harmonic intervals)
Structural Channels (trend + vibration lines)
🟡 Watch the January 12–15 window closely for volatility and market reaction.
🟡 If BTC respects this pivot, it may confirm the n ext phase of the macro cycle.

#CVX/USDT : Long-Term Breakout Signals Massive Upside Potentia
#CVX
The price is moving within a descending channel on the hourly timeframe. It has reached the lower boundary and is heading towards a breakout, with a retest of the upper boundary expected.
The Relative Strength Index (RSI) is showing a downward trend, approaching the lower boundary, and an upward bounce is anticipated.
There is a key support zone in green at 1.95. The price has bounced from this level several times and is expected to bounce again.
The indicator is showing a trend towards consolidation above the 100-period moving average, which we are approaching, supporting the upward move.
Entry Price: 1.98
First Target: 2.02
Second Target: 2.06
Third Target: 2.12
Stop Loss: Below the green support zone.
Don't forget one simple thing: Money Management.
For inquiries, please leave a comment.
Thank you.

#XVS/USDT – Accumulation Nearing Its End, Major Breakout?
#XVS
The price is moving within a descending channel on the hourly timeframe. It has reached the lower boundary and is heading towards a breakout, with a retest of the upper boundary expected.
The Relative Strength Index (RSI) is showing a downward trend, approaching the lower boundary, and an upward bounce is anticipated.
There is a key support zone in green at 0.0766. The price has bounced from this level several times and is expected to bounce again.
The indicator is showing a trend towards consolidation above the 100-period moving average, which we are approaching, supporting the upward move.
Entry Price: 0.0794
First Target: 0.0832
Second Target: 0.0876
Third Target: 0.0941
Stop Loss: Below the green support zone.
Don't forget one simple thing: Money Management.
For inquiries, please leave a comment.
Thank you.

MEBLShort-term bullish trend intact
Healthy pullback after strong upward move
Buy zone: 465–475
Price holding above key support
RSI cooling from overbought, momentum still positive
Upside target: 505

NIFTY,BANKNIFTY,S&P 500 – Correction Unfolds, Volatility ReturnNifty closed the week at 25,683, sharply down ~650 points from the previous week. The index formed a high of 26,373 and a low of 25,623, confirming that trending moves have returned after the holiday season—exactly as anticipated.
The previously defined 26,700–25,900 range has been decisively breached, with price taking temporary support near the 25,600 zone.
Technically, Nifty has printed a strong bearish outside bar, engulfing the entire price action of the last 7 weeks—a clear sign of distribution and momentum shift.
25,600 – Acceptance vs Rejection Zone
This level will decide the next swing:
Acceptance above 25,600 (higher lows / stable closes) → scope for a technical pullback
Repeated rejection below 25,600 → continuation of the corrective move
Pullback Scenario (Corrective Bounce)
If Nifty manages to hold above 25,600, a bounce towards:
26,000
26,150
These zones should be treated as supply / short-on-rise areas, not fresh breakout levels.
Downside Risk (Continuation)
If 25,600 fails on a closing basis, next supports lie at:
25,400
25,250
Expected Trading Range (Next Week):
26,150 – 25,250
Bigger Picture – Why Caution Is Warranted
As highlighted in my 27th December post, Nifty was trading at extremely overbought levels on the yearly chart, signaling an impending correction.
What adds to the concern is that the December low has already been broken this month. As long as this remains the case, any bounce should be treated as corrective, not a trend reversal.
This phase resembles a healthy corrective reset after momentum excess, not a structural bear market—yet volatility will stay elevated.
Investor Strategy – Build the Shopping List
Corrections create opportunities.
This is the right time to track fundamentally strong stocks and names where smart money (FII & DII) is steadily increasing exposure.
During recent scans, I’ve identified multiple stocks trading near:
Monthly EMA 200
Weekly WEMA 200
These zones often act as high-probability accumulation areas.
I’ve started building my shopping list—have you?
BANK NIFTY – RELATIVE WEAKNESS EMERGES
Bank Nifty, the most volatile index of the Indian market, failed to sustain above the crucial 60,092 Fibonacci level and closed at 59,251, down nearly 900 points for the week.
This relative underperformance is a warning sign—sustainable Nifty recoveries need bank participation.
Downside Levels:
Daily close below 59,000 →
DEMA 100 at 57,865
DEMA 200 at 56,250
Upside Cap:
Near-term upside remains capped at 60,200–60,300
S&P 500 – ATH CONTINUES, TRAIL PROFITS STRICTLY
The S&P 500 closed at a fresh all-time high of 6,966, with momentum pointing towards the key Fibonacci level of 7,026.
Risk Management for US Market Participants:
Trailing stop-loss:
Consecutive daily close below 6,826, OR
A confirmed close + follow-through below DEMA 100 (6,687)
This helps avoid single-day whipsaws near moving averages.
Bonus Tip for Nifty Traders
Trail existing short positions
26,000 remains a strong supply zone and can be used to initiate fresh shorts on pullbacks

BTC H&S pattern targeting 34,8kIn my view BTC is printing an H&S pattern, current rebound from 80k area represents right shoulder and will continue to test 98k -103k area before massive crash. My final target is 35k area next autumn.
