WOOUSDT UPDATE#WOO
UPDATE
WOO Technical Setup
Pattern: Falling Wedge Pattern
Current Price: $0.0293 USDT
Target Price: $0.0600 USDT
Target % Gain: 125.74%
Technical Analysis: WOO is showing signs of a potential breakout from a falling wedge pattern on the 1D chart, indicating bullish reversal potential if price continues to hold above key breakout levels. The token is currently trading around ~$0.0293 USDT, and a sustained breakout above the wedge resistance—with confirmation from volume—could validate a move toward the projected upside target near $0.0600 USDT. This target zone reflects the measured move from the wedge pattern and aligns with structural resistance above the current market price.
Time Frame: 1D
Risk Management Tip: Always use proper risk management.
Chart Patterns

MAGICUSDT UPDATEMAGIC
UPDATE
MAGIC Technical Setup
Pattern: Falling Wedge Pattern
Current Price: $0.10 USDT
Target Price: $0.2500 USDT
Target % Gain: 145.74%
Technical Analysis: MAGIC (Treasure token) is positioned as breaking out of a potential falling wedge pattern on the 1D chart, signaling possible bullish momentum if the breakout sustains. Price is currently consolidating near a key breakout area, and reclaiming above the descending trendline with follow-through could validate a larger move toward the highlighted target near $0.2500. At current levels around $0.10, this projected move represents significant upside if structure holds and volume supports the breakout.
Time Frame: 1D
Risk Management Tip: Always use proper risk management.

GBPUSD – Daily Outlook (Weekend Prep) Let’s break this down without noise.
1️⃣ Higher Timeframe Context
Price expanded strongly from discount into premium, delivering the upside move.
That leg completed its job.
2️⃣ Premium Reaction = Distribution
Inside premium, we saw:
• Rejection at the highs
• Failure to continue higher
• Signs of distribution, not continuation
This tells us longs are late here.
3️⃣ IRL Draw = Sellside
The draw on liquidity is now clear:
➡️ IRL Sellside Liquidity below
That’s where price is incentivized to go next.
4️⃣ Short-Term Structure
Price left a bearish FVG after the premium reaction.
Expectation:
• Retrace into the FVG
• Then continuation lower toward sellside
5️⃣ Weekly Expectation
➡️ Pullback / mitigation
➡️ Distribution confirmed
➡️ Expansion lower into IRL sellside liquidity
No rushing.
No prediction.
Let price deliver.
📌 Bias: Bearish while below premium
📌 Execution: Wait for HTF alignment → LTF entry
📌 Rule: Location first, entries second
DAT | Dr Algo Tradin

CTKUSDT UPDATE#CTK
UPDATE
CTK Technical Setup
Pattern: Falling Wedge Pattern
Current Price: 0.2837$
Target Price: 0.5846$
Target % Gain: 95.67%
Technical Analysis: CTK is breaking out of a falling wedge pattern on the 1D timeframe, suggesting a bullish reversal after a prolonged corrective phase. Price has pushed above the descending resistance trendline and is starting to show higher lows, indicating improving momentum. The upside target is projected from the height of the wedge, pointing toward the 0.58–0.60$ resistance zone, which also aligns with previous supply levels. Sustained price action above the breakout area would strengthen the bullish continuation case.
Time Frame: 1D
Risk Management Tip: Always use proper risk management.

GMTUSDT UPDATE#GMT
UPDATE
GMT Technical Setup
Pattern: Falling Wedge Pattern
Current Price: 0.02143$
Target Price: 0.03060$
Target % Gain: 112.84%
Technical Analysis: GMT is breaking out of a falling wedge pattern on the 1D timeframe, signaling a bullish reversal after an extended downtrend. Price has pushed above the descending resistance trendline and is showing follow-through strength, suggesting buyers are gaining control. The projected upside target is derived from the height of the wedge, pointing toward the 0.030–0.031$ region, which also aligns with a previous resistance zone. A sustained hold above the breakout area would support continuation toward the target.
Time Frame: 1D
Risk Management Tip: Always use proper risk management.

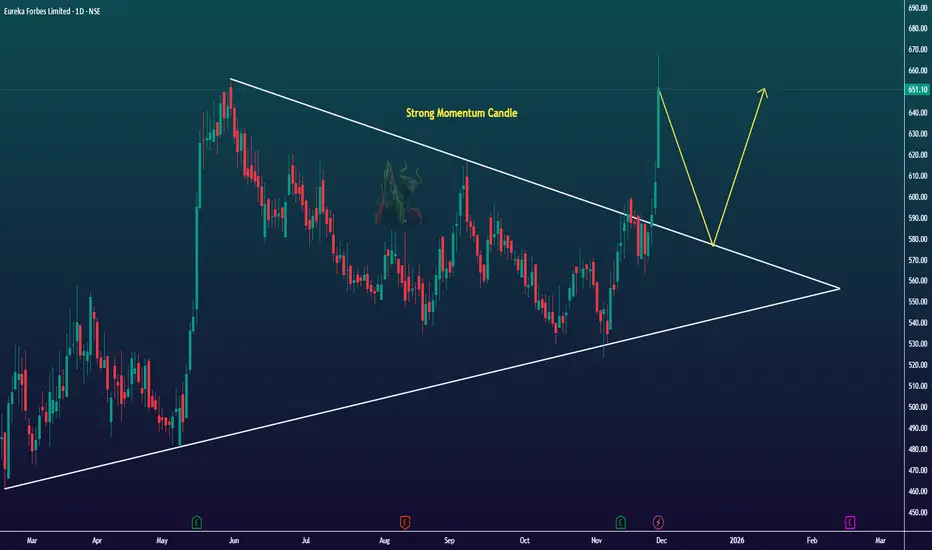
Momentum Shift Detected in EUREKAFORBNSE:EUREKAFORB shows a strong momentum candle on the daily chart after weeks of choppy structure. Price is pushing into a higher zone.
momentum is clear, but structure is still broad. Watching how it behaves in the next few sessions.
Potential outside week and bullish potential for HMCEntry conditions:
(i) higher share price for ASX:HMC above the level of the potential outside week noted on 9th January (i.e.: above the level of $4.14).
Stop loss for the trade would be:
(i) below the low of the outside week on 6th January (i.e.: below $3.73), should the trade activate.

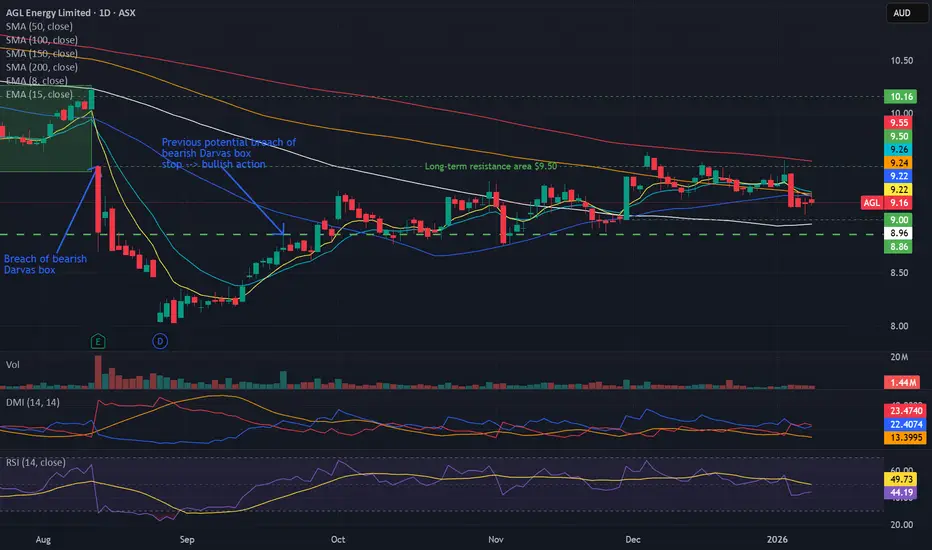
Bearish potential detected for AGLEntry conditions:
(i) lower share price for ASX:AGL along with swing of DMI indicator towards bearishness and RSI downwards, and
(ii) observing market reaction around the share price of $9.00 (open of 28th November).
Depending on risk tolerance, the stop loss for the trade would be:
(i) above the declining 200 day MA (currently $9.55), or
(ii) above the recent swing high of $9.63 from 3rd December.
Give answer if you are seeing before it break # bitcoinHello trader's
Here is you bitcoin update chart hope you get some view on it,
now Also comment of that question i put for you in the chart
..

CRYPTO GOES 'TETHERED & CIRCLED' AMID THE PERDITION OF BTC BULLSThe recent 'Tethering and Circling' of crypto assets amid the downturn of Bitcoin (BTC) bulls can be explained by several interconnected factors rooted in market dynamics, investor behavior, and regulatory pressures.
As BTC bulls face setbacks in sustaining their upward momentum in 2025, the crypto market as a whole tends to become more tethered and circled around stablecoins like Tether (USDT) and Circle's USD Coin (USDC).
This shift is due to the need for stability, liquidity, and risk mitigation in an environment of uncertainty.
Role of Stablecoins Amid BTC Bear Pressure
Stablecoins like Tether and Circle have become dominant anchors in the crypto ecosystem, controlling over 80% of the global stablecoin market capitalization. Their foundational role is to provide a stable medium of exchange and store of value pegged to fiat currencies, predominantly the US dollar. As Bitcoin bulls lose steam and volatility spikes, investors and traders increasingly move their capital into these stablecoins to avoid the sudden price swings of BTC and altcoins. This creates a "tethering" effect where a large portion of liquidity is parked in stablecoins, allowing market participants to quickly enter or exit positions while minimizing exposure to risk. Stablecoins thereby act as a safe haven within the crypto market during periods of bearish sentiment or market correction.
Market Sentiment and BTC Cycle Influences
The 2025 Bitcoin cycle differs significantly from previous bull runs seen in 2021. Analysts suggest the true peak of Bitcoin’s cycle was back in April 2021, and since then the market has entered a phase characterized by cautious consolidation rather than explosive growth. Key macroeconomic indicators such as inflation trends, Federal Reserve rate policies, and quantitative tightening play substantial roles in shaping this slower, more measured market behavior. With BTC showing signs of a shallow bear phase and mixed momentum, investors' confidence is dented, pushing them towards safer crypto assets like stablecoins and highly liquid tokens.
Increased Regulatory and Competitive Pressures
The crypto market environment in 2025 is also shaped by growing regulatory scrutiny, especially around stablecoins themselves. Regulations in regions such as the EU have introduced frameworks like MiCA, impacting how stablecoin issuers operate. Tether, for instance, has responded cautiously to some regulatory moves, even choosing not to comply with certain restrictive regulations, leading to delisting from some centralized exchanges and challenges in maintaining its dominance.
Meanwhile, Circle’s USDC has been slightly less affected due to wider regulatory acceptance but still faces limitations on certain yield-generating activities. These regulatory pressures influence market dynamics, prompting crypto participants to actively circle around the most trusted and compliant stablecoin options to secure their holdings.
Market Dynamics of Crypto Herd Behavior
Moreover, cryptocurrencies tend to move together due to their correlated trading patterns. Large market movements in BTC often trigger cascading effects in altcoins and other digital assets. When BTC bulls falter, a wave of stop-loss liquidations occurs, leading traders to sell off altcoins and consolidate holdings into stablecoins or less volatile crypto instruments. This communal movement is amplified by the relatively smaller market caps of altcoins compared to BTC and the 24/7 nature of crypto trading, intensifying the tethering phenomenon as market participants seek to safeguard their assets and maintain liquidity.
Technical challenge
The main technical chart is a sum of USDT and USDC dominance; they both in nowadays represent more then 80 percent of all stablecoins market cap.
Long term upside trend is still looks robust, with a potential of Bull extension due to 200-week simple moving average brekthrough.
In summary, the crypto market's increasing tethering and circling around stablecoins amid the recent bearish phase of BTC bulls in 2025 is mainly due to the need for stability during heightened volatility, the maturation and changing cycle of Bitcoin, regulatory developments around stablecoins, and the inherent herd behavior in crypto trading. This dynamic ensures that stablecoins remain central hubs in the crypto economy as investors navigate uncertain market conditions.

Will gold prices continue to rise next week?Will gold prices continue to rise next week?
On Monday, gold prices surged, forming a macro-level triangle consolidation pattern, boosted by news of the Venezuelan president's arrest.
On Friday, after the release of key non-farm payroll data, gold prices broke out of this triangle consolidation pattern, but the breakout was limited.
So: Will gold prices continue to rise, and could they potentially rise another $100-200 next week?
I think it's unlikely.
First, we need to identify two current resistance levels:
1: $4520 (current resistance level)
2: $4550 (historical high)
Conclusion: Given the current strength of gold prices, it's uncertain whether they can successfully break through these two price ranges tomorrow (Monday).
Key point: Undeniably, the current macro-bullish view on gold is based on sound trading logic.
Secondly, we need to identify three current support levels:
1: 4480 (Initial pullback support zone)
2: 4450 (Significant pullback support zone)
3: 4405 (Trend pullback support zone)
Conclusion:
1: If you haven't yet established a long position and adhere to intraday trading principles, then I believe buying on a pullback is a very wise trading option.
2: I don't recommend chasing the price upwards at this time, as your capital may already be locked at the highest point of the price range.
3: Before assessing whether to follow the trend or go short, please fully test the resistance performance of the 4520-4550 range.
At the beginning of the new year, we welcome more trading partners and followers.
In the new year, I will continue to maintain high-quality trading signals with a win rate exceeding 85%, and share them with all traders who follow my public channel.
The impressive data from last quarter helped many people regain trading confidence, which is the greatest recognition and affirmation of my value.
I insist on doing the right thing.
Thank you for your attention.
Tomorrow, Monday, I will be sharing the latest trading guidance with all my followers in real time.

Gold Market Analysis and Outlook: Non-Farm Payroll Data StrengthGold Market Analysis and Outlook: Non-Farm Payroll Data Strengthens Bullish Trend, Technicals Point to Key Resistance
Fundamental Overview: Mixed Non-Farm Payrolls and Policy Expectations
The US December 2025 non-farm payrolls report, released on Friday (January 9th), became the market focus. Data showed that non-farm payrolls increased by 50,000 in the month, lower than the market expectation of 73,000, and further slowed from the revised previous figure of 56,000. This confirms the trend of a continued cooling in the US labor market at the end of the year. However, the unemployment rate unexpectedly fell to 4.4%, better than the expected 4.5%, providing some support for the data.
The market's interpretation of this was dovish. The weak job growth strengthened investors' expectations for future interest rate cuts by the Federal Reserve, although the decline in the unemployment rate may allow the central bank to maintain interest rates unchanged in the short term (such as at the January meeting). This combination of "slowing but not stalled growth" is seen by the market as conducive to the Fed achieving a soft landing for the economy and may pave the way for it to start a rate-cutting cycle in early 2026. A low-interest-rate environment typically reduces the opportunity cost of holding gold, a non-interest-bearing asset, thus providing medium-term support for gold prices.
Furthermore, geopolitical risks also provide safe-haven demand for gold. US statements on Venezuela, the situation in Iran, and frictions in international trade relations have all exacerbated market uncertainty, increasing the attractiveness of gold as an asset allocation.
Technical Analysis: Bullish Pattern Solid, Focus on Key Level Breakouts
From a technical perspective, gold has continued its bullish trend, catalyzed by fundamental factors.
Trend and Structure: On the daily chart, gold prices effectively broke through the key psychological level of $4,500, reaching a high of $4,517 on Friday. Although there was a technical pullback to $4,481 during the session, the price quickly recovered, ultimately closing near $4,509, recording a significant weekly gain. This movement indicates that after a brief consolidation at an important level, bullish momentum remains dominant. The moving average system is in a bullish divergence, providing dynamic support for the price. The weekly chart shows a single bearish candlestick pullback after a continuous rise, which is consistent with the technical correction characteristics of a strong market, and the overall upward channel remains intact.
Key Price Levels:
Upside Resistance: The primary resistance level is located in the historical high area of $4540-$4560. A decisive break above this range would open up further upside potential.
Downside Support: The key short-term support zone is located in the $4480-$4500 area, formed by the recent pullback low and the breakout level, and can be considered a key dividing line between bullish and bearish sentiment. Stronger support lies in the $4430-$4450 area (near the 21-day simple moving average and the upper edge of the previous consolidation platform).
Technical Indicators: The daily Relative Strength Index (RSI) remains above 60, indicating continued buying momentum. The Average Directional Index (ADX) is moderate, suggesting a moderate trend strength without signs of overheating. Overall, the technical signals and price action are in sync, supporting a bullish outlook.
Market Outlook and Trading Strategy
Overall, weak employment growth data has strengthened market expectations of a shift in monetary policy, creating a favorable macroeconomic environment for gold. Meanwhile, the technical breakout and solid support provide a structural foundation for further price increases.
Trading Strategy Recommendations:
Main Strategy: Primarily buy on dips. Watch for stabilization signals when prices retest the $4490-$4500 support area as entry opportunities for long positions. Place a stop-loss order below $4470, targeting the $4540-$4560 area.
Resistance Management: If gold prices initially rise to the strong resistance area of $4540-$4560 and then stall or show technical divergence signals, consider a small short position for swing trading.
Risk Monitoring: Closely monitor how well the price defends the $4480 support level. If gold prices break below this support and continue to weaken, be wary of a weakening of short-term upward momentum, potentially leading to consolidation or a deeper correction.
Key Focus: Next week, the market will digest the impact of the non-farm payroll data and pay attention to speeches by several Federal Reserve officials for further clues about the path of monetary policy. Meanwhile, developments in geopolitical events could also trigger market sentiment fluctuations, providing additional impetus for gold prices.

DSCW breakthrough downtrend & the lower level of symmetrical triDSCW successfully breakthrough downtrend and rebounded from the lower level of symmetrical triangle. Closing above 1.77 will pave the way to the following targets: 1.83 - 1.94 - 2.1
Current stoploss level: 1.72

The chart is a 1-hour Gold Spot (XAU/USD) price chartThe chart is a 1-hour Gold Spot (XAU/USD) price chart
1. Price Action: The chart displays a bullish trend with green and black candlesticks indicating price movements. The recent price is $4,509.73, down slightly by 0.04%.
2. Trend Lines: Two blue parallel lines form an ascending channel, suggesting an uptrend. The price is moving within this channel.
3. Target Point: A horizontal black line marks the target price at approximately 4,549.52, indicating an expected bullish move toward this level.
4. Sell Side Liquidity Zone: A red shaded area between ~4,433.02 and ~4,457.27 represents a liquidity zone where sell orders are likely concentrated. The price has broken above this zone, signaling potential further upside.
5. Green Rectangle: Highlights the projected bullish move from the liquidity zone to the target point, with an expected range of 4,457.00 to 4,549.52.
Interpretation
- The analysis suggests a buy setup, expecting the price to rise from the liquidity zone toward the target after breaking the channel.
- The sell-side liquidity zone acted as a support before the breakout.
- Traders may watch for consolidation above the zone or a pullback to the channel for entry.

HRHO downtrend breakthrough HRHO successfully penetrated downtrend with volume exceeding the average 30 days volume, penetrating the level of 25.9 and closing above that level will pave the way to the following targets: 26.4 - 28.2 - 29.7
Current stoploss level is 24.8

dusk can give good bullish rally overall in downtrend from long time, but now showing signs of recovery, price is not dropping as it dropped earlier, and testing descending trend line again and again, trendline getting weaker on every test, its does not mean we are bullish on dusk, still need confirmation/breakout, waiting for trend line plus horizontal resistance breakout, after successful breakout it can give more than 2x

Gold Spot / U.S. Dollar (XAUUSD) – 30-Minute Bullish Pullback toMarket Structure
Overall bias: Bullish
Price previously respected a rising channel, making higher highs and higher lows.
The recent move is a healthy pullback, not a trend reversal yet.
📉 Current Price Action
Price has broken below the minor ascending channel, indicating short-term weakness.
However, it has now reached a strong demand/support zone (red shaded area).
The latest candles show reaction at support, suggesting buyers are stepping in.
🟩 Support & Resistance
🔴 Support Zone
Key support: ~4,360 – 4,400
This area previously acted as:
Consolidation
Breakout base
Demand zone
As long as price holds above ~4,360, bullish structure remains valid.
🟢 Resistance / Target
Target area: ~4,500 – 4,505
This aligns with:
Previous swing high
Liquidity resting above highs
Marked “TARGET POINT” on your chart
📊 Trade Idea (As Illustrated)
Bias: Buy the dip
Entry zone: Around 4,400 – 4,420
Stop loss: Below 4,360
Take profit: 4,500+
Risk–Reward: Favorable (roughly 1:2.5 or better)
⚠️ Invalidation
A clean break and close below 4,360 would:
Break the higher-low structure
Open downside continuation toward ~4,300
Invalidate the bullish setup
🧠 Summary
✔ Bullish trend intact
✔ Pullback into strong support
✔ Good risk-to-reward long opportunity
❗ Wait for confirmation (bullish candle / rejection) at support

BTC analysis#Bitcoin is currently holding the support level of $90,000 and is trading above it. Volume is low due to the weekend trading conditions. We might see another test of the resistance level once the volume picks up. The key resistance area to watch is between $94,000 and $95,000

XAUUSD (Gold) – Bullish Continuation Setup Bullish FlagXAUUSD (Gold) – Bullish Continuation Setup
Price has confirmed a clear Change of Character (CHoCH), indicating a bullish shift in market structure.
After the breakout, price is consolidating within a bullish flag, which suggests continuation rather than reversal.
Bias: Bullish
Entry: 4509
Invalidation: 4482 (structure break)
Target: 4585 (next liquidity / previous high)
📌 Structure-based analysis
📌 Trade idea requires confirmation
📌 Proper risk management is essential
📌 This is not financial advice

GOOG / GOOGLE / ALPHABETGOOG - following a cycle of 47 months. It bottoms out or tops out in the zone highlighted. Since the breakout in September 2025; seems headed for 381/416. Would make sense to book out any investments if it reaches there and wait for levels of 250 or lower.

XAUUSD H4 – Gold Trading Plan for Next Week (Liquidity-Based Levels)
Gold is heading into a key decision week as price returns to a major reaction area. The market is currently best traded by waiting for liquidity reactions at the highlighted zones, rather than chasing moves in the middle of the range.
1) H4 Technical Context
Price has recovered and is now retesting a key pivot region around the 4.45xx area.
The chart shows clear supply zones overhead, while the 4445–4449 zone stands out as the highest-probability buy reaction area.
If price holds this buy zone, the preferred path is continuation higher toward the upper supply region near 4632–4637.
2) Key Levels to Watch
Main BUY zone: 4445 – 4449
Liquidity confluence area with strong probability of bullish reaction if structure remains intact.
Mid resistance: 4550 – 4560
A reaction zone where buyers may take partial profits and where price behaviour matters.
Target SELL zone (scalping): 4632 – 4637
Strong overhead supply. Ideal for short-term sell reactions if price rallies sharply and shows rejection.
Strong support: around 4408
If the main buy zone fails, this level becomes the next key area that defines whether the pullback deepens.
3) PRIORITY SCENARIO – Main Plan (Buy with Structure)
Next week’s primary strategy remains trend-following, but execution should be level-based.
Buy area: 4445–4449
Best confirmation: H4/H1 candles hold the zone and close back above it without a strong breakdown.
Upside expectations: push toward 4550–4560 first, then extend toward 4632–4637.
4) ALTERNATIVE SCENARIO – If the Buy Zone Fails
If price breaks 4445–4449 cleanly and accepts below it:
A deeper correction can develop toward 4408 and potentially lower.
In that case, the plan is to wait for a clear reaction at support before looking for the next long setup.
5) SELL Scenario – Short-Term Only
Selling is not the primary strategy. It is only considered as a short-term scalp at premium supply.
Sell zone: 4632–4637
Only sell on clear rejection signals such as strong wicks, failed breakout, or a lower-timeframe structure shift.
6) Weekly Summary
Focus zone: 4445–4449 is the key decision area
Hold above it → prefer BUY toward 4550–4560 and 4632–4637
Lose it → watch 4408 for deeper correction reaction
Sell ideas are scalps only at the upper supply zone

BULlISH CBAV3 - Significant loss to profit turnaround +CBAV3 Fundamentals: Swung from R$30M loss (1Q24) to R$335M profit (1Q25).
Significant recovery tied to higher aluminum pricing and improved margins.
CBAV3 Technicals: breakout above major pivots + crossover + price gaining volume above crossover and breakouts.
I'm LONG at 8.650
SL or TP if price close under 50 EMA (Weekly)

LONG IIFL Finance (IIFL.NS) due to turnaround thesis
Fundamentals: Swung from loss to profit on margin recovery and credit normalization.
Technicals: Breakout from previous relevant swing highs with volume above 20SMA. Crossover with 30 EMA and 50 EMA.
I'm LONG IIFL Finance @ $649.30
SL or TP: When it closes below 50 EMA (WEEKLY)
