BCH_USDT 4H TIME FRAMEThis is my short-term idea.
"This is my opinion about the current moment based on a 4-hour chart. This analysis has been done using Malaysian SNR and SMC concepts. At this time, I see the crypto market is ready for a small buy movement."
So I'm sharing my crypto market analysis! I'hv using:
SNR (Malaysian Support and Resistance)
SMC (Smart Money Concepts)
Looking at the daily chart
And you believe the market is setting up for a good buying opportunity
"In this area, I am carefully watching to see if a candle is created in the CRT model. Further, I am watching to see if a divergence is forming. If a divergence doesn't form, I will catch the buy trade using the next QM that forms."
✅ Educational purposes only - For learning and discussion
✅ Not financial advice - Not recommending anyone to invest
✅ DYOR (Do Your Own Research) - Everyone should do their own analysis
Chart Patterns

XAUUSD – H2 Technical OutlookXAUUSD – H2 Technical Outlook | Lana ✨
Gold is still holding a strong bullish structure, and what we’re seeing right now is a healthy technical pullback after the ATH breakout — not a reversal signal.
📈 Market Structure & Trendline
Price has broken the previous ATH and held above it, reinforcing the medium-term uptrend.
The current leg looks like a classic impulse → correction → continuation sequence.
The rising trendline remains respected, so the main bias stays bullish (BUY the dip).
🔢 Fibonacci Confluence & Key Zones
Applying Fibonacci to the most recent impulsive move:
✅ High-probability BUY areas
Buy GAP: 4515 – 4518
This is an imbalance zone where price often returns to rebalance before continuing higher.
Fibo 0.618: around 4545
A strong retracement level aligning with liquidity and bullish structure support.
These two zones are the best “value areas” to focus on for long entries.
🟢 Preferred BUY Scenarios
Plan A: Buy from 4515–4518 after bullish confirmation on H1–H2
Plan B: If price tags ~4545 (0.618), wait for confirmation and look for continuation longs
➡️ Upside targets: retest ATH first, then continuation can extend toward the 46xx–47xx area if resistance breaks and price accepts above.
🔴 Resistance & Breakout Confirmation
The zone around 4597 – 4630 is the near-term resistance area.
A clean break and acceptance above this zone would be a strong confirmation for a push toward 47xx.
🧠 Notes
Avoid FOMO and chasing price when the market is trading at elevated levels.
Be patient and wait for price to pull back into value zones.
Prioritize BUY setups aligned with the main trend and market structure, not emotional trades.

13/01/2026 - Daily forecastForecast of pairs on watch today, using multi-timeframe analysis.
Watchlist for today:
FX:USDJPY
FX:GBPUSD

BTC BEAR RUN TO BULL RUN with many TARGETZ.It's self explanatory, we go down. if arcs don't play exact, adjust so they are in same format. Have fun!

Market paused before the next decisionAfter the last surge, BTC entered a consolidation phase below the resistance.
The short-term structure continues to show higher lows, which maintains the bullish bias as long as this base holds.
At this moment, the market needs acceptance above the resistance zone to confirm continuation.
Without this, it is normal to see more sideways movement or a short correction before the next move.

XAUUSD – H2 Technical Outlook | Lana XAUUSD – H2 Technical Outlook | Lana ✨
Gold is still holding a strong bullish structure, and what we’re seeing right now is a healthy technical pullback after the ATH breakout — not a reversal signal.
📈 Market Structure & Trendline
Price has broken the previous ATH and held above it, reinforcing the medium-term uptrend.
The current leg looks like a classic impulse → correction → continuation sequence.
The rising trendline remains respected, so the main bias stays bullish (BUY the dip).
🔢 Fibonacci Confluence & Key Zones
Applying Fibonacci to the most recent impulsive move:
✅ High-probability BUY areas
Buy GAP: 4515 – 4518
This is an imbalance zone where price often returns to rebalance before continuing higher.
Fibo 0.618: around 4545
A strong retracement level aligning with liquidity and bullish structure support.
These two zones are the best “value areas” to focus on for long entries.
🟢 Preferred BUY Scenarios
Plan A: Buy from 4515–4518 after bullish confirmation on H1–H2
Plan B: If price tags ~4545 (0.618), wait for confirmation and look for continuation longs
➡️ Upside targets: retest ATH first, then continuation can extend toward the 46xx–47xx area if resistance breaks and price accepts above.
🔴 Resistance & Breakout Confirmation
The zone around 4597 – 4630 is the near-term resistance area.
A clean break and acceptance above this zone would be a strong confirmation for a push toward 47xx.
🧠 Notes
Avoid FOMO and chasing price when the market is trading at elevated levels.
Be patient and wait for price to pull back into value zones.
Prioritise BUY setups aligned with the main trend and market structure, not emotional trades.

Gold Price Update - Bullish Continuation Above Key SupportGold remains in a strong bullish structure as price continues to trade within an ascending channel and holds above key higher low supports. The recent break of structure (BOS) confirms buyer control while price is consolidating above the mid channel trendline indicating a healthy pause rather than a reversal. Technically the 4550-35 zone aligns with previous resistance turned support and sits near the channel support making it a high probability demand area. As long as gold holds above this zone the upside remains favored with scope for a push toward 4650 followed by 4750-4850 if momentum accelerates.
From a fundamental perspective gold continues to find support from expectations of future US rate cuts softer US dollar outlook and persistent geopolitical and economic uncertainty which keeps safe haven demand intact. Any weakness in USD will further strengthen gold bullish bias while strong US data may only cause short term pullbacks within the broader uptrend.
Trade Plan:
Buy Zone: 4535-4495
Buy Trigger: Bullish rejection from the buy zone or a strong 4H close above 4600-4630
Targets: 4630 - 4765 - 4848
Invalidation: Sustained break and close below 4490
Overall dips remain buying opportunities unless price decisively breaks below 4420 which would signal a deeper corrective phase.
Note
Please risk management in trading is a Key so use your money accordingly. If you like the idea then please like and boost. Thank you and Good Luck!

EURCHF H4 | Potential Bearish DropBased on the H4 chart analysis, we can see that the price has rejected off our sell entry level at 0.93134m, which acts as an overlap resistance that aligns with the 38.2% Fibonacci retracement.
Our stop loss is set at 0.93324, which is a pullback resistance that aligns with the 50% Fibonacci retracement.
Our take profit is set at 0.92595, which is a pullback support that aligns with the 61.8% Fibonacci retracement.
High Risk Investment Warning
Stratos Markets Limited (

Gold Before CPI: Top or Trap?1. STRATEGIC CONTEXT
Primary trend: GOLD remains in an uptrend; the higher-timeframe structure is still intact.
Macro backdrop:
CPI tonight may cause short-term volatility.
However, geopolitics is currently a stronger driver than CPI.
Key geopolitical risks:
Greenland tensions → escalating global strategic rivalry.
Protests in Iran, power and internet cuts → rising Middle East risks.
👉 Strategic implication:
Gold continues to be supported as a safe-haven asset → pullbacks are for buying, not for chasing shorts.
📊 2. CURRENT MARKET STRUCTURE
Price is:
Holding the ascending trendline
Consolidating in a box, compressing ahead of CPI
Market condition:
High probability of false breakouts
Top-catching traps are very likely before the news
📍 3. KEY PRICE LEVELS
🔴 RESISTANCE
4,680 – 4,700
→ Previous high / ATH zone
→ Reactive sells only if clear rejection appears
4,655 – 4,660
→ Intermediate resistance, easily swept pre-CPI
🟣 CONSOLIDATION BOX
4,595 – 4,630
→ Sideways range ahead of CPI
→ No FOMO inside the box
🟢 SUPPORT
4,545 – 4,550 → Major confluence support
4,480 → Medium-term support, trendline retest
4,420 → Deep support, last bullish structure zone
📝 4. IMPORTANT NOTES
Higher CPI:
May trigger a technical pullback
❌ Does NOT automatically mean a top
Lower / in-line CPI:
Gold may consolidate above highs and break ATH
Selling before CPI:
→ Reactive scalps only, no holding
Buying:
→ Only when price reaches key zones with clear reaction
🎯 5. STRATEGIC MINDSET
❌ Don’t force top-catching while geopolitics supports gold
✅ Focus on risk management – wait for zones – wait for confirmation
🧠 Before CPI: survival > profit

$NB LONGNB is retesting the base breakout levels and making a double bottom on the SR flip levels, RSI breaching 60 Long term moving avgs looks good. Price tested POC few times and broke above. Long 🐂

GBPCAD H1 | Bullish Momentum To ExtendBased on the H1 chart analysis, we could see the price fall to tour buy entry level at 1.8644, which is a pullback support that aligns with the 50% Fibonacci retracement.
Our stop loss is set at 1.8605, which is a pullback support.
Our take profit is set at 1.8703, which is a multi swing high resistance.
High Risk Investment Warning
Stratos Markets Limited (

SILVER XAGUSD SILVER IS HEADING TO 100$
if we dont pullback for correction demand will continue to exceed supply pushing price to the moon.
what is silver
Silver is a chemical element (symbol Ag, atomic number 47) with the highest electrical and thermal conductivity of any metal, exceptional reflectivity, and potent antibacterial properties, making it invaluable beyond jewelry and investment.
Industrial Applications
Electronics: Unrivaled conductivity drives use in printed circuit boards (PCBs), semiconductors, switches, contacts, RFID chips, and flexible screens; consumes ~1/3 of global silver demand.
Solar Photovoltaics: Critical in photovoltaic cells (20g per panel); silver paste conducts electricity efficiently, powering renewable energy growth.
Automotive/EVs: Electrical systems, batteries, connectors, and sensors in electric vehicles; rising EV adoption boosts demand.
Catalysis: Produces ethylene oxide (plastics/antifreeze), formaldehyde, and disinfectants.
Batteries & Mirrors: Silver-oxide batteries (hearing aids); reflective coatings for lasers, telescopes, and heat management.
Medical Applications
Antimicrobial Action: Silver ions kill bacteria, viruses, fungi; used in wound dressings, catheters, bandages, and medical equipment coatings to prevent infections.
Topical Treatments: Silver sulfadiazine cream for burns; nanoparticles in textiles and implants.
Imaging & Diagnostics: Silver halide in X-rays and medical films.
Silver's industrial demand hit 680M oz in 2024 (59% of total), growing with green tech and electronics.
silver to the moon.
#silver #xag #metal

Why GOLD could top in 2026, how low can it go and when reclaimsI was looking at GOLD's RSI and started placing the dates from the starting peak of RSI above 70, noting how long it stayed there and how it repriced after that period ended. Thanks to this, I was able to recognize some seasonality that might occur again and a correction related to it, stay with me, it can be helpful to place a trade once requirements are met, but ofc NFA!
Even tho I know macroconditions are good for GOLD this year, I still think price is first and narratives are after. So I cannot skip the fact that this asset has maintained so much time above 70 since March 2024 and since we have not seen the top, We've to start thinking how low the correction will be.
As you can see on the chart, the pattern is definitely more similar to the 2011-2012 period than
the 2020-2022 period of after hitting the top.
In 2011, before GOLD saw the top, it passed 693 days of dancing around the overbought level of RSI since 2009, after that, it had a 18% correction, once it touched ath it waited 392 days until hitting it again.
In 2019, before touching the top, 553 days passed of RSI dancing near the 70 level since 200 and after that, it had an 18% correction, once it touched ath, it waited 574 days to reclaim it.
In 2024, before our current date, we've seen GOLD not only above the 70 level of RSI 679 days, but it has been more time over it and with much more strength than past cycles, ofc I don't know when and what the top will be (I think very close to $5,000), I think once we touch the top we'll see another correction around 18% and then we'll have to wait +390 days to retouch the ath after hitting it.
Why +390 days? Because this cycle looks more similar to the 2011 (first ath) than the others. Also, I looked more in the past, but past cycles didn't meet the requirement of having this interval of days above or dancing around the 70 level of RSI in the weekly chart, those past years like 70-74's or 77-80 have way more days than the recent cycles, the price didn't reclaim ath after hitting it, so I discarded them and ofc there's some bias here since I don't want to analyze those days since I wasn't alive too. But hey, no one knows exactly what will happen, take it as a guide and for help for your own analysis, or to what to expect, no analysis is perfect, so I want to read your comments and expectations too, I know that will be way better!

XAUUSD/GOLD INTRADAY BUY PROJECTION 13.01.26Next Move (Intraday Projection)
📌 Price ipo ~4594 area-la iruku
Expected move:
First dip / retest (black box low side near 4578–4582)
Bounce + break (4598–4605 zone breakout)
Rally up ✅
✅ Entry Zone
🔹 Buy Entry: 4570 – 4575 (Support line / entry mark)
📌 SL: Below 4570 (tight SL)
🎯 Targets
✅ TP1: 4618.652 (blue line)
✅ TP2: 4650 – 4655 (top TP2 zone)
💡 Confirmation rule
🚨 If 4570 breaks & candle close below → bullish plan cancel
Then correction deeper possible.

EUR/USD H1 SELLPrice has pulled back into the 0.618 Fibonacci area and I’m looking to sell from this level.
The trade will be managed with a 2R target. The stop loss will be placed with a 5-pip buffer above the level to allow for normal price fluctuations.
Once price reaches the 0 Fibonacci level, the position will be moved to break-even, making the trade risk-free.
If price holds above the area, the setup will be invalid.

GBPNZD H1 | Bearish Reversal SetupBased on the H1 chart analysis, we could see the price rise to our sell entry, which is a pullback resistance.
Our stop loss is set at 2.3390, which is a pullback resistance.
Our take profit is set at 2.3280, which is an overlap support that is slightly below the 100% Fibonacci projection.
High Risk Investment Warning
Stratos Markets Limited (

SILVER XAGUSD SILVER IS HEADING TO 100$
if we dont pullback for correction demand will continue to exceed supply pushing price to the moon.
what is silver
Silver is a chemical element (symbol Ag, atomic number 47) with the highest electrical and thermal conductivity of any metal, exceptional reflectivity, and potent antibacterial properties, making it invaluable beyond jewelry and investment.
Industrial Applications
Electronics: Unrivaled conductivity drives use in printed circuit boards (PCBs), semiconductors, switches, contacts, RFID chips, and flexible screens; consumes ~1/3 of global silver demand.
Solar Photovoltaics: Critical in photovoltaic cells (20g per panel); silver paste conducts electricity efficiently, powering renewable energy growth.
Automotive/EVs: Electrical systems, batteries, connectors, and sensors in electric vehicles; rising EV adoption boosts demand.
Catalysis: Produces ethylene oxide (plastics/antifreeze), formaldehyde, and disinfectants.
Batteries & Mirrors: Silver-oxide batteries (hearing aids); reflective coatings for lasers, telescopes, and heat management.
Medical Applications
Antimicrobial Action: Silver ions kill bacteria, viruses, fungi; used in wound dressings, catheters, bandages, and medical equipment coatings to prevent infections.
Topical Treatments: Silver sulfadiazine cream for burns; nanoparticles in textiles and implants.
Imaging & Diagnostics: Silver halide in X-rays and medical films.
Silver's industrial demand hit 680M oz in 2024 (59% of total), growing with green tech and electronics.
silver to the moon.
#silver #xag #metal

Silver: short term bullish, short term support at $82.6Par SAR: buy
EMA cross: buy
Supertrend: buy
Stoch RSI: buy
MACD: buy
Fundamentals are strong

EURUSD – 4H Trendline AnalysisEURUSD – 4H Trendline Analysis
Market Structure
The 4H structure remains bearish.
Price is trading below the main descending green trendline, confirming bearish control.
The recent upside attempt failed, forming a lower high, which keeps the bearish structure intact.
Key Resistance
1.18820 is a major horizontal resistance.
This level aligns with higher-timeframe structure and previous supply.
Any bullish movement toward this zone is considered corrective, not a trend reversal.
Bullish Scenario (Corrective Only)
A short-term pullback is possible.
Price may move upward to retest the descending trendline.
Extension toward 1.18820 is possible only as a correction.
No bullish bias unless price closes and holds above the green trendline on 4H.
Bearish Scenario (Primary Bias)
Rejection from the descending trendline keeps the trend bearish.
Failure to break and hold above resistance will likely lead to:
Continuation toward previous lows
Further downside acceleration if momentum increases
Confirmation Rules
No buys below the green trendline.
Sell setups are valid only after rejection or confirmed continuation.
Trend change requires a confirmed 4H close above resistance, followed by acceptance.
Conclusion
Bias remains bearish.
Any upside is corrective until structure is broken.
1.18820 is the decisive level.
— Avo.Trades

JPN225 H4 | Falling Towards 50% Fib SupportBased on the H4 chart analysis, we could see the price fall to our buy entry level at 52,644.64, which is a pullback support that aligns with the 50% Fibonacci retracement.
Our stop loss is set at 51,445.98, which is an overlap support that aligns with the 50% Fibonacci retracement.
Our take profit is set at 54,268.16, which is a pullback resistance.
High Risk Investment Warning
Stratos Markets Limited (

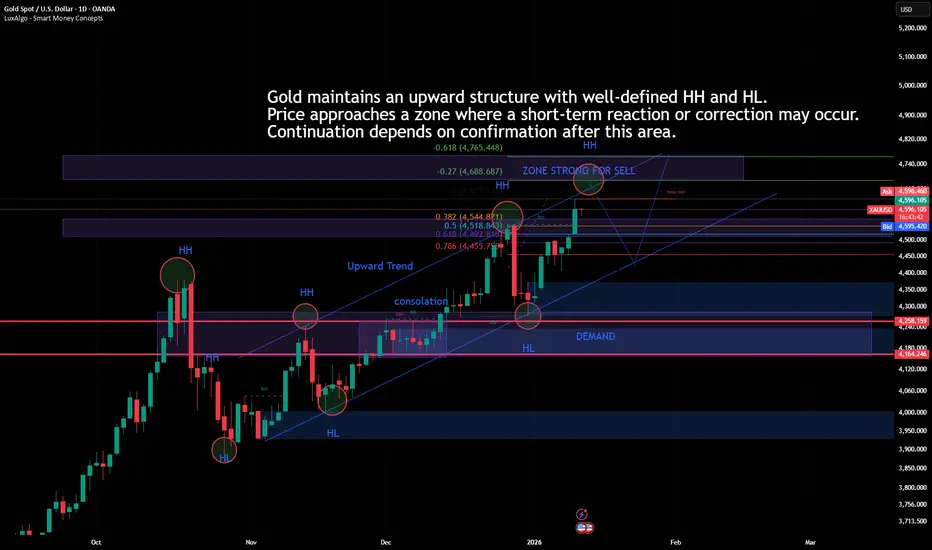
XAUUSD – Active uptrend, possible correction before continuationGold maintains a clearly bullish structure, with ascending tops and bottoms (HH/HL).
The price is now approaching a zone where historically reactions have occurred, which could generate a short-term correction or consolidation.
As long as the main structure remains intact, the bias continues to be towards continued upward movement after this reaction phase.
Confirmation of the next move depends on whether the price response reinforces this area or not.
ZKP/USDT – This Accumulation Could Be the Next Big BouncePrice has been bleeding inside a clear downtrend, but the momentum is now slowing down. We are seeing strong accumulation at the base, right after price tapped the demand zone and reacted sharply.
The descending trendline is being pressured, and any sustained hold above this area increases the probability of a trend reversal rally. This is the type of zone where smart money typically builds positions before expansion.
If price continues to respect the accumulation base, the path toward higher liquidity becomes very clear.
Entry Zone: Current price area
Stop Loss: 0.1272
Target 1: 0.15427
Target 2: 0.17220
As long as the base holds, the bullish scenario remains valid.
Failure to hold the base invalidates the setup.

usdjpy swingA USD/JPY swing buy makes sense due to strong bullish technical signals—RSI ~66, MACD positive, and 11 of 12 moving averages indicating “buy” across multiple timeframes. Additionally, widening Fed‑BoJ interest rate differentials support further dollar strength, reinforcing a medium‑term uptrend
