GBPCAD breakout zone retest? The GBPCAD remains in a bullish trend, with recent price action showing signs of a breakout within the broader uptrend.
Support Zone: 1.8545 – a key level from previous consolidation. Price is currently testing or approaching this level.
A bullish rebound from 1.8545 would confirm ongoing upside momentum, with potential targets at:
1.8690 – initial resistance
1.8750 – psychological and structural level
1.8810 – extended resistance on the longer-term chart
Bearish Scenario:
A confirmed break and daily close below 1.8545 would weaken the bullish outlook and suggest deeper downside risk toward:
1.8500 – minor support
1.8465 – stronger support and potential demand zone
Outlook:
Bullish bias remains intact while the GBPCAD holds above 1.8545. A sustained break below this level could shift momentum to the downside in the short term.
This communication is for informational purposes only and should not be viewed as any form of recommendation as to a particular course of action or as investment advice. It is not intended as an offer or solicitation for the purchase or sale of any financial instrument or as an official confirmation of any transaction. Opinions, estimates and assumptions expressed herein are made as of the date of this communication and are subject to change without notice. This communication has been prepared based upon information, including market prices, data and other information, believed to be reliable; however, Trade Nation does not warrant its completeness or accuracy. All market prices and market data contained in or attached to this communication are indicative and subject to change without notice.
Chart Patterns

GBPJPY overbought pullback supported at 211.33The GBPJPY remains in a bullish trend, with recent price action showing signs of a corrective pullback within the broader uptrend.
Support Zone: 211.33 – a key level from previous consolidation. Price is currently testing or approaching this level.
A bullish rebound from 211.33 would confirm ongoing upside momentum, with potential targets at:
214.30 – initial resistance
215.00 – psychological and structural level
216.00 – extended resistance on the longer-term chart
Bearish Scenario:
A confirmed break and daily close below 211.33 would weaken the bullish outlook and suggest deeper downside risk toward:
210.60 – minor support
209.53 – stronger support and potential demand zone
Outlook:
Bullish bias remains intact while the GBPJPY holds above 211.33. A sustained break below this level could shift momentum to the downside in the short term.
This communication is for informational purposes only and should not be viewed as any form of recommendation as to a particular course of action or as investment advice. It is not intended as an offer or solicitation for the purchase or sale of any financial instrument or as an official confirmation of any transaction. Opinions, estimates and assumptions expressed herein are made as of the date of this communication and are subject to change without notice. This communication has been prepared based upon information, including market prices, data and other information, believed to be reliable; however, Trade Nation does not warrant its completeness or accuracy. All market prices and market data contained in or attached to this communication are indicative and subject to change without notice.

EURUSD On The Rise! BUY!
My dear friends,
EURUSD looks like it will make a good move, and here are the details:
The market is trading on 1.1605 pivot level.
Bias - Bullish
Technical Indicators: Supper Trend generates a clear long signal while Pivot Point HL is currently determining the overall Bullish trend of the market.
Goal - 1.1636
About Used Indicators:
Pivot points are a great way to identify areas of support and resistance, but they work best when combined with other kinds of technical analysis
Disclosure: I am part of Trade Nation's Influencer program and receive a monthly fee for using their TradingView charts in my analysis.
———————————
WISH YOU ALL LUCK

USD/JPY: Bullish Trend ContinuesThere is a strong likelihood that 📈USDJPY will continue its upward trend following a retest of a recently breached horizontal resistance level.
We observe a confirmed breakout of a neckline of an ascending triangle pattern.
We anticipate a minimum appreciation to 159.00.

Copper - Like It?How to structure a trade in Copper. I examine, risk and money management as well as trend ideas.

BTCUSD Liquidity Regime — Context Before SignalsMost traders aren’t losing because of bad entries.
They’re losing because they don’t know what market they’re in.
This chart doesn’t predict price.
It shows context.
Before asking buy or sell, ask:
Is price being accepted… or absorbed?
No signals.
No hype.
Just liquidity, regime, and traps.
Context first. Execution second.

NZDUSD Trading Opportunity! BUY!
My dear friends,
My technical analysis for NZDUSD is below:
The market is trading on 0.5737 pivot level.
Bias - Bullish
Technical Indicators: Both Super Trend & Pivot HL indicate a highly probable Bullish continuation.
Target - 0.5743
Recommended Stop Loss - 0.5733
About Used Indicators:
A pivot point is a technical analysis indicator, or calculations, used to determine the overall trend of the market over different time frames.
Disclosure: I am part of Trade Nation's Influencer program and receive a monthly fee for using their TradingView charts in my analysis.
———————————
WISH YOU ALL LUCK

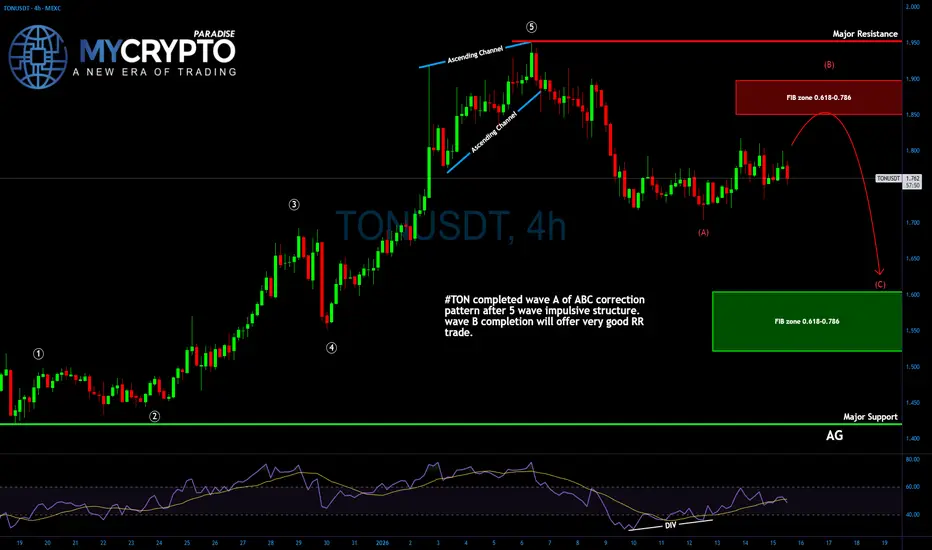
#TON’s Next Move Could Wipe Out Late Bulls – Are You Exposed?
Yello, Paradisers! Are you positioning yourself correctly, or is #TON about to pull a classic fakeout and leave you stuck on the wrong side? What looks like strength to the average trader might actually be the perfect setup for a calculated correction. If you’ve been with us for a while, you know these are the moments that separate pros from gamblers.
💎#TONUSDT has just completed its A wave of the ABC corrective pattern after delivering a clean and aggressive 5-wave impulsive rally. Now, the asset is entering its B wave, and this next phase is where calculated traders thrive. These corrective structures often offer some of the best risk-reward setups—if approached with discipline and proper structure.
💎The top of the fifth wave now stands as a key resistance area. If price breaks through this level with conviction, it will invalidate the current short bias and suggest a broader bullish continuation. On the other side, the $1.420 support level becomes the critical invalidation point for the bullish outlook. If that level fails, bulls need to step aside, and a deeper leg down becomes likely. This is not the time to trade emotionally. It’s the time to stalk the chart like a sniper—waiting for price to come to your area, not the other way around.
💎For now, the Fibonacci zone between $1.850 and $1.900 is emerging as an ideal region to consider as Resistance zone for active trader, especially with clear structure and confluence at that level. Likewise, the $1.600–$1.500 area presents a high-quality support zone if market provide the right reaction. These are the zones where real trading happens—not in the middle of the chart where noise reigns and risk is undefined.
💎It’s also important to remember that we are currently in a corrective move, not an impulsive one. That means exit strategies must be conservative. There is no room for greed here. The priority must be capital preservation, not oversized expectations. Take what the market gives and be ready to move on to the next setup with your capital intact.
But it never is, and never will be a free ride. Make sure you play it smart, Paradisers; the next 6–9 months will be juicy for some and painful for others. Discipline, patience, robust strategies, and trading tactics are the only ways you can make it long-term in this market.
MyCryptoParadise
iFeel the success🌴
FEDFINA Breaking All Time High#FEDFINA
- Breaking ATH
- High Volume
- Entry can be made after pause candle on Daily TF
or
- pull back on hourly TF

Gold (XAU/USD) – Professional Buy Setup Trade Idea: Long (Buy)Gold (XAU/USD) – Professional Buy Setup Trade Idea: Long (Buy)
Entry Zone: Around $4,602 (key horizontal support level)
Rationale:
Price has reached a well-defined support zone (gray area on chart) after a prior pullback, coinciding with signs of bullish volume accumulation and a potential reversal structure (noted Choch earlier in the session). This level has previously acted as a floor, and current price action shows early signs of absorption and buyer interest, increasing the probability of a bounce toward resistance overhead. Targets (conservative to extended): TP1: $4,628 (next minor resistance / blue line)
TP2: $4,637 (upper resistance cluster)
TP3: $4,640+ (breakout potential above gray resistance)
Stop Loss: Below $4,591 (below the lower boundary of the support zone for invalidation)Here are some professional chart examples illustrating similar bullish reactions at key support levels with volume confirmation.
Risk Management: Use appropriate position sizing (1-2% risk per trade recommended). Wait for confirmation such as a strong bullish candle or increased buying volume before entry. #Gold #XAUUSD #GoldTrading #TechnicalAnalysis #BuyTheDip #PreciousMetalsThis is NOT financial advice. Trading involves significant risk of loss of capital. Always conduct your own research (DYOR), consider your risk tolerance, and trade responsibly.

ETH - is it time for a correction?ETH is starting to look over-bought.
Price is currently hovering around a strong intersection between the orange supply zone and the upper red trendlines. This is not just any resistance, it’s a zone where momentum has historically cooled off.
As long as this area holds, a bearish correction is expected, with price likely rotating back toward the lower blue trendlines, where buyers previously stepped in.
This doesn’t change the bigger picture... it’s simply a reset within structure.
⚠️ Disclaimer: This is not financial advice. Always do your own research and manage risk properly.
📚 Stick to your trading plan regarding entries, risk, and management.
Good luck! 🍀
All Strategies Are Good; If Managed Properly!
~Richard Nasr

Sell Signal – Bitcoin (BTC/USD)Current PriceSell Signal – Bitcoin (BTC/USD)Current Price (approx. from chart): ~$96,769
Entry Zone for Sell/Short: Around $97,000 – $98,330 (strong resistance area highlighted in gray on the chart, multiple rejections visible + recent highs testing this zone) Rationale:
Bitcoin has approached this major resistance cluster multiple times (notably the $98,100–$98,330 level), showing clear rejection with wicks and pullbacks. The chart displays a blue arrow pointing downward from this zone, indicating potential reversal or correction after failing to break higher decisively. Recent price action shows consolidation below this barrier amid the uptrend, with profit-taking likely at this strong overhead supply. Targets (potential downside): First target: $96,400 (near dotted support)
Main target: $94,968 (green support level)
Extended target: $93,937 (lower gray zone)
Stop Loss: Above $98,600 (to invalidate if breakout occurs) Looking for selling/short opportunities from this strong resistance zone – watch for confirmation like rejection candles or volume fade at highs. #Bitcoin #BTC #CryptoTrading #BTCSignal #SellTheResistance #TradingView This is NOT financial advice. Trading cryptocurrencies involves high risk of loss. Always do your own research (DYOR) and trade at your own risk. Past performance is not indicative of future results. I'm just sharing my chart observation!

USDJPY 30-Min — Volume Buy Reversal Triggered⚡Base : Hanzo Trading Alpha Algorithm
The algorithm calculates volatility displacement vs liquidity recovery, identifying where probability meets imbalance.
It trades only where precision, volume, and manipulation intersect —only logic.
Technical Reasons
/ Direction — LONG / Reversal 158.520 Area
☄️Bullish momentum confirmed through strong candle body.
☄️Structure shifted with higher-low near key demand base.
☄️Volume expanding confirms order-flow alignment upward.
☄️Buyers reclaimed imbalance with sustained clean break.
☄️Algorithm detects rising momentum under low liquidity.
⚙️ Hanzo Alpha Trading Protocol
The Alpha Candle defines the day’s real control zone — the first battle of momentum.
From this origin, the Volume Window reveals where the next precision strike begins.
⚙️ Hanzo Volume Window / Map
Window tracked from 10:30 — mapping true market behavior.
POC alignment exposes institutional bias and breakout potential zones.
⚙️ Hanzo Delta Window / Pulse
Delta window monitors real buying vs. selling power behind each move.
Tracks volume aggression to expose who controls the candle — buyers or sellers.
When Delta aligns with Volume Map, momentum becomes undeniable.
yesterday
Note
☄️ we add inner Reversal 4596 : 4599 Area . ( bearish Reversal zone )
and we will Target 4560 Zone

Gold is Flashing a Momentum Signal Never Seen in Modern HistoryThe current financial system is broken
Gold TVC:XAU RSI monthly level (93.9) hasn't been seen in modern history
In the last 50 years gold wasn't in such an overbought territory
Technically, this never happened before

GBPUSD - From Bullish to Bearish, keeping it simpleGBPUSD has shifted gears.
After losing its bullish structure, price is now trading inside a falling red channel, keeping the broader bias bearish.
As GBPUSD retests the upper bound of the falling channel, and that retest lines up perfectly with the orange supply zone. This is a classic area where sellers tend to step back in.
As long as this intersection holds, the plan is simple:
wait for lower timeframe confirmation and look for trend-following short setups, aiming for continuation back toward the lower side of the channel.
⚠️ Disclaimer: This is not financial advice. Always do your own research and manage risk properly.
📚 Stick to your trading plan regarding entries, risk, and management.
Good luck! 🍀
All Strategies Are Good; If Managed Properly!
~Richard Nasr

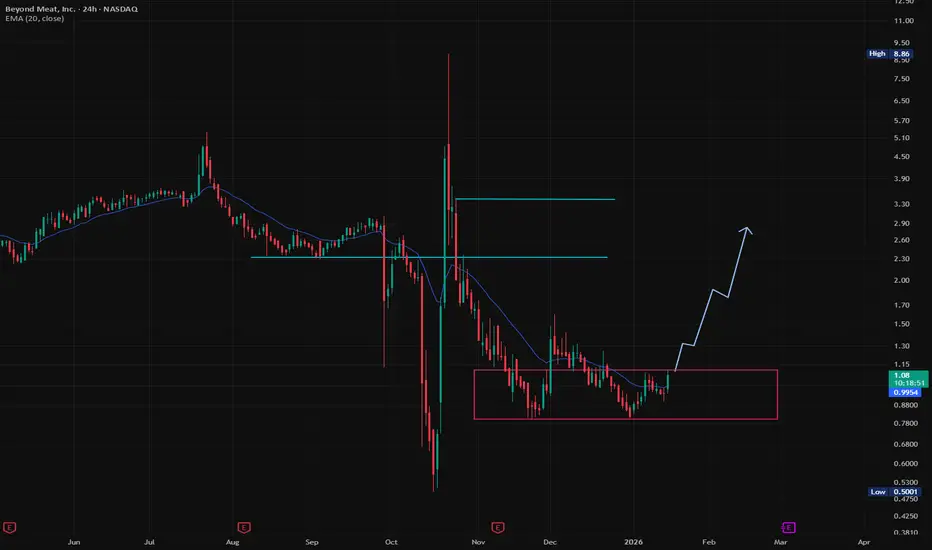
$BYND is set to launch the Immerse Protein Drink — will this finNASDAQ:BYND is set to launch the Immerse Protein Drink — will this finally trigger the short squeeze?
Well… not without me, so I’ve bought some again 😀
Jokes aside, I also like the chart setup. A triple bottom right at the lower end of the range is generally a solid buy zone from a risk–reward perspective.
All we need is some volume to ignite the short squeeze. Probability is not the highest but the reward certainly is!
XMR: Privacy King Breaks Cycle Highs as Zcash Implodes, Targetin📊 Overview
Monero just pulled off one of the most dramatic moves of 2026, surging over 60% in a single week to break $700 and hit new cycle highs. The catalyst? Zcash's Electric Coin Company team departed on January 7 after a governance dispute, triggering aggressive capital rotation from ZEC into XMR. Legendary trader Peter Brandt publicly bought XMR, comparing the setup to silver's historic breakout pattern.
---
🔒 What the Data Shows
- ECC team departed Zcash on Jan 7, 2026, triggering immediate ZEC to XMR rotation
- Peter Brandt announced XMR purchase, cited silver-like breakout pattern
- Dubai DFSA prohibited privacy tokens on Jan 12, yet XMR hit cycle highs same day
- Trading volume surged significantly from December averages
- XMR has risen multiples from post-Binance delisting lows (Feb 2024)
---
📈 Technical Setup
Resistance: $750 (psychological), $800 (round number), $1,000 (major target)
Support: $601 (breakout level), $560 (previous resistance turned support), $480 (20-day MA)
XMR broke decisively above the $500 to $550 range that capped price action for years. The move accelerated after the Zcash governance crisis, with volume confirming the breakout. Peter Brandt's silver comparison is notable: silver spent years consolidating before exploding higher, and XMR shows similar characteristics.
---
🎯 Trade Idea
Bias: Long on pullback
Entry Zone: $600 to $650 (breakout retest)
Target 1: $750 (psychological resistance)
Target 2: $800 (round number)
Target 3: $1,000 (major psychological level)
Stop Loss: $475 (below 20-day MA at $480)
Risk/Reward: Approximately 2.5:1 to first target from $625 entry
Note: After a 60%+ weekly move, chasing is risky. Patience for a pullback to the breakout zone offers better risk/reward.
---
⚠️ Risks to Consider
- RSI overbought after 60%+ weekly surge, pullback risk elevated
- Regulatory crackdown: DFSA just banned privacy tokens, more jurisdictions may follow
- Limited exchange access: Binance delisted XMR in Feb 2024, fewer liquid venues
- FOMO-driven rally: Sharp moves can reverse sharply, position sizing critical
- Privacy coins face ongoing delisting pressure from major exchanges
---
📅 Catalysts
- Zcash governance uncertainty continues (potential further ZEC to XMR rotation)
- EU DAC8 directive expanding crypto reporting (drives privacy demand)
- Global KYC tightening (paradoxically bullish for privacy coins)
- Peter Brandt's endorsement bringing mainstream trader attention
---
💡 Conclusion
XMR's breakout comes at a pivotal moment for the privacy sector. The Zcash governance crisis created the catalyst, and capital is rotating into the established leader. Peter Brandt's silver comparison suggests potential for a sustained move if the pattern plays out. However, after such a sharp weekly gain, the smart play is patience. Let price come to you at the $600 to $650 breakout retest zone rather than chasing extended levels.
---
⚠️ Disclaimer
This is not financial advice. Monero faces significant regulatory risks including exchange delistings and potential bans. Always do your own research and manage your risk appropriately. Never invest more than you can afford to lose.


EURUSD — Case for a Reclaim of 1.1630 (Corrective, Not Reversal)FX_IDC:EURUSD
Bias: Short-term bullish reclaim
Nature: Corrective pullback inside dominant downtrend
Key Level: 1.1630–1.1640
1. STRUCTURAL CONTEXT (WHERE WE ARE IN THE CHANNEL)
Zooming out mentally, price is currently:
Sitting between the lower macro channel (red/orange)
And the descending mid-channel (cyan)
This is no man’s land, where price does not trend — it rebounds.
📌 Critical insight:
After a hard impulsive sell-off (which just occurred), price statistically seeks:
Balance
Mean reversion
Prior structure interaction
That balance point is not higher highs — it is the broken shelf at 1.1630.
2. SELL-SIDE EXHAUSTION (WHY PRICE CAN LIFT)
The move into ~1.1600 was:
Fast
Vertical
Low-pullback
Stop-driven
That type of move burns sellers, not builds new ones.
🧠 Smart money behavior:
Shorts take profit at channel floor
New sellers wait for better prices
Price lifts not because of buying conviction, but because selling pressure pauses
➡️ That pause creates space for a reclaim
3. THE 1.1630 LEVEL IS NOT RESISTANCE — IT’S UNRESOLVED BUSINESS
Why 1.1630 matters:
Prior consolidation shelf
Breakdown origin
Volume node / balance point
Intersection with cyan descending mean
Markets retest what they break unless continuation is immediate.
Continuation was already delivered → now comes the check-back.
📌 This is classic break → extend → retest behavior.
4. TRENDLINE CONFLUENCE (WHY 1.163 IS THE MAXIMUM)
Your chart shows:
Cyan descending mean (dynamic resistance)
Yellow rising corrective line above (NOT reachable yet)
Lower channel already tagged
This creates a ceiling zone, not a breakout zone.
🧭 Translation:
Price can reclaim 1.163
It will likely stall between 1.163–1.165
Acceptance above that would be required for any bullish argument (unlikely)
So your idea is precision-correct, not overly bullish.
5. ORDER FLOW LOGIC (WHO BENEFITS FROM A RECLAIM)
A reclaim to 1.1630 accomplishes three things:
Allows shorts to reload higher
Traps late buyers who think “reversal”
Resets momentum oscillators without breaking structure
This is how trends continue — not by falling nonstop, but by breathing.
6. FUNDAMENTAL ALIGNMENT (WHY IT CAN HAPPEN WITHOUT NEWS)
A reclaim does not require bullish euro news.
It only requires:
No fresh USD shock
Positioning normalization
Intra-week rebalancing
In fact, quiet fundamentals favor corrective lifts, because nothing interrupts mean reversion.
📌 Strong trends often correct on low-news periods, not high-impact ones.
7. EXPECTED PRICE PATH (WHAT IT SHOULD LOOK LIKE)
Healthy reclaim characteristics:
Slower candles up
Overlapping structure
Wicks into 1.163–1.164
No impulsive breakout
Unhealthy (invalid) reclaim:
Vertical green candles
Acceptance above 1.166
Strong closes above cyan line
If that happens → thesis changes.
Right now → reclaim is logical, limited, and technical.

GU Idea UK economic growth surprised on the upside in November, with real GDP rising 0.3% month-on-month, led by gains in services and manufacturing despite continued weakness in construction, BBH FX analysts report.
BOE rate cuts priced in as policy room remains
"UK economic growth overshot expectations in November. Real GDP rose 0.3% m/m (consensus: 0.1%) vs. -0.1% in October, driven by services and production. Services output increased 0.3% m/m vs. -0.3% in October while production output increased 1.1% m/m vs. 1.3% in October on a solid pick-up in manufacturing activity. The construction sector remains a drag on the economy falling -1.3% m/m following a decline of -1.2% in October."

GOLD— SMC Explained | Accumulation → Manipulation → DistributionThis Gold (XAUUSD) analysis is a complete Smart Money cycle breakdown, not a random buy/sell idea.
Every zone, label, and projection on this chart is built with intent, logic, and patience.
Let’s break down what price is really doing 👇
🔹 1️⃣ Accumulation Phase
Price first entered a tight range where smart money quietly built positions.
Retail traders see “consolidation” — institutions see inventory building.
Notice how liquidity was resting on both sides during this phase.
🔹 2️⃣ Manipulation Phase
After accumulation, price made a false move designed to trap breakout traders and trigger stop losses.
This move is not random — it exists only to engineer liquidity.
➡️ Weak hands are forced out
➡️ Liquidity is collected
➡️ Smart money prepares for expansion
🔹 3️⃣ Distribution Phase
Once liquidity was taken, price expanded aggressively into the distribution zone.
This is where late buyers enter emotionally — and smart money begins to offload positions.
Multiple SSS (Sell-Side Liquidity) levels above confirm where price is being drawn next.
🔹 4️⃣ Liquidity Pool & OB Reaction
After the distribution, price retraced toward a clear liquidity pool, aligning perfectly with a valid Order Block.
This zone is not chosen randomly — it’s where unfilled orders + inefficiency exist.
The marked Entry Zone is based on: • Liquidity draw
• OB mitigation
• Smart money re-entry logic
🔹 5️⃣ Projection Logic
The projected path shows engineered pullbacks, not straight-line movement.
Markets don’t move to be fair — they move to rebalance and seek liquidity.
This roadmap is a framework, not financial advice.
🧠 Final Thoughts
If you trade without understanding: • Where liquidity sits
• Who is trapped
• Who benefits from the move
Then you’re reacting — not trading.
This idea took serious time, screen work, and precision, and it represents how I personally read the market.
💬 ENGAGEMENT (Very Important)
👉 Do you agree with this Smart Money cycle?
👉 Which phase do you think Gold is currently in?
👉 Drop your bias or mark-ups in the comments — let’s learn together.
If this breakdown added value, LIKE & SHARE so more traders can see how institutions truly move price.

$CRWV — Statistically there is a ~70% probability that CoreWeaveNASDAQ:CRWV — still holding the full long position.
Statistically there is a ~70% probability that CoreWeave price eventually reaches the opposite side of the channel. Why?⬇️
When you draw a parallel channel and price overshoots the lower boundary , then forms a double bottom (or a double top when shorting an overshoot of the upper channel), history shows a strong tendency for price to travel to the other side of the channel over time.
This isn’t market-specific or timeframe-specific. Test it yourself across different markets and timeframes. Once you’ve logged ~30 examples, you’ll notice the hit rate clustering close to 70%. It will be very beneficial for your trading confidence.
If you have questions, feel free to reply to this post.
Please don’t DM — I end up answering the same questions repeatedly.

USDJPY outlook (15 Jan 2026)The USD/JPY 4-hour chart indicates a strong bullish momentum, with buyers taking control after a consolidation phase.
The recent candle closed with a solid bullish structure, suggesting continued upward pressure.
The price is currently trading around 158.77, with a projected target take-profit level near 159.34, while the stop-loss is positioned at 158.09 to manage downside risk.
This movement reflects a strong U.S. Dollar (USD) against a weak Japanese Yen (JPY), consistent with the broader macroeconomic trend of USD strength driven by higher U.S. interest rates and resilient economic data, while the Yen remains under pressure due to Japan’s ultra-loose monetary policy.
If bullish momentum persists, the pair could test the 159.34 resistance zone, signaling further Yen weakness.
