#NEAR, can it retest the support zone?📊#NEAR, can it retest the support zone?
🧠From a structural perspective, a pullback after encountering overlapping resistance zones is reasonable. If it can retest the lower yellow support zone, this would be a good buying opportunity.
➡️If there is no pullback, then after it breaks above the S/R, look for stabilizing buying opportunities.
🤜If you like my analysis, please like💖 and share💬
BINANCE:NEARUSDT.P
Chart Patterns
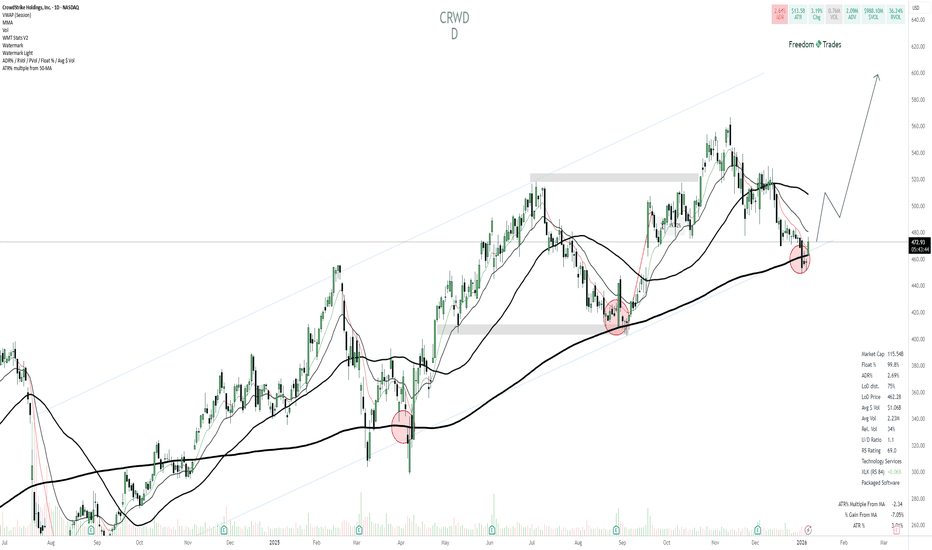
CRWD Bullish ThesisCRWD is still in a primary uptrend (rising structure / channel), and the recent selloff looks like a pullback within that trend, not a full trend break.
Price is now tagging a high-confluence support area: rising trendline + major moving average support (thick MA) + prior demand zone (the same “dip buy” area that worked earlier on the chart).
The current location is attractive because risk is clearly defined: you’re buying at support, not chasing extension.
Thesis: This is a higher-timeframe pullback to trend support that can trigger a mean-reversion move back into the prior supply zone, then potentially continuation to new highs.
What would confirm: a reclaim/hold back above the short-term MAs (10/21) and especially a push back above the ~490–500 area with improving volume/price action.
Buy zone: the current support pocket ~455–475 (trendline + MA confluence), ideally on a tight reversal or strong reclaim day.
Invalidation: a decisive breakdown below ~450 (losing the confluence support and shifting the structure bearish).
Targets (supply zones):
T1: ~500–520 (first overhead supply / MA cluster area)
T2: ~545–565 (prior swing area)
Stretch: ~590–610 (upper channel / projected continuation zone)
CRWD is a buy-the-dip candidate because it’s pulling back into major trend support, where the downside is definable and the upside is a reversion back toward 500–520 first, then higher if the trend resumes.
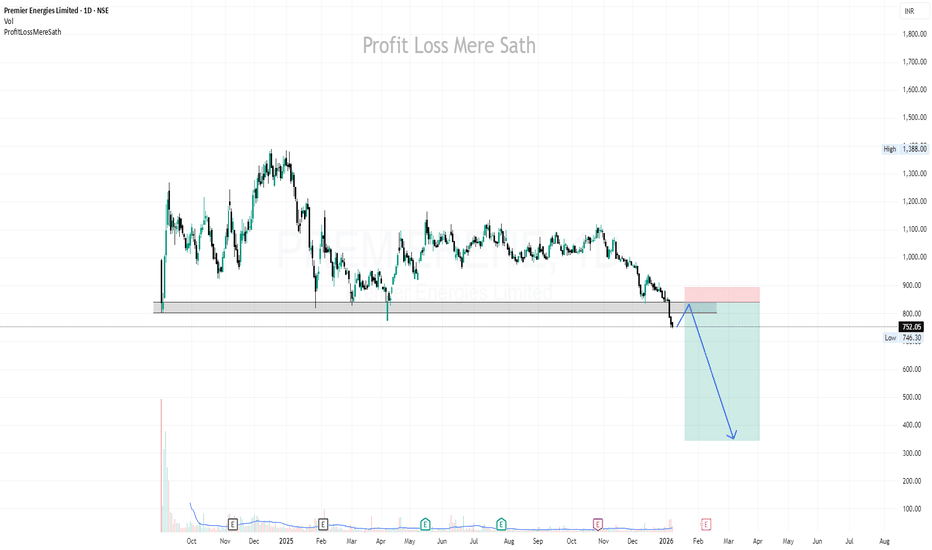
PREMIERENE | Short @841 | SL above 490 | Target 345**************************************************************************
Disclaimer (Please Read Carefully):
This is not investment advice. The stocks shared here are purely for educational and informational purposes. Please do your own research or consult with a financial advisor before making any investment decisions.
******************************************************************************************************************
Stock market में सिर्फ risk ही risk होता है। Market में survive करने का एक ही तरीका है, stop loss को पूरी discipline के साथ accept करना। अपनी capital को protect करने का इससे बेहतर कोई तरीका नहीं है।
मैं जो भी stock यहाँ शेयर करता हूँ, वो या तो मेरी existing holding में होता है, या फिर मैं उसी level पर fresh buying या add on करता हूँ जिसे मैं mention करता हूँ।
मैं हमेशा buy करते समय अपने system में stop loss ज़रूर लगा देता हूँ, और मेरे लिए stop loss, target से भी ज़्यादा important होता है।
Target achieve होने के बाद मैं पहले profit book करता हूँ और फिर retest या fresh breakout का इंतज़ार करता हूँ।
मैं सिर्फ breakouts पर buy करता हूँ, कभी भी support पर नहीं। और मैं resistance पर sell भी नहीं करता।
******************************************************************************************************************
The stock market involves risk, risk, and only risk. To survive in the market, accepting stop-loss with discipline and without hesitation. There is no other way to protect you capital.
Any stock I share is either already part of my existing holding or I take a fresh entry at the same level I mention. I always place the stop-loss in my system at the time of buying, and I give the highest importance to stop-loss more than the target. Once the target is achieved, I usually book profit once and then wait for either a retest or a fresh breakout.
I buy only on breakouts, never on supports. I also do not sell at resistance levels.
That is simply my trading style.
USD/JPY | Medium-Term Uptrend PotentialThe price is currently trading at 156.47, attempting to break through the upper boundary of your zone at 156.71.
However, the recent weak US service sector (ISM) and job openings (JOLTS) data released tonight is putting pressure on the dollar, supporting your bearish scenario.
⚡ Execution Scenario
Bearish Confirmation (Primary Entry): As per your plan, wait for the 4-Hour (4H) candle to close below 155.74. This will confirm that sellers have taken full control.
- TP 1: 154.34
- TP 2: 153.18
⚡Final Target: 152.40 (strong liquidity area).
Correction Scenario (Caution): If the price rebounds and stabilizes above 156.71, this short-term bearish structure will be invalidated, and USD/JPY could retest the 158.00 level.
XAGUSD — Bullish AlignmentThis chart shows silver transitioning into a constructive bullish phase following a period of consolidation and corrective price action. Price has reclaimed key daily structure and is now holding above short-term averages, indicating improving directional alignment.
Recent candles display renewed upside participation, with price stabilizing after prior volatility rather than rejecting sharply. Multiple upside target interactions (“HITs”) suggest active engagement at higher levels, supporting the idea of acceptance rather than exhaustion.
Key structural observations:
Daily structure has shifted back in favor of buyers, with higher lows developing.
Price is holding above reclaimed reference levels, which now act as short-term support.
No decisive breakdown of structure has occurred despite recent consolidation.
Multi-timeframe context:
Daily, 4H, and weekly reference levels are closely stacked, defining a clear expansion corridor.
Weekly targets remain overhead and may act as attraction zones if momentum continues to build.
Lower reference levels beneath price define the structure that would need to fail to negate the bullish bias.
Momentum context:
Momentum is positioned in a bullish regime, with projected continuation rather than immediate exhaustion.
Projected momentum suggests potential re-acceleration following consolidation.
Momentum cooling would more likely result in range development, not immediate trend failure.
Forward-Looking Scenarios (Probabilistic)
Sustained acceptance above reclaimed daily structure favors continued upside probing toward higher-timeframe targets.
Failure to hold current structure could lead to sideways consolidation or a controlled pullback.
Broader directional clarity is expected as price resolves interaction with weekly reference levels.
All levels shown represent contextual reference points, not guarantees. This chart is provided for educational and informational purposes only and should be confirmed using additional tools, timeframes, and appropriate risk management.
PfePfizer is forming a bullish Inverse Head & Shoulders pattern, signaling a potential trend reversal after a prolonged downtrend. Price has broken above the neckline near $25.40–25.50, supported by a rising uptrend line, which adds confirmation to the bullish setup.
Entry: ~$25.47 (on breakout/close above neckline)
Stop Loss: ~$23.00 (below right shoulder & structure support)
Target: ~$30.00 (measured move from the pattern)
Outlook: As long as price holds above the neckline and uptrend, bullish momentum remains valid. A daily close below $23 would invalidate the setup.
Where is the support for #BTC?📊Where is the support for #BTC?
🧠From a structural perspective, our pullback after being resisted by the blue resistance zone is quite reasonable. Next, we need to focus on the S/R level around 90,000 and the support level around 88,000.
➡️The strongest resistance at 98,000 remains worth our attention.
Let's see 👀
🤜If you like my analysis, please like 💖 and share 💬
BITGET:BTCUSDT.P
Recent Movers – Pullback ExamplesRecent session showed several short-term momentum opportunities. The watchlist was created based on a normalized condition: stocks that made a 52-week high within the last three months. From this scan multiple names were selected with focus on viable pullback trades.
A pullback is a short-term counter-move in response to an impulse move. It represents a controlled reversion toward the mean and provides a structured way to participate if momentum resumes.
There is a pullback indicator is shown on the charts as a visual reference. It shows when price moves outside recent behavior and marks the subsequent reversion. The indicator was not made for entries, but for standardization and consistent evaluation.
Example Charts:
ADI
CPRI
CTRI
SOLV
RF
PFG
NTRS
More than 35 percent of the current watchlist is concentrated in the financial sector. This was also visible through sector relative strength over the past month, led by XLB (Materials) and XLF (Financials). This view can support a top-down perspective but is not required.
EURUSD Under Pressure as Market Eyes Lower Demand ZoneEURUSD is currently trading around the 1.16900 level, moving within a defined short-term range. On the downside, the 1.16728 zone is acting as an important intraday support, while 1.17428 remains the key resistance area to watch.
From a technical perspective, price action below resistance suggests limited bullish follow-through, and a sustained break below the 1.16728 support could weaken the structure further. In that case, the 1.16200 area — which also aligns with a demand zone — becomes the next level of interest.
On the fundamental side, ongoing concerns around slowing European economic conditions are adding pressure to the euro, which may continue to influence downside momentum in the pair. For now, I’m observing how price behaves around these key levels to better understand whether the current structure extends or stabilizes.
Philip Morris (PM – Daily)
Philip Morris (PM) has completed a strong medium-term uptrend and entered a descending corrective channel.
This move appears to be a healthy structural correction, not a trend reversal.
Key observation:
• Price has broken above the descending channel
• Currently retesting the breakout zone
→ Classic break-and-retest behavior
Key Price Levels
• Key Support:
154 – 156
• Major Support:
148 – 150
• Immediate Resistance:
160 – 162
• Next Resistance:
168 → 172
Bullish Scenario (Primary)
If price:
• Holds above the 154–156 zone
• Shows bullish continuation from the retest
➡️ Corrective phase is complete and trend continuation is likely.
Upside Targets:
160 → 168 → 172
Invalidation / Stop:
Daily close below 148
Bearish / Failed Breakout Scenario
If price:
• Fails to hold above 154
• Falls back inside the descending channel
➡️ A deeper corrective move toward the channel lows becomes likely.
Downside Targets:
148 → 142
Bearish Invalidation:
Strong acceptance above 160
Final Takeaway
PM is transitioning from correction to potential continuation.
Holding above 154 keeps the bullish bias intact.


