EURUSD — Watching the Midline for a Breakout SignalThe euro deserves a spot on this week’s watchlist. For nearly a week now, on the 15-minute timeframe, price has been stuck inside a range and has not been able to properly break and hold above the range midline.
We remain buyers on EURUSD, as the higher timeframe trend is still bullish, and we are looking for long signals.
If price can close above the range midline — preferably with a strong 1-hour candle — it could act as a solid trigger for a long position and potentially lead to a breakout from the top of the range.
However, if the range breaks to the downside, we will need to reassess the structure and carefully evaluate the selling momentum before making any decisions.
#Pouyanfa 🔥
Chart Patterns

NVDA (USA) - NVIDIA "Stuck" Looking for a Direction.I was inspired to post this after seeing a similar idea posted by @Bull-Investor here:
I often think that area / line charts are underutilised. I like how they cut out a lot of the short term noise candlesticks add to the charts so thought I'd post my own after seeing what very much looks like a range bound channel that NVIDIA is currently stuck in.
Earnings not too far off though which might allow it to finally break and run.
Question is which way :)
..................................................
PLEASE NOTE: Nothing I post is trading advice. All investing involves risk, and past performance doesn’t predict future results. Trends can and do end. For 2026, my goal is to try and post one new asset each trading day. Something outside the usual gold, silver, BTC, or big tech names. I like to find stocks worldwide showing steady trends with some good gains, a recent pullback, and signs of renewed strength. I don’t necessarily hold positions in these. They are simply companies I find interesting at the time of posting. I’ll often revisit them within a week to see how they went and share any updates. If you enjoy these posts, please BOOST and FOLLOW ME to discover more under-the-radar stocks and businesses from around the world.
..................................................

Hedera Giving A Multi-Timeframe Showdown, Time To Buy?!COINBASE:HBARUSD in a Multi-Timeframe Analysis is giving some insight and clues that the current Bullish rally may just be beginning! Let's break it down.
- When looking at the Weekly chart, we can see that if we take a Fibonacci Retracement Tool and go from the Low @ .03567 to the High @ .40100, we can see price on COINBASE:HBARUSD makes a Retracement to the 88.6% Fibonacci Level and a 3rd test of the Falling Support which is part of a bigger pattern, the Falling Wedge.
*This Retracement could mean the end of the Bearish decline!
- On the 8Hr chart we can see price has formed an Inverse Head and Shoulders Pattern, a Bullish Reversal pattern that with a valid Breakout and successful Retest of the Neckline can generate Long Opportunities in price!
*Currently price seems to be making a pullback to that Breakout of the Neckline for the Retest!
- Lastly, the Hourly chart shows that the 200 EMA is sitting right in the area of the Neckline which could serve as great Support for price on the decline. It also aligns great with the Break of Structure that happens with the Neckline serving as a great place to Retest!
Fundamentally, FedEx joining the Hedera Governing Council "signaling deeper enterprise integration and expanding institutional credibility for the network", sees serious support coming in for COINBASE:HBARUSD !

#RIVER/USDT Descending channel ?#RIVER
The price is moving within a descending channel on the hourly timeframe. It has reached the lower boundary and is heading towards a breakout, with a retest of the upper boundary expected.
The Relative Strength Index (RSI) is showing a downward trend, approaching the lower boundary, and an upward bounce is anticipated.
There is a key support zone in green at 13.12, and the price has bounced from this level several times. Another bounce is expected.
The indicator is showing a trend towards consolidation above the 100-period moving average, which we are approaching, supporting the upward move.
Entry Price: 13.66
First Target: 14.35
Second Target: 15.29
Third Target: 16.51
Stop Loss: Below the green support zone.
Remember this simple thing: Money management.
For any questions, please leave a comment.
Thank you.

FOR DA BOIS!!!A guide that is similar to the xrp chart. I believe the lows are in keep liquidations below 8c. Build your longs for the long term and join me for the rise to Valhalla!!! The journey has just started and we have a long path ahead of us. I am happy you are all here and am ready for this ADVENTURE!

DOGE next target is 0.1120$ means 15% gains HI
after huge correction to the downside now some green candlesticks for continuing the process or reverse is logical i can see at least 15% gain toward 0.1120$ for doge

Falling towards Fib levels?USD/JPY is falling towards the pivot, which has been identified as an overlap support that aligns with the 61.8% Fibonacci retracement, 127.2% Fibonacci extension, and the 100% Fibonacci extension.
Pivot: 150.75
1st Support: 148.51
1st Resistance: 154.63
Disclaimer:
The opinions given above constitute general market commentary and do not constitute the opinion or advice of IC Markets or any form of personal or investment advice.
Any opinions, news, research, analyses, prices, other information, or links to third-party sites contained on this website are provided on an "as-is" basis, are intended to be informative only, and are not advice, a recommendation, research, a record of our trading prices, an offer of, or solicitation for, a transaction in any financial instrument and thus should not be treated as such. The information provided does not involve any specific investment objectives, financial situation, or needs of any specific person who may receive it. Please be aware that past performance is not a reliable indicator of future performance and/or results. Past performance or forward-looking scenarios based upon the reasonable beliefs of the third-party provider are not a guarantee of future performance. Actual results may differ materially from those anticipated in forward-looking or past performance statements. IC Markets makes no representation or warranty and assumes no liability as to the accuracy or completeness of the information provided, nor any loss arising from any investment based on a recommendation, forecast, or any information supplied by any third party.

GBPUSD 1.3700 is a key pointI think breaking 1.3700 we may see bullish trend,, otherwise the pair will continue bearish trend

XAUUSD LOOKING REALLY BEARISH AFTER AN ALL TIME HIGHGols look like it's changing changing from bullish to bearish. It is at a resistance level that I think it'll push it down again and possibly give us a lower low!!

"COCAINE AND ABEL"After the First Wave
Ginge woke alone in the snow, the clearing split open where his hilt had struck.
The team was gone.
The silence hit harder than the fall.
He sat there for a moment, staring at the cracks he’d made — not just in the ground, but in everything he cared about. He’d spent most of his life sprinting away from the man he didn’t want to be, only to realize he’d run straight into him.
Impatient.
Unkind.
Afraid of loving anything he might lose.
But the echoes from the First Wave still lingered in the air, faint but steady, like a reminder that he didn’t have to die as the same man he’d been born as.
He wasn’t proud of the choices that led him here.
He’d followed his own shadow long enough to forget there was light behind him.
He’d hurt people who didn’t deserve it.
He’d hurt himself even worse.
But none of that meant he had to stay broken.
He pushed himself to his feet, breath shaking but steadying with each exhale. Somewhere out there, the team was scattered — bruised, confused, maybe even doubting him. But they were alive. And he wasn’t done.
Change wasn’t easy.
Change wasn’t quick.
But change was possible.
He tightened his grip on the hilt, not as a weapon, but as a promise.
He would find them.
He would face what he’d done.
He would rebuild what he broke.
Losing them once was enough.
Losing himself again wasn’t an option.
Everything was fine.
Or at least — it would be.
Ginge stepped forward, no longer Cain, not yet Abel, but finally moving in the right direction.

Natural Gas Stock Forecast | Oil | Dollar | Silver | Gold0:00 Weekly Commodities Outlook (Natural Gas, Oil, Dollar, Gold, Silver)
0:26 Natural Gas Forecast (NG) – Key Support & Breakdown Levels PEPPERSTONE:NATGAS
4:48 Crude Oil Technical Analysis (WTI) – Range & Resistance Watch NYMEX:CL1!
7:39 US Dollar Index (DXY) Analysis – Bear Flag or Reversal?
10:15 Gold Price Forecast (XAUUSD) – Blow-Off Top & Key Support COMEX:GC1!
13:45 Silver Price Analysis (XAGUSD) – Relative Weakness vs Gold COMEX:SI1!
17:12 Weekly Summary & Levels to Watch

as the chart says stay patient and only look to sell, keep sl just over last swing high tp under last swing low

ETH PERPETUAL TRADE SELL SETUP Short from $2060ETH PERPETUAL TRADE
SELL SETUP
Short from $2060
Currently $2060
Targeting $1975 or Down
(Trading plan IF ETH
go up to $2130 will add more shorts)
Follow the notes for updates
In the event of an early exit,
this analysis will be updated.
Not a Financial advice

DXY Compression Before the Next Expansion?The arrows highlight a developing sequence of lower highs with momentum cooling on the 4H, suggesting the recent bounce lacks conviction. Price structure is tightening, volatility is compressing, and the next directional move is likely to be impulsive rather than corrective. If this rhythm continues, the dollar could be preparing for a deeper continuation phase rather than a sustained recovery.
Disclosure: We are part of Trade Nation's Influencer program and receive a monthly fee for using their TradingView charts in our analysis.

Nio looking bullishWell it's been a long wait since my last update on nio, I'm back with an update. Well nio is looking bullish after a successful retest at the 4.3 dollar level. On the the chart there is a watch level and they is my undisputed buy level(purely my buy level) once there is a momentum candle close above that level.
N.B: This is not a financial advice dyor and decide for yourself.
Thank you for viewing my ideas

RECALL BOTTOMED OUT🔥 Fortune AI Radar — CRYPTOCAP:RECALL
Fresh activity detected on CRYPTOCAP:RECALL today.
Data suggests increasing market interest & buyers stepping in.
Technicals currently lean bullish, with momentum trending upward.
Whales showing hints of accumulation and hype rising among trader

AUDCAD Will Fall! Short!
Here is our detailed technical review for AUDCAD.
Time Frame: 1D
Current Trend: Bearish
Sentiment: Overbought (based on 7-period RSI)
Forecast: Bearish
The market is trading around a solid horizontal structure 0.963.
The above observations make me that the market will inevitably achieve 0.942 level.
P.S
The term oversold refers to a condition where an asset has traded lower in price and has the potential for a price bounce.
Overbought refers to market scenarios where the instrument is traded considerably higher than its fair value. Overvaluation is caused by market sentiments when there is positive news.
Like and subscribe and comment my ideas if you enjoy them!

ZEC Bullish ScenarioGiven that **ZEC has broken its bearish CHOCH**, I expect the price to pull back to the channel midline and then form a bullish CHOCH, potentially moving toward the targets I have marked.

DIVGITTS - Inverse H&S BreakoutDIVGITTS :
Inverse Head and shoulder breakout in progress
Need to sustain 765 levels for a strong possible upmove
Breaking 800 can lead take this to 900 levels soon

AXSUSDT Ready to Explode? Channel Break Could Trigger Relief!The Axie Infinity / USDT pair on the 4H timeframe is still within a mid-term downtrend structure after failing to hold the supply area around 2.9 – 3.0 USDT.
Price action continues forming consistent Lower Highs (LH) and Lower Lows (LL), indicating strong seller dominance. Currently, price is consolidating right above a crucial support block following rejection from the main trendline resistance.
---
Structure & Pattern Formation
1. Descending Channel / Falling Wedge Hybrid
Two descending trendlines are visible:
Resistance trendline (red) → connecting LHs.
Support trendline (yellow) → holding LLs.
Structure is tightening → indicates volatility compression.
This type of pattern often results in:
Continuation if breakdown occurs.
Reversal if an upside breakout happens.
2. Support Block Demand Zone
The strong demand area is located at:
1.30 – 1.35 USDT
Key confluence factors:
Previous base before impulsive rally.
Multiple wick rejections.
Volume absorption showing buyer defense.
---
Key Levels
Resistance:
1.54 → Minor resistance / latest rejection.
1.65 → Mid-channel resistance.
1.90 → Horizontal resistance.
2.11 → Supply flip area.
2.65 → Major resistance.
2.94 – 3.00 → Macro supply / swing high.
Support:
1.30 – 1.35 → Major support block.
1.15 → Minor channel support.
0.91 → Extreme low / liquidity target.
---
Bullish Scenario
Bullish confirmation requires:
1. Breakout above the red resistance trendline.
2. Strong candle close above 1.54.
3. Successful retest turning resistance into support.
Upside targets:
1.65
1.90
2.11
2.65
2.94
Additional confirmation:
Volume expansion on breakout.
Bullish RSI divergence (if present).
Market structure shift from LH → HH.
Meaning:
Buyers escape channel pressure and initiate a mid-term reversal phase.
---
Bearish Scenario
Bearish continuation activates if:
1. The 1.30 – 1.35 support block breaks.
2. Candle closes below the demand zone.
3. Retest fails to reclaim the area.
Downside targets:
1.15
1.00 psychological level
0.91 (liquidity sweep zone)
A breakdown would confirm a new Lower Low, continuing the downtrend structure.
---
Conclusion
Primary trend: Bearish (mid-term)
Current position: Above key demand
Structure: Descending channel compression
Potential: Reversal on breakout / Dump on support loss
This is a decision zone.
Price reaction between 1.30 – 1.54 will determine whether AXS:
Starts a relief rally.
Or continues distribution lower.
#AXSUSDT #AXSAnalysis #CryptoTechnicalAnalysis #AltcoinSetup #DescendingChannel #SupportResistance #DemandZone #BreakoutSetup #TradingViewAnalysis #CryptoTrading #AltcoinSeason #PriceAction

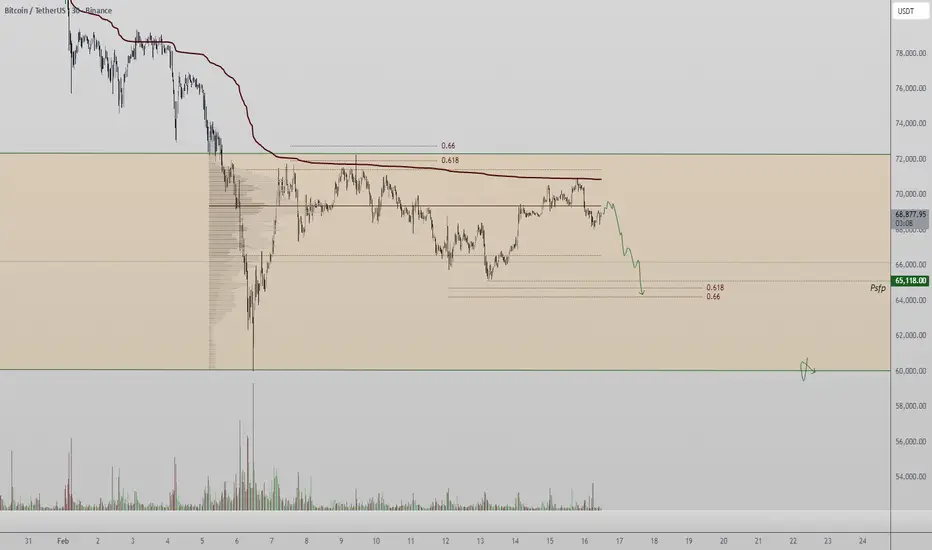
Bitcoin Rejects VWAP as Downside Rotation Risk BuildsBitcoin price action on the daily TradingView analysis continues to show weakness after a corrective rejection from the VWAP resistance. This VWAP level has capped price for an extended period, and the latest rejection reinforces its role as a key supply zone. Following this move, Bitcoin has now lost the point of control, an important technical signal that highlights immediate weakness and a shift away from balance.
From a market structure perspective, acceptance below the point of control suggests sellers are regaining control. As long as this level continues to act as resistance, the probability favors a rotational move lower rather than a sustained recovery. This aligns with broader corrective behavior seen across the market.
The next key downside level comes in at the 0.618 Fibonacci retracement. Notably, there is a clear swing low sitting just above this Fibonacci region, indicating resting liquidity below current price. Markets often gravitate toward these areas to rebalance and clear liquidity, increasing the likelihood of a deeper corrective move.
From a technical and price action perspective, the rejection from VWAP marks a critical inflection point. If Bitcoin remains below the point of control and fails to reclaim VWAP with strong volume, the path of least resistance favors a continuation toward the 0.618 Fibonacci as the next expansion zone.
Terra (LUNA) —Second wave aims at $0.51 (652% profits potential)We have a very dynamic chart here. Resistance being challenged through a major jump, a rejection and lower low/higher low. A volume breakout opens new possibilities... A repeat of early December 2025, a new bullish phase.
Good evening God, how are you feeling today?
Godlike, love like, life like; alive and well. What about you?
The previous move in December ended as a double-top vs May 2025. Then we have this lower low and the start of a new bullish move.
Obviously, LUNAUSDT wasn't strong enough to break resistance so prices move lower to build-up strength. Ok, the retrace is complete so, here we go again.
The dates are the same as with Bitcoin and most of the altcoins: A low 6-February followed by a recovery and then some consolidation, a bullish resumption in the last three days.
The question remains, can Terra (LUNAUSDT) produce a higher high compared to December 2025?
It is possible. The move in December lasted only 9 days, that's a very short time. Most likely just a whale buying made the market jump. If we get a bullish wave now rather than a bullish jump, then a higher high is certainly possible, the most likely scenario.
The target we are aiming for on this chart and pair is $0.51.
Nine days of bullish action gave us a 275% positive move. 1-2 months of bullish action can do many times better. Makes sense? The rest is to wait.
We analyze the data, track the prices and the chart, the market takes care of the rest.
Find the bottom, buy and hold and then, we pray... Amen!
Namaste.

US30 analysisUS30 had a sharp drop then started a bullish bounce from demand.
As long as price holds above 49,360–49,480, upside continuation is likely.
🎯 Targets: 49,900 then 50,300
⚠️ Break below 49,360 may drop to 49,200
