BTCUSD – Bearish Channel Breakdown | Target 66KKey Levels
Major Resistance Zone:
80,700 – 81,000 (previous support → now resistance)
90,300 (upper channel / strong supply)
Current Price: ~78,500
Key Support / Target:
66,200 – 66,500 (channel projection + previous demand)
🔄 Price Scenario
A pullback toward 80.7k is possible (retest of resistance).
If BTC fails to reclaim and hold above 81k, continuation downward is likely.
The projected move aligns with a ~17% downside, targeting 66k.
🧠 Trading Bias
Bias: Bearish continuation
Best Sell Area: 80k–81k (on rejection confirmation)
Invalidation: Daily close above 90.3k (break of channel)
⚠️ Notes
Expect volatility near support.
Confirmation from volume or bearish candles (engulfing / rejection wicks) will strengthen the setup.
Chatpatterns

BTCUSD – Bearish Pullback from Channel Resistance (1HKey Levels on Your Chart
Resistance Zone: 82,900 – 83,500
Price already reacted here
This zone aligns with channel resistance + previous structure
Stop Loss: ~83,600
Above resistance → invalidates the bearish setup
Target Zone: 79,400 – 79,300
Strong demand / liquidity area
Near previous lows
📊 Trade Bias
Primary Bias: BEARISH (Sell on rejection)
Sell Idea:
Entry: From resistance zone (82.9k–83.5k) after bearish confirmation
SL: Above 83.6k
TP: 79.4k / 79.3k
Risk–Reward: Very clean & favorable ✅
🧠 What to Watch Before Entry
Bearish candle confirmation (engulfing / rejection wick)
Weak volume on bullish candles
No strong bullish breakout above 83.6k
⚠️ Invalidation
A strong close above the channel + 83.6k
This would shift bias to short-term bullish / range behavior
📌 Summary
Trend: Bearish
Setup: Pullback sell
Structure: Descending channel
Execution: Wait for confirmation, don’t rush
If you want, I can:

EURUSD Bearish Rejection from Channel Resistance (30M)Key Levels
Resistance / Sell Zone: 1.1970 – 1.1995
Strong horizontal resistance + channel resistance confluence.
Stop Loss: Above 1.2000
A clean break and close above invalidates the short setup.
🔹 Downside Targets
Primary Target: 1.1775 – 1.1760
This aligns with prior demand and projected corrective move.
🔹 Trade Idea
❌ Sell on rejection from the resistance zone
📉 Expect continuation toward lower channel support
✅ Structure favors shorts while below resistance
🔹 Bias
Bearish below 1.2000
This move looks like a corrective pullback within a broader structure, not a trend flip yet.

XAUUSD Bullish Continuation Setup (15M)Support Level Buy Zone: 5,470 – 5,455
Price is currently reacting from this zone.
This area aligns with previous structure support and channel support.
Invalidation / Stop Loss: Below 5,455
A clean break below this level would weaken the bullish setup.
🔹 Upside Targets
Primary Target: 5,845
This aligns with the upper boundary of the ascending channel and projected impulse move.
🔹 Trade Idea (Based on Chart Logic)
✅ Buy on pullbacks within the support buy zone
❌ SL below the marked stop-loss level
🎯 Target toward the upper channel resistance
🔹 Bias
Bullish while above 5,455
Any consolidation above support favors another impulsive move up.

5 IMPOTANT TYPES OF ELLIOTT WAVE PATTERNS !!Hello traders, today we will talk about 5 TYPES OF ELLIOTT WAVE PATTERNS
( FIRST SOME BASIC INFO )
What is Elliott Wave Theory?
The Elliott Wave Theory suggests that stock prices move continuously up and down in the same pattern known as waves that are formed by the traders’ psychology.
The theory holds as these are recurring patterns, the movements of the stock prices can be easily predicted.
Investors can get an insight into ongoing trend dynamics when observing these waves and also helps in deeply analyzing the price movements.
But traders should take note that the interpretation of the Elliot wave is subjective as investors interpret it in different ways.
(KEY TAKEAWAYS)
The Elliott Wave theory is a form of technical analysis that looks for recurrent long-term price patterns related to persistent changes in investor sentiment and psychology.
The theory identifies impulse waves that set up a pattern and corrective waves that oppose the larger trend.
Each set of waves is nested within a larger set of waves that adhere to the same impulse or corrective pattern, which is described as a fractal approach to investing.
Before discussing the patterns, let us discuss Motives and Corrective Waves:
What are Motives and Corrective Waves?
The Elliott Wave can be categorized into Motives and Corrective Waves:
1. Motive Waves:
Motive waves move in the direction of the main trend and consist of 5 waves that are labelled as Wave 1, Wave 2, Wave 3, Wave 4 and Wave 5.
Wave 1, 2 and 3 move in the direction of the main direction whereas Wave 2 and 4 move in the opposite direction.
There are usually two types of Motive Waves- Impulse and Diagonal Waves.
2. Corrective Waves:
Waves that counter the main trend are known as the corrective waves.
Corrective waves are more complex and time-consuming than motive waves. Correction patterns are made up of three waves and are labelled as A, B and C.
The three main types of corrective waves are Zig-Zag, Diagonal and Triangle Waves.
Now let us come to Elliott Wave Patterns:
In the chart I have mentioned 5 main types of Elliott Wave Patterns:
1. Impulse:
2. Diagonal:
3. Zig-Zag:
4. Flat:
5. Triangle:
1. Impulse:
Impulse is the most common motive wave and also easiest to spot in a market.
Like all motive waves, the impulse wave has five sub-waves: three motive waves and two corrective waves which are labelled as a 5-3-5-3-5 structure.
However, the formation of the wave is based on a set of rules.
If any of these rules are violated, then the impulse wave is not formed and we have to re-label the suspected impulse wave.
The three rules for impulse wave formation are:
Wave 2 cannot retrace more than 100% of Wave 1.
Wave 3 can never be the shortest of waves 1, 3, and 5.
Wave 4 can never overlap Wave 1.
The main goal of a motive wave is to move the market and impulse waves are the best at accomplishing this.
2. Diagonal:
Another type of motive wave is the diagonal wave which, like all motive waves, consists of five sub-waves and moves in the direction of the trend.
The diagonal looks like a wedge that may be either expanding or contracting. Also, the sub-waves of the diagonal may not have a count of five, depending on what type of diagonal is being observed.
Like other motive waves, each sub-wave of the diagonal wave does not fully retrace the previous sub-wave. Also, sub-wave 3 of the diagonal is not the shortest wave.
Diagonals can be further divided into the ending and leading diagonals.
The ending diagonal usually occurs in Wave 5 of an impulse wave or the last wave of corrective waves whereas the leading diagonal is found in either the Wave 1 of an impulse wave or the Wave A position of a zigzag correction.
3. Zig-Zag:
The Zig-Zag is a corrective wave that is made up of 3 waves labelled as A, B and C that move strongly up or down.
The A and C waves are motive waves whereas the B wave is corrective (often with 3 sub-waves).
Zigzag patterns are sharp declines in a bull rally or advances in a bear rally that substantially correct the price level of the previous Impulse patterns.
Zigzags may also be formed in a combination which is known as the double or triple zigzag, where two or three zigzags are connected by another corrective wave between them.‘
4. Flat:
The flat is another three-wave correction in which the sub-waves are formed in a 3-3-5 structure which is labelled as an A-B-C structure.
In the flat structure, both Waves A and B are corrective and Wave C is motive having 5 sub-waves.
This pattern is known as the flat as it moves sideways. Generally, within an impulse wave, the fourth wave has a flat whereas the second wave rarely does.
On the technical charts, most flats usually don’t look clear as there are variations on this structure.
A flat may have wave B terminate beyond the beginning of the A wave and the C wave may terminate beyond the start of the B wave. This type of flat is known as the expanded flat.
The expanded flat is more common in markets as compared to the normal flats as discussed above.
5. Triangle:
The triangle is a pattern consisting of five sub-waves in the form of a 3-3-3-3-3 structure, that is labelled as A-B-C-D-E.
This corrective pattern shows a balance of forces and it travels sideways.
The triangle can either be expanding, in which each of the following sub-waves gets bigger or contracting, that is in the form of a wedge.
The triangles can also be categorized as symmetrical, descending or ascending, based on whether they are pointing sideways, up with a flat top or down with a flat bottom.
The sub-waves can be formed in complex combinations. It may theoretically look easy for spotting a triangle, it may take a little practice for identifying them in the market.
Bottomline:
As we have discussed above Elliott wave theory is open to interpretations in different ways by different traders, so are their patterns. Thus, traders should ensure that when they identify the patterns.
This chart is just for information
Never stop learning
I would also love to know your charts and views in the comment section.
Thank you

GBP/USD: Very Bullish PatternThe GBPUSD pair is currently trading in a long term bullish trend.
Earlier this month, the market established a new higher high, subsequently initiating a corrective movement.
A bullish flag pattern has formed, within which a minor bearish trend has been established.
Yesterday, the pair began to appreciate, with buyers successfully violating the resistance level of the flag.
This development may potentially instigate a trend-following movement.
The next objective is 1.3385.

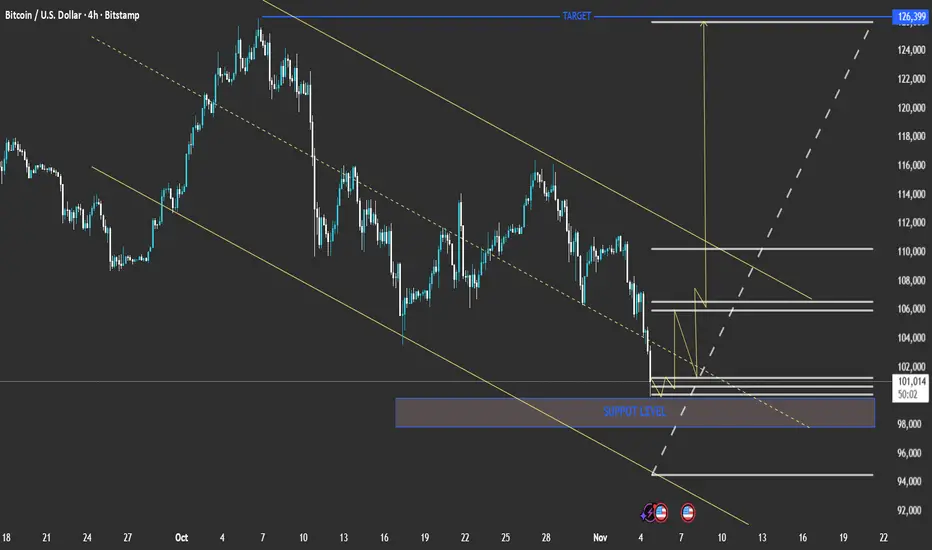
technical analysis of your Bitcoin (BTC/USD) 4-hour chartPair: BTC/USD
Timeframe: 4H
Current Price: ≈ 101,240
Trend: Downtrend within a descending channel
Main Zones:
Support Level: 98,000 – 100,000
Short-Term Resistance: 104,000 – 106,000
Major Target (Upside): 126,399
📉 Technical Outlook
Bitcoin continues to respect the descending channel drawn with parallel trendlines.
The price is now hovering near the lower boundary of the channel, close to the support level zone.
A potential bullish reversal may occur if this support holds, leading to a push toward mid-channel resistance (around 106,000).
📈 Bullish Scenario
If the support at 98,000–100,000 holds:
BTC could rebound toward 104,000 → 106,000 → 110,000.
A confirmed breakout above 110,000 may trigger a strong rally toward the main target of 126,399.
📉 Bearish Scenario
If BTC breaks below 98,000:
Expect further downside to 94,000 – 92,000, the next major demand zone.
This would confirm continuation of the descending channel trend.
⚙️ Summary
Aspect Bias
Trend Bearish (short term)
Key Support 98,000 – 100,000
Key Resistance 106,000 – 110,000
Long-Term Target 126,399 (if breakout occurs)
Short-Term Risk Break below 98,000 FPMARKETS:BTCUSD FPMARKETS:XLMUSD FPMARKETS:SOLUSD FPMARKETS:ETHUSD FPMARKETS:RPLUSD FPMARKETS:DOGUSD FPMARKETS:LTCUSD FPMARKETS:LNKUSD FPMARKETS:ADAUSD FPMARKETS:EOSUSD FPMARKETS:EOSUSD
XAU/USD (Gold) 15-Min Chart AnalysisCurrent Price: $4,005
Resistance Zone: $4,020 – $4,040
Gold is approaching a strong resistance area that previously triggered a pullback.
Trend Structure:
The market is moving inside a short-term ascending channel, but momentum shows signs of exhaustion near the upper boundary.
Key Observation:
A false breakout or rejection at the resistance could initiate a downward correction.
Bearish Signal Setup:
Entry Zone (Sell): $4,015 – $4,035 (look for rejection candles or bearish engulfing near resistance)
Target 1: $3,960
Target 2 (Main Target): $3,913
Stop Loss: $4,045 above resistance zone
Risk/Reward Ratio: Approx. 1:2.5
Confirmation:
Wait for bearish confirmation candle on 15M or 30M timeframe.
Break below $3,980 will strengthen bearish momentum toward target.
Signal Summary (📉 Sell Setup):
Direction Entry TP1 TP2 SL
🔻 SELL 4,015 – 4,035 3,960 3,913 4,045 TMX:SXF1! TMX:CRA1! TMX:SXA1! TMX:FHO1! TMX:CGF1! TMX:CGZ1! TMX:FBA1! TMX:FSH1! TMX:SXM1! TMX:SXM1! TMX:FFL1! TMX:FOP1! TMX:FRW1! TMX:FFV1! TMX:FEQ1! TMX:FRQ1!

technical analysis of your provided XAU/USD (GoldTimeframe: 15 minutes
Current Price: $3,963.81
Trend Structure: Price recently broke out from a descending channel.
Key Levels:
Support Zone: $3,920 – $3,940
Immediate Resistance: $3,980
Target Zone: $4,142
📉 Technical Breakdown
Descending Channel Breakout
The chart shows gold had been moving in a clear downward channel.
The recent candles show attempts to break above the upper trendline, suggesting potential bullish momentum building up.
Support Level
A strong demand zone is visible around $3,920 – $3,940.
This zone has been marked as a possible retest area before continuation to the upside.
Price Projection
The chart projects a bullish scenario, where price may retrace slightly to support before targeting the $4,142.60 level.
This suggests a swing-buy setup, with confirmation depending on a strong bounce from the support level.
Market Structure
The formation of higher lows near the lower boundary of the channel signals momentum reversal.
A confirmed breakout with volume above $3,980 will lik TVC:GR10Y TVC:GR02Y EURONEXT:PSI1! EURONEXT:EV6X2025 EURONEXT:GE8Z2025 EURONEXT:PO6X2025 ely validate the bullish continuation.
🎯 Trading Plan Suggestion (Analytical View)
Buy Zone: $3,940 – $3,950 (after confirmation candle)
Take Profit Target: $4,142
Stop Loss: Below $3,915 (to protect against false breakout)
⚠️ Notes
Watch for price rejection near $3,980, as it could form temporary consolidation. EURONEXT:PO6X2025 EURONEXT:SNAX2025 EURONEXT:EV8Z2025 EURONEXT:PSI1! EURONEXT:XA8Z2025 EURONEXT:XA6X2025 EURONEXT:PO8Z2025
If price closes below $3,920, bearish momentum may resume.

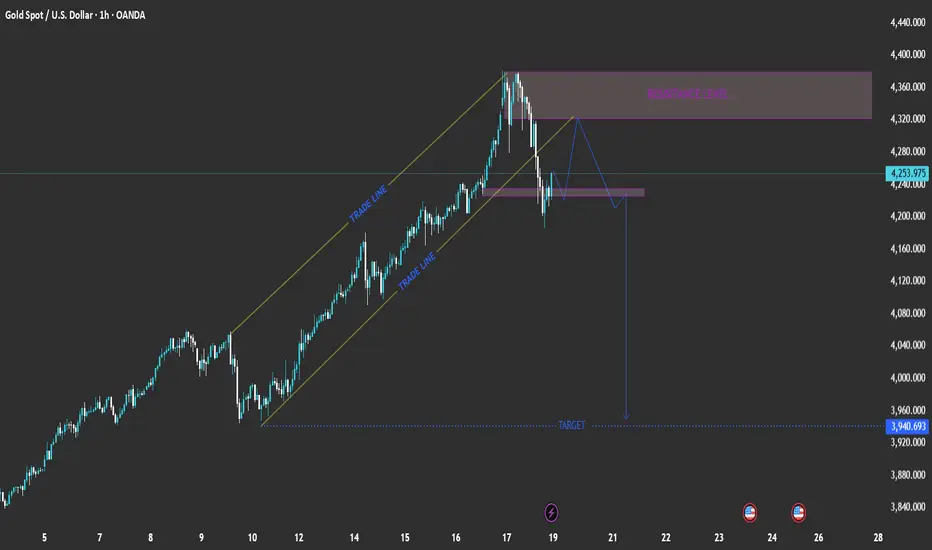
XAU/USD: Channel Breakout → Retest → Downside Target at 3,940EURONEXT:FTI1! EURONEXT:FTI1! EURONEXT:VU8F2026 EURONEXT:VM81! EURONEXT:VV6X2025 EURONEXT:V26X2025 EURONEXT:NS8Z2025 EURONEXT:YG8F2026 Pair: Gold Spot (XAU/USD)
Timeframe: 1-hour
Current Price: 4,253.975
Trend: Recently broke out of an ascending channel (bearish signal)
📉 Chart Breakdown
1. Ascending Channel (Trade Lines)
Price was moving steadily inside a rising channel, indicated by the two parallel yellow “TRADE LINE” levels.
The break below the lower trade line suggests weakening bullish momentum and potential trend reversal.
2. Resistance Level (4,320 – 4,360 zone)
Marked in purple, this zone served as a key resistance.
Price rejected strongly from this area, confirming seller presence.
3. Structure Retest and Potential Move
After the channel break, price retraced back to retest the broken channel support (now resistance).
The projected blue path shows a lower-high formation followed by a new drop, completing a bearish continuation pattern.
4. Target Zone
The projected target is near 3,940.693, aligning with previous structure support.
This level could serve as a profit-taking area for short positions.
📊 Summary of Key Levels
Zone Type Range / Level
4,320 – 4,360 Resistance Strong supply zone
4,220 – 4,240 Retest zone Potential short entry area
3,940 Target Bearish target / demand zone
⚙️ Trading Plan Concept (Hypothetical)
Bias: Bearish
Entry Idea: Wait for rejection from 4,220–4,240 zone.
Stop Loss: Above 4,280 (resistance)
Take Profit: Around 3,940 (target)
Risk/Reward: Approximately 1:3 or better
🧭 Conclusion
The chart suggests that Gold (XAU/USD) might be entering a corrective bearish phase after failing to sustain its bullish channel. A retest of broken structure before another drop aligns with typical market structure behavior.
analysis for Gold (XAU/USD) based on your 15-minute chart:he chart shows a descending channel (marked by “TRADE LINE”) that recently broke to the upside, suggesting a possible short-term bullish reversal.
A strong resistance zone is visible near 4140–4160, where price has previously rejected multiple times.
The target zone below is marked around 4042.57, which aligns with prior swing support.
Key Levels
Resistance: 4140 – 4160
Support: 4080 – 4060
Target (Downside): 4042
Upside Break Zone: Above 4160 could lead toward 4180+
Analysis Summary
The price broke out of a short-term bearish channel, indicating potential for a bullish correction toward resistance (4140–4160).
However, this zone is critical resistance; rejection here may trigger a pullback back toward 4080 or even the target at 4042.
Momentum indicators suggest the move is reactive (short-term retracement), not yet a trend reversal.
⚙️ Trading Outlook
Bearish Bias: Below 4140 → potential retest toward 4060–4040.
Bullish Confirmation: Only above 4160 → continuation to 4180–4200. MIL:RACE MIL:LDO MIL:STLAM MIL:ENI MIL:STMMI MIL:STMMI MIL:ENEL MIL:MONC MIL:PRY MIL:TIT MIL:FCT MIL:AZM MIL:WBD

technical analysis of your chart for USD/CAD (15-minute timeframThe pair is moving within an ascending channel, indicating short-term bullish momentum.
Higher highs and higher lows confirm the ongoing uptrend structure.
🟦 Key Zone
Support Level: 1.3985 – 1.3990
This shaded zone represents a demand area where price previously found strong buying interest.
As long as this level holds, the short-term bullish bias remains valid.
🔹 Price Action Outlook
Price is currently testing the lower trendline of the channel and near the support zone.
A bullish reaction from this level could trigger a bounce toward the mid-channel and potentially the upper resistance.
🎯 Target
Upside Target: 1.4039
This corresponds to the upper boundary of the channel and a previous swing high area.
⚠️ Invalidation / Risk Level
A break below 1.3980 would invalidate the bullish setup and could lead to a bearish correction toward 1.3965 or lower.
📈 Trading Signal (Summary)
Bias: Bullish (short-term)
Entry Zone: 1.3985 – 1.3995 (support area)
Target: 1.4039
Stop-Loss: Below 1.3980 ICMARKETS:EURUSD ICMARKETS:GBPUSD ICMARKETS:USDJPY ICMARKETS:GBPJPY ICMARKETS:AUDUSD ICMARKETS:USDCAD ICMARKETS:USDCHF ICMARKETS:NZDUSD ICMARKETS:EURJPY ICMARKETS:EURJPY ICMARKETS:AUDJPY ICMARKETS:EURGBP ICMARKETS:GBPAUD ICMARKETS:USDZAR ICMARKETS:USDDKK

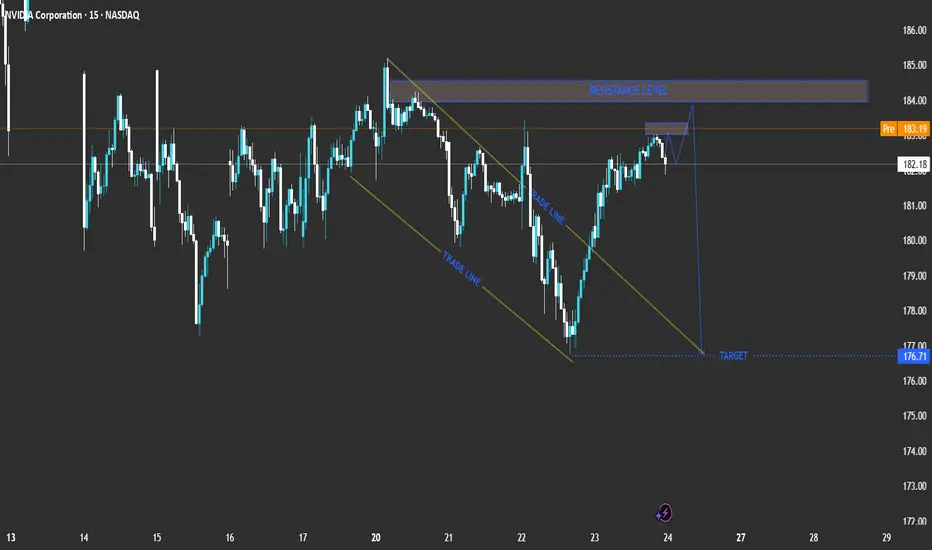
r NVIDIA Corporation (NVDA) based on your chart:Current Price: 182.18
Pre-Market Price: 183.21
Trend: Short-term bullish recovery inside a broader corrective phase.
Technical Breakdown
Descending Channel (Trade Line)
NVDA recently traded inside a downward-sloping channel, showing controlled selling pressure.
The breakout above the upper trade line suggests a short-term bullish correction phase.
Resistance Zone
A strong resistance level lies between 183.00 and 184.00.
This zone aligns with previous highs and may act as a reversal area if the price fails to break above it.
Expected Move
The chart projection shows a potential rejection near the resistance level, followed by a pullback towards the 176.71 target area.
This indicates that the current upward move might be corrective before another bearish swing.
Trade Scenarios
📉 Bearish Reversal Scenario (Primary Setup)
Entry Zone: 183.00 – 184.00 (resistance area)
Confirmation: Bearish rejection candlestick pattern or a failed breakout.
Target: 176.71
Stop Loss: Above 184.50
Comment: Ideal short setup if price rejects resistance.
📈 Bullish Breakout Scenario (Alternative)
Entry: Above 184.50 with strong bullish momentum.
Target: 186.50 – 187.00
Comment: A breakout and hold above resistance would invalidate the short setup and indicate further upside.
Summary Table
Bias Key Level Confirmation Target Notes
Bearish (Primary) 183 – 184 Rejection candle 176.71 Short setup
Bullish (Alternative) Above 184.50 Breakout candle 186.5 – 187 Upside continuation
Conclusion
NVIDIA (NVDA) is approaching a crucial resistance level. The most probable scenario is a bearish reversal from the 183–184 zone, targeting 176.71. However, a confirmed breakout above 184.50 would signal bullish continuation toward 187.00. NASDAQ:PLTR NASDAQ:AMD NASDAQ:AMZN NASDAQ:AAPL NASDAQ:TSLA OMXCOP:BAVA OMXCOP:GN OMXCOP:DNORD OMXCOP:TRMD_A OMXCOP:MAERSK_B OMXCOP:NKT OMXCOP:PNDORA OMXCOP:NSIS_B OMXCOP:DSV OMXCOP:ORSTED OMXCOP:GMAB
XAU/USD – Bullish Reversal Setup from Buy Zone within DescendingLME:CA1! LME:NI1! LME:MC1! LME:SN1! LME:LH1! LME:SC1! LME:CO1! LME:ZS1! LME:HC1! LME:MA1! LME:MZ1! LME:EA1! Market Structure Overview
The price is currently moving inside a descending channel (marked as TRADE LINE).
A Buy Zone is identified between $4,315 – $4,325, which acts as a strong support area.
Price has touched the lower channel line and rebounded upward, indicating buyer interest around that zone.
📉 Short-Term Trend
The short-term trend is bearish due to lower highs and lower lows inside the channel.
However, momentum shows weakening selling pressure near the buy zone.
🟢 Bullish Scenario
If price holds above the Buy Zone and forms bullish candles, expect a potential reversal toward the upper channel line.
A breakout above the upper channel would signal a trend shift, targeting:
Target: $4,381 – $4,385 (as marked on your chart).
🔴 Bearish Scenario
If price breaks below $4,315, it would invalidate the buy zone setup.
Next potential support could be around $4,300 or lower.
📊 Trade Plan Example
Entry: Near $4,320 – $4,325 (Buy Zone)
Stop-Loss: Below $4,310
Take-Profit: $4,380 – $4,385
Risk-to-Reward: Approximately 1:4
⚙️ Summary
Gold is currently consolidating within a descending channel.
A bullish breakout from this structure could open the path toward the $4,381 target zone, confirming short-term bullish reversal momentum.

– Bullish Reversal Expected from Buy Zone Toward 1.1729 TargetEUR/USD Technical Analysis (15-Minute Timeframe)
Current Price: 1.1644
Market Structure:
The price is moving inside a descending channel, defined by two parallel trade lines (upper resistance and lower support).
A BUY ZONE is marked between 1.1635 – 1.1645, which aligns with a previous demand area.
The market is currently testing the lower boundary of this channel, suggesting potential buying interest.
🔍 Market Outlook
The recent downtrend appears to be a corrective phase following a previous bullish impulse.
The BUY ZONE represents a strong demand area, where buyers may step in.
A breakout above the upper trade line would likely confirm bullish momentum and a potential trend reversal.
🎯 Trade Setup Idea
Buy Entry Zone: 1.1635 – 1.1645
Confirmation: Bullish breakout and candle close above the descending trendline
Target: 1.1729 (as indicated on the chart)
Stop Loss: Below 1.1610 (below previous low and demand zone)
⚠️ Trading Notes
Wait for a clear breakout candle above the upper trade line to confirm buyer strength.
A close below 1.1630 would invalidate the short-term bullish setup.
Watch momentum and volume to confirm the breakout’s validity — weak momentum may lead to a false breakout. FX:GBPUSD FX:USDJPY OANDA:GBPJPY OANDA:AUDUSD OANDA:USDCAD OANDA:USDCHF OANDA:NZDUSD OANDA:EURGBP OANDA:GBPJPY OANDA:EURNZD

XAU/USD – Key Resistance Zone Test Ahead of Breakout DecisionCME_MINI:NQ1! GPW:FW201! GPW:FCDR1! GPW:FDNP1! GPW:FW401! GPW:FPEO1! GPW:FCDR1! GPW:FALE1! GPW:FMBK1! Gold Spot (XAU/USD)
Timeframe: 15-minute chart
🔍 Technical Analysis Summary
1. Trend Context
The chart shows a recent downtrend after a strong bullish rally.
A descending channel is drawn with two “TRADE LINE” boundaries — upper and lower.
Price is currently trading near the upper boundary of this bearish channel.
2. Resistance Zone
The highlighted resistance area around $4,270–$4,280 aligns with:
The upper trade line of the channel.
A previous support-turned-resistance level.
This makes it a key decision zone for potential reversals or breakouts.
3. Scenario 1 – Bullish Breakout (Blue Path)
If price breaks and closes above the resistance zone and upper channel:
A bullish move could target around $4,382 (the marked upper target).
Confirmation would come with a retest of the broken resistance that holds as new support.
This move aligns with a trend reversal structure (break of market structure).
4. Scenario 2 – Bearish Rejection (Purple Path)
If price fails to break above the resistance and gets rejected:
Expect a pullback continuation within the descending channel.
The next downside target is around $4,185, as labeled on the chart.
This would maintain the short-term bearish momentum.
🧭 Summary Outlook
Scenario Condition Target Bias
Bullish breakout Break & close above $4,280 $4,382 Reversal potential
Bearish rejection Rejection from resistance zone $4,185 Continuation of downtrend
⚠️ Key Watchpoints
Watch for price action confirmation (strong candle close) near the resistance zone.
A false breakout is possible; confirmation via retest is crucial.
Volatility spikes around this level could indicate institutional interest.

(ETH/USD) Bullish Setup: Entry at $2,422 with Target at $2,521 a1. Entry Point: ~2,422.2
This is the suggested buy area based on a recent bounce from the support zone
2. Support Zone (Purple Box):
Bottom boundary: ~2,392.4
Top boundary: ~2,408.4
Price has bounced multiple times here, showing strong buying interest.
3. Resistance Point: ~2,463.9
A clear horizontal resistance line, previously tested.
4. EA Target Point: ~2,522.1
A bullish target if the price breaks above the resistance level.
🔶 Highlighted Patterns / Markers
Orange Circles: Indicate key swing highs and lows — possibly used to identify double tops/bottoms or rejection/wick zones.
Blue Arrows: Illustrate the anticipated move from:
Entry (2,408.1) → Resistance (2,463.9) → Target (2,521.2)
Target gain = +111.7 USD (+4.64%)
🔻 Stop Loss Level
Set just below the support box at ~2,392.4
Protects from false breakouts or deeper pullbacks.
📈 Strategy Outlook
Bullish Bias: The setup expects a breakout from the current price range.
Risk-Reward Ratio: Appears favorable — tight stop and wide target.
Confirmation Needed: A solid breakout and hold above 2,423–2,425 may be the early confirmation signal.
📌 Summary
Element Value
Entry Point ~2,422.2
Stop Loss ~2,392.4
Resistance ~2,463.9
Target (TP) ~2,521.2
R:R Ratio Approx. 3:1
Bias Bullish

Silver (XAG/USD) Bullish Trade Setup from Key Support ZoneXAG/USD (Silver) Trade Analysis – 2H Chart (July 2, 2025)
🔹 Trade Setup Overview:
Entry Point: 35.84299
Target (TP): 37.32540
Stop Loss (SL): 35.59483
Current Price: 36.36350
Risk/Reward Ratio: ~5.9:1 (Very favorable)
🔹 Technical Insights:
Support Zone:
Price recently tested and respected a strong demand zone between 35.60 – 35.84, which has now acted as a bounce level.
Multiple wicks and rejections at this zone highlight buyer interest.
Moving Averages:
50 EMA (red) is starting to flatten, possibly hinting at momentum reversal.
200 EMA (blue) held as dynamic support during the last dip — a bullish signal.
Breakout Potential:
Price has bounced off the entry zone and is approaching minor resistance near 36.40–36.60.
A clean break above this area can trigger momentum toward the 37.30s.
Volume & Momentum:
The latest candle shows strong bullish momentum, validating the bounce setup.
No sign of exhaustion yet.
🔹 Strategy Suggestion:
Entry has already occurred or is slightly above entry zone — ideal for aggressive traders to ride the momentum.
Conservative traders may wait for a pullback near 36.00–36.10 before entering.
SL is well-placed below previous lows and structure — reasonable protection.
🔹 Conclusion:
This setup reflects a bullish continuation trade from a strong support zone. Given the risk/reward profile and recent bullish action, this trade is technically sound as long as price stays above 35.84. A close below this level could invalidate the setup

(XAU/USD) 3H Chart – Bearish Reversal Setup from Resistance Zon1. Entry Point (Sell):
Marked at 3,335.03
This is a key resistance level where price is expected to reverse downward.
2. Stop Loss:
Placed above at 3,354.88
This acts as a protection level in case the trade goes against the direction.
3. Take Profit Targets (EA Target Points):
TP1 (Downside): 3,245.65
TP2 (Upside - if Stop Loss is hit): 3,455.76 (in case of reversal or long position)
4. Price Action Observation:
Price is currently around 3,320.56, climbing back toward the entry zone.
The red 50-period moving average (EMA) and blue 200-period MA show convergence, often preceding volatility.
---
📉 Bearish Scenario (Main Setup)
Sell Bias is expected from the 3,335 region.
If price respects the resistance zone and breaks down again, the target is 3,245.65, yielding approximately 90-point move.
This is a risk-reward favorable setup, with:
Risk: ~20 points
Reward: ~90 points
RRR ≈ 1:4.5
---
⚠️ Bullish Invalidity (Stop Loss Hit)
If the price breaks and closes above 3,354.88, it invalidates the bearish setup.
Then, the market may shift towards targeting 3,455.76 — about 100 points to the upside.
---
🔧 Technical Factors Supporting the Setup
Supply zone marked by the purple box around the entry.
Trend previously bearish — recent upward move may just be a retracement.
Confluence with MAs: Price is testing MAs — rejection here would add bearish confirmation.
---
✅ Summary of Trade Setup
Element Value
Entry 3,335.03
Stop Loss 3,354.88
Take Profit 3,245.65
Alt Target 3,455.76 (if SL hit)
Risk-Reward ~1:4.5
Bias Bearish (Sell Setup)

Gold/USD Bullish Breakout Toward Target Zone Gold/USD Bullish Breakout Analysis 🚀🟢
The chart illustrates a strong bullish breakout from a consolidation zone, signaling upward momentum:
🔍 Key Technical Observations:
Support Zone: The price respected the support area around 3,325 – 3,330 USD, forming a solid base for reversal.
Bullish Structure: Series of higher lows and higher highs indicate a bullish trend formation.
Breakout Confirmation: Price broke above short-term resistance with a strong bullish candle, indicating buying pressure.
Trendline Support: The ascending trendline has held well, confirming trend continuation.
Target Point 🎯: Projected target is near 3,365 USD, which aligns with a previous resistance and Fibonacci confluence zone.
✅ Conclusion:
The breakout above resistance, supported by a bullish structure and momentum, suggests further upside potential toward the 3,365 USD target zone. As long as price holds above the breakout level, bullish bias remains valid.
🛑 Watch for invalidation if price falls back

Tesla Bullish Breakout Setup: Entry at $295.54 Targeting $488.87Entry Point (Buy Zone): Around $295.54
Stop Loss: Between $272.94 – $295.54 (lower purple support zone)
Target (TP): $488.87
Current Price: $315.33 (as of the latest candle)
📈 Strategy Summary:
Setup Type: Long (Buy)
Risk-Reward Setup:
Reward: ~$193.33 per share (from $295.54 to $488.87)
Risk: ~$22.60 per share (from $295.54 to $272.94)
Reward:Risk Ratio ≈ 8.6:1 — a high potential payoff if the trade works out.
📊 Technical Context:
Support Zone: Price recently bounced off the support region (marked in purple).
Moving Averages:
Red Line (Short-Term MA): Price just crossed back above.
Blue Line (Long-Term MA): Price reclaimed this level — bullish signal.
Price Action: After a corrective phase, a possible reversal is forming at support, confirming bullish interest.
✅ Bullish Signals:
Bounce from support zone with a strong bullish candle.
Price closing above the 200-day MA (bullish trend resumption).
High reward-to-risk trade setup with clear stop loss.
⚠️ Considerations:
Confirmation with volume or a second bullish candle would add confidence.
Watch for earnings or macro events that could disrupt the trend.
Tight stop is essential to avoid drawdowns if the setup fails.
🔚 Conclusion
This is a well-structured long setup with a high potential reward. If price maintains above the entry zone and breaks recent highs, a push toward the $488.87 target is plausible.

XRP/USD – Bearish Rejection from Resistance Zone Targets 2.0686XRP/USD Bearish Reversal Setup – H1 Chart 🕐
Analysis:
Entry Point: Price entered a short zone near 2.21828, which aligns with a previous resistance zone.
Bearish Rejection: The price formed a rejection wick and bearish candle at the resistance, signaling a potential reversal.
EMA Confluence: The price is testing below the red 50 EMA, and the 200 EMA (blue) is acting as dynamic support.
Support Zone Retest: The recent price pullback suggests a possible retest of the small support zone around 2.19106.
Target: The projected downside target is 2.06869, aligned with the prior demand zone.
Stop Loss: Positioned above resistance at 2.21828, just outside the upper rejection area.
📌 Summary:
Trend Bias: Bearish
Entry: Around 2.21828
Target: 2.06869 (≈ -6.67%)
Stop Loss: Above 2.21828

DXY Bullish Reversal Setup Toward 98.20 Target Entry Point
Marked at: ~97.200
The price has already reacted multiple times around this level, suggesting it's a key support zone.
🛑 Stop Loss
Placed at: ~96.930
Just below the support zone, protecting against a breakdown below recent lows.
This implies a risk of about 27 pips from the entry.
🎯 Target Point (TP)
Marked at: ~98.201
Strong resistance zone from previous price action.
Target implies a potential reward of 100+ pips, offering a risk-reward ratio (RRR) of ~3.7:1, which is favorable.
📊 Resistance Area
Around 97.419–97.465
This is the first obstacle the price must break through to confirm bullish continuation.
The 200 EMA (blue curve) is currently acting as dynamic resistance, aligning near this zone.
📉 Indicators
Moving Averages:
Red: Likely 50 EMA
Blue: Likely 200 EMA
Price is currently below both EMAs — so trend is still bearish, but trying to shift.
📌 Strategy Insight
The setup anticipates a bullish reversal from 97.200, aiming for a breakout above the 200 EMA and resistance to reach the 98.201 zone.
For confirmation, watch for a strong bullish candle close above 97.465, which would validate upside continuation.
⚠️ Risks
Price is still under both moving averages → downward momentum may persist.
If support at 97.00 breaks, downside acceleration could occur.
✅ Conclusion:
This is a bullish breakout setup on DXY with:
Defined entry and stop-loss.
Clear target.
High RRR.
But it’s crucial to wait for confirmation above resistance (97.465) before full conviction on the long trade.
