KWEB: China’s Internet Sector - AI Catch-Up and Cheap ValuationsChina’s internet and tech stocks have been hammered for years — regulatory crackdowns, slowing growth fears, and geopolitical tension have crushed sentiment. But as investors know, the best opportunities often hide in what everyone hates.
Enter KWEB, the KraneShares CSI China Internet ETF.
It’s a diversified, liquid way to play a bounce in major names like Alibaba, Tencent, JD .com, Baidu, Meituan and PDD.
Here’s why I think the risk/reward looks compelling now — especially if you believe in AI closing the gap.
Key Bullish Points:
1) Valuations at Rock-Bottom
Many big China internet stocks are still trading at single-digit P/E ratios, even as their cash flows recover. Compared to U.S. big tech trading at 30–50x, this is a huge valuation gap.
Regulatory fears seem largely priced in — Beijing wants growth, not stagnation, and some policies are easing.
2) China’s AI Push — Just “Months Behind”
Jansen Whang recently argued that China’s generative AI development is only “months behind” the U.S. Players like Baidu, Alibaba Cloud, Tencent, and SenseTime are all racing to launch new LLMs and integrated AI tools.
If you believe the gap closes, Chinese platforms could see a major earnings rebound as they roll out AI upgrades across search, cloud, e-commerce and social media.
3) Sentiment So Bad, It’s Good
When the headlines scream “China is uninvestable,” that’s often when big mean reversion trades set up. Even a small policy pivot, stimulus plan, or positive AI news cycle can spark a sharp rally.
KWEB is one of the cleanest ways to express this view because it holds a diversified basket — you don’t have to pick a single winner.
China!

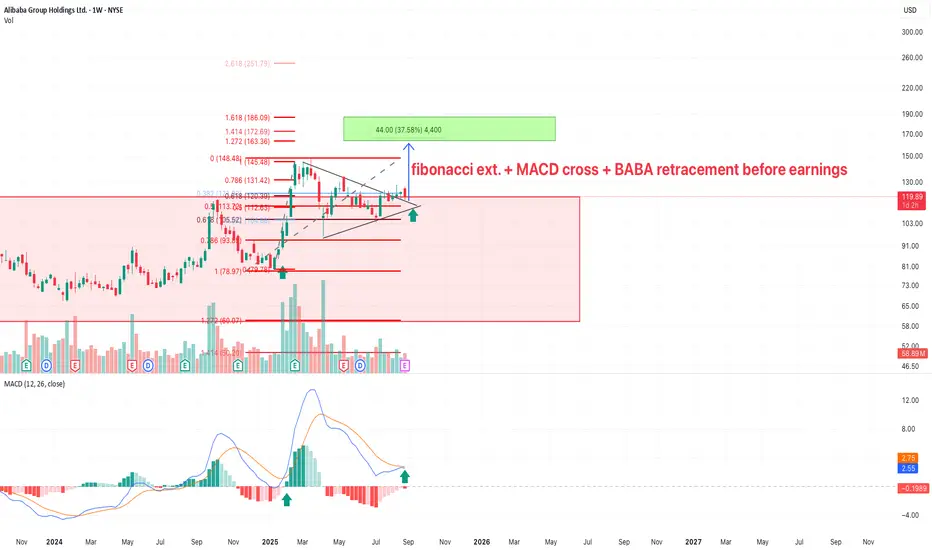
A Great and Clear Idea For AlibabaKEY POINTS (Why this idea stands out):
Bullish Symmetrical Triangle → The breakout has already happened, and the price has successfully retested the triangle trendline — a strong confirmation of bullish continuation.
Fibonacci Retracement → Confirms healthy pullback levels, showing the market structure is intact and technically strong.
Fibonacci Extension aligned with Triangle Take Profit → Rare confluence that significantly increases the probability of hitting the target.
MACD Bullish Crossover → Momentum indicator is turning positive, further validating the bullish setup and supporting upside continuation.
📊 This is a pure and clear Murphy-style Technical Analysis, based exclusively on objective chart signals.
Why Alibaba (like JD.com) is the right choice now:
Deeply undervalued: Current market price does not reflect Alibaba’s real business strength.
Pre-earnings tech opportunity: Chinese tech stocks historically experience strong price action ahead of earnings.
Perfect technical + fundamental alignment: Breakout confirmation, Fibonacci confluence, and bullish momentum (MACD) combine with undervaluation to create a high-probability setup.
⚠️ Main Risk Factor:
U.S. financial media often manipulates sentiment on Chinese equities with aggressive negative campaigns (Zacks, Dow Jones News, Alpha News).
✅ Solution: Filter out the noise and rely on neutral, fact-based outlets like Reuters.]
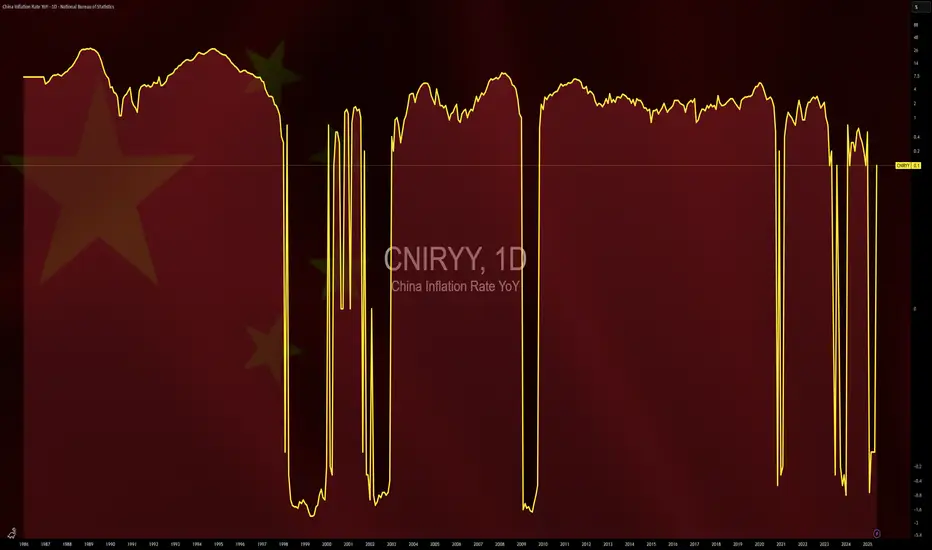
$CNIRYY - China CPI (August/2025)ECONOMICS:CNIRYY
August/2025
source: National Bureau of Statistics of China
- China’s consumer prices dropped 0.4% yoy in August 2025, after being flat in the previous month and missing market expectations of a 0.2% fall.
It was the fifth time of consumer deflation this year and the sharpest pace since February.
Food prices slumped (-4.3% vs -1.6% in July), logging the steepest fall in nearly four years, with broad-based decreases across categories and a sharper drop in pork prices, due to ample supply, lower production costs, and weak demand.
In contrast, non-food inflation quickened (0.5% vs 0.3%), supported by Beijing’s ongoing consumer goods subsidies, with increases in housing (0.1% vs 0.1%), clothing (1.8% vs 1.7%), healthcare (0.9% vs 0.5%), and education (1.0% vs 0.9%).
Meanwhile, transport costs shrank but at a slower pace (-2.4% vs -3.1%). Core inflation, which excludes food and energy, rose 0.9% yoy, the highest in 18 months, after a 0.8% gain in July.
On a monthly basis, CPI was flat, below forecasts of 0.1%, following a 0.4% increase in July.

$CFX: my green zones are back. Time to refill our bags.LSE:CFX delivered an impressive bounce during this mini-altseason, confirming it’s a project worth keeping on the radar for the upcoming full altseason.
However, its non-US listing status could limit its performance if BlackRock launches altcoin index ETFs — as it’s unlikely Conflux would be included, meaning it wouldn’t directly benefit from institutional inflows.
That said, LSE:CFX remains a strong, China-based blockchain project, and if the Chinese government takes significant steps toward crypto adoption, this coin has the potential to skyrocket.
--------------------------------
The altcoin market just saw a solid pump, following the massive CRYPTOCAP:BTC and CRYPTOCAP:ETH institutional billion-dollar purchases.
On the Daily timeframe, we’re actually printing higher lows, showing clear market strength. The top of the range was rejected, and now it’s highly probable that the crypto market will enter a consolidation phase — a move that could push several altcoins into my buying zones.
💡 Reminder: My buying zones are areas where it’s statistically safer to buy and hold, with an almost guaranteed chance of making a solid profit on the next bounce.
What could spark the infamous Altseason?
Many altcoins share one thing in common: a major resistance line (marked in yellow). For them to pump to the moon, this line needs to be broken.
We’re also seeing a price compression — meaning the breakout could be imminent. This pullback might be your last chance to enter a long position before the real Altseason kicks off.
Possible Altseason catalysts:
📉 FED Interest Rate Cut of 1% or more.
📈 Institutional adoption through altcoin index ETFs — imagine BlackRock launching ALT10, ALT50, ALT100 ETFs, attracting massive institutional money into the altcoin market.
I believe both events could happen before the end of the year.
DYOR — but the window might be closing fast. 🚀

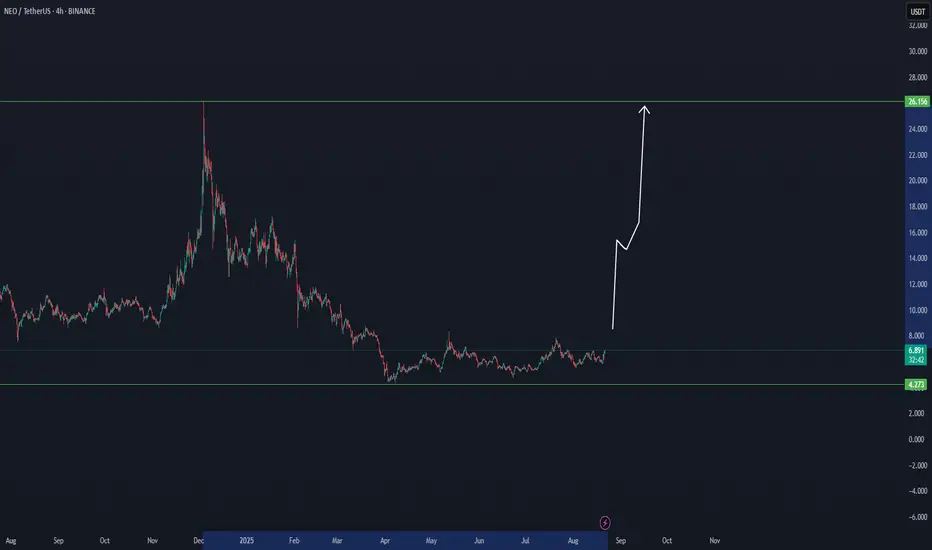
NEO - Will the Bulls take over?Hello TradingView Family / Fellow Traders. This is Richard, also known as theSignalyst.
📈NEO has been overall bullish trading within the flat rising channel marked in blue.
This week, NEO has been retesting the lower bound of the channel.
Moreover, the green zone is a strong support and structure.
🏹 Thus, the highlighted blue circle is a strong area to look for buy setups as it is the intersection of the lower blue trendline and green support.
📚 As per my trading style:
As #NEO approaches the blue circle zone, I will be looking for trend-following bullish reversal setups (like a double bottom pattern, trendline break , and so on...)
📚 Always follow your trading plan regarding entry, risk management, and trade management.
Good luck!
All Strategies Are Good; If Managed Properly!
~Richard Nasr
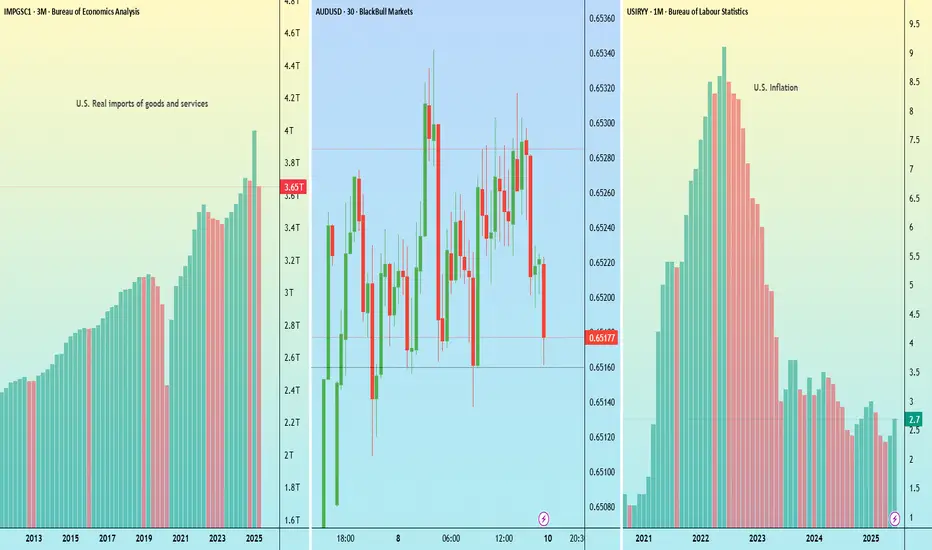
Australian dollar extends gains, hits three-week highThe Australian dollar is coming off a positive week and has extended its gains on Monday. In the North American session, AUD/USD is trading at 0.6556, up 0.27% on the day. Earlier, the Aussie rose as high as 0.6560, its highest level since August 11. With US markets closed for Labor Day, we're unlikely to see stronger movement from AUD/USD during the day.
China's manufacturing sector continues to contract and that could spell trouble for the Australian economy and the Aussie. China's manufacturing PMI for August inched higher to 49.4 from 49.3 in August. This missed the market forecast of 49.5 and marked the fight straight month of contraction in manufacturing.
The manufacturing industry has been dampened by weak global demand and US tariffs on Chinese products. The drop in manufacturing activity means there has been less demand for iron ore from Australia, which is used in the production of steel. This has resulted in a decline in iron ore prices, which has weighed on the Australian dollar and dampened Australia's export-reliant economy.
The US core personal consumption expenditures price index (core PCE), the Federal Reserve's preferred inflation indicator, ticked higher to 2.9% in July, up from 2.8% in June. This matched the market estimate and was a five-month high. Monthly, core PCE rose 0.3%, unchanged from June and in line with the market estimate. The slight rise in US core inflation has raised expectations of a rate cut at the Fed's September 17 meeting to 89%, up from 86% just before the core PCE release on Friday.
AUD/USD is testing resistance at 06552. Above, there is resistance at 0.6563 and 0.6578
0.6537 and 0.6526 are providing support

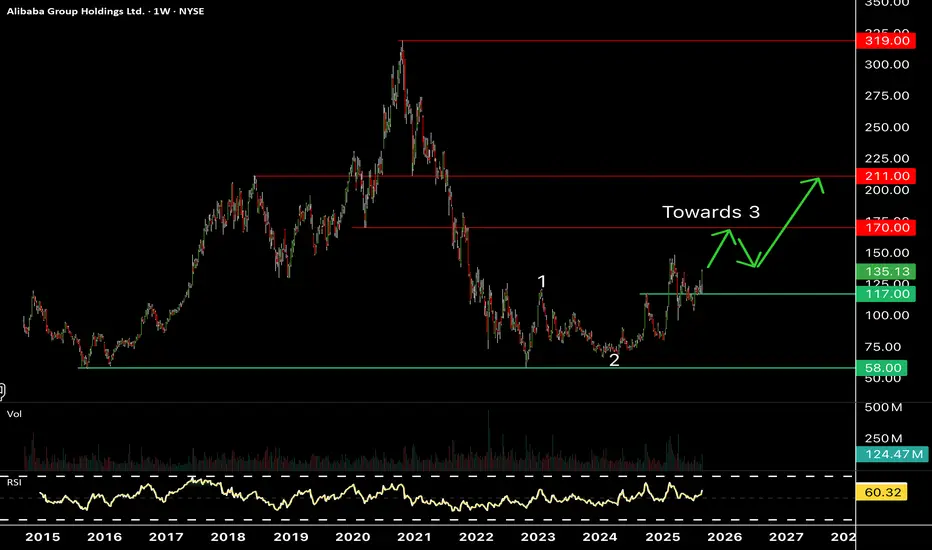
Is Alibaba a Buy: Fundamental Deep DiveWe have looked over some key metrics of Alibaba.
Based on Revenue, Debt, Net Income, PE, Free Cash Flow and other metric we have concluded that Alibaba can continue to move higher.
We provide some baseline targets based off of wall street EPS estimates.
We prove some hyperbolic targets based off of historical median PE targets.
Its amazing how much risk premium is built into this China valuation as Alibaba sure looks good.
EPS is set to continue to surge, Cap Ex spending should slow, net debt has been reducing.
All key metrics support a stronger balance sheet and a continued growth.
Baba cloud division is finally turning profitable and if this continues will be a major tailwind for the stock.
New AI chip development could catapult this stock as it tries to capture a tiny share of NVDA market.
We have been long NYSE:BABA since early July and will continue to buy on pullbacks (Not FA advice)

Is Alibaba entering a stage 2 breakout formation? This video depicts a pure technical summary of Alibaba on multiple different time frames.
We will follow this video up with a fundamental view.
Using previous cycles we believe Alibaba is poised for a 12-24 month explosive move.
Baba looks o be entering the explosive stage 2 formation.
Breaking out and defending monthly chart support...Baba looks great on all time frames.
Many bullish patterns are triggering....Weekly bull flags / inverse head and shoulders.
The minimum upside target if the bullflag completes is around 160 - 165.
We have been long Baba since early July when it kissed the daily 200 MA.

Alibaba looking to move higherToday's results seem to have trigger Alibaba for much higher levels. The market seems to have appreciated the growth of its cloud and AI business as well as its new AI chips.
Chinese big cap techs are much cheaper than US counterparts and seem to be presenting interesting opportunities.
Next resistance/target in the $170 area as long as $117 support is holding.
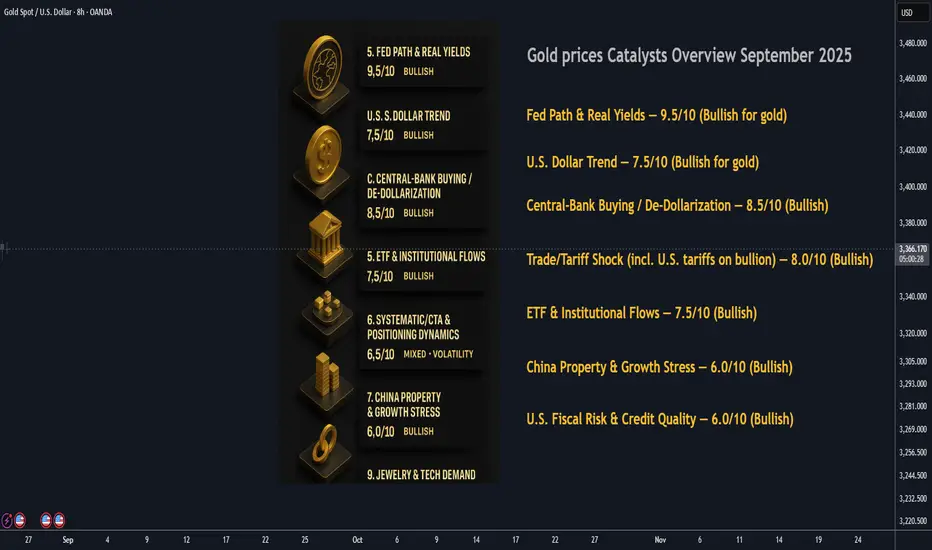
Gold Prices Overview of Primary Catalyst : September 2025⚡️ Gold: Consolidation Before the Next Move
Gold set fresh records earlier this year and now sits in a tight post–Jackson Hole range around $3,360–$3,380/oz as rate-cut odds jumped and the dollar eased back. Spot was ~$3,368 this morning, slightly off Friday’s spike after Powell opened the door to a September cut.
________________________________________
1) Fed Path & Real Yields — 9.5/10 (Bullish for gold)
Powell’s Jackson Hole remarks highlighted rising labor-market risks and explicitly “opened the door” to a September cut. Futures now price a high probability of an initial -25 bps move with more to follow into year-end. Lower policy rates/real yields remain the single strongest tailwind for non-yielding gold.
2) U.S. Dollar Trend — 7.5/10 (Bullish for gold)
The DXY slipped toward the high-97s after Powell’s dovish tilt and remains soft versus recent peaks, reducing a key headwind to non-USD buyers. If the dollar rebound stalls, gold’s upside path stays cleaner.
3) Central-Bank Buying / De-Dollarization — 8.5/10 (Bullish)
Official-sector demand stays structurally strong. Global central banks remain on track for another ~1,000t year, with China’s PBoC extending purchases for a ninth straight month. This “sticky” bid continues to underwrite dips.
4) Trade/Tariff Shock (incl. U.S. tariffs on bullion) — 8.0/10 (Bullish)
The broad U.S. tariff regime (10% baseline, higher on targeted goods) is inflationary at the margin; crucially, imports of 1kg/100oz gold bars were swept into the rules, temporarily snarling Swiss shipments and roiling COMEX/LBMA logistics until guidance is clarified. Result: fatter location/financing premia and periodic price dislocations that tend to support spot.
5) ETF & Institutional Flows — 7.5/10 (Bullish)
After years of outflows, ETF inflows in the first half of 2025 were the strongest in 5 years (~$38B; +397t), with July showing further additions. GLD holdings are back near ~957t. Continued inflows amplify macro moves.
6) Systematic/CTA & Positioning Dynamics — 6.5/10 (Mixed → Volatility)
CTAs and options flow are magnifying swings around key levels ($3,350–$3,420). Upside call demand is persistent, meaning whipsaws remain likely as trend-following systems react to dollar/yield shifts.
7) China Property & Growth Stress — 6.0/10 (Bullish)
The Evergrande delisting and deepening Country Garden losses underscore a property slump that keeps risk appetite in check and supports defensive assets. Weak housing drags on jewelry demand but typically supports investment demand for bullion.
8) U.S. Fiscal Risk & Credit Quality — 6.0/10 (Bullish)
The May downgrade of U.S. sovereign credit and ongoing wide deficits keep a slow-burn bid under gold. Any wobble in auctions or debt-ceiling theatrics would push this higher.
9) Jewelry & Tech Demand — 5.0/10 (Slightly Bearish/neutral short-term)
Record prices hit Q2 jewelry volumes (-14% y/y to 341t), though India shows early signs of seasonal revival into festivals. Tech demand dipped ~2% y/y amid electronics softness. Physical demand is a brake on parabolic rallies.
10) Geopolitics (Ukraine, Middle East, Taiwan risk, etc.) — 5.5/10 (Event-Bullish)
Headlines remain volatile—Israeli strikes on Iran-aligned Houthis and ongoing Ukraine politics keep a latent safe-haven premium. Spikes are event-driven unless escalation persists.
________________________________________
🌐 Other Catalysts to Watch
• Crypto Cross-Flows (5/10): Sharp crypto drawdowns can funnel short-term interest into gold, though correlation remains inconsistent.
• Bullion Logistics & Refining (New): U.S. tariff ambiguity on kilobars introduces intermittent premiums and arbitrage opportunities between Zurich–London–NY.
• Physical Supply Disruptions (4/10): Always idiosyncratic; currently secondary to macro.
| Rank | Catalyst | Score/10 | Current Impact | Direction | Notes |
| ---- | ------------------------------------------ | -------: | -------------- | ------------------------------ | ------------------------------------------------------------ |
| 1 | Fed path & real yields | **9.5** | Very High | **Bullish** | Dovish tilt; cuts now live for Sept. |
| 2 | Central-bank buying | **8.5** | High | **Bullish** | Ongoing official demand; PBoC keeps adding. |
| 3 | Trade/tariff shock (incl. bullion tariffs) | **8.0** | High | **Bullish** | Broad tariffs + bullion rules raise premia & inflation risk. |
| 4 | U.S. dollar trend | **7.5** | High | **Bullish** | DXY softer post-Jackson Hole; less drag on gold. |
| 5 | ETF/institutional flows | **7.5** | High | **Bullish** | Biggest inflows in 5 yrs; GLD holdings high. |
| 6 | Systematic/CTA flows | **6.5** | Moderate | **Mixed** | Options/CTA activity driving overshoots both ways. |
| 7 | China property stress | **6.0** | Moderate | **Bullish** | Structural drag supports safe-haven demand. |
| 8 | U.S. fiscal/credit risk | **6.0** | Moderate | **Bullish** | Downgrade + deficits maintain hedge demand. |
| 9 | Jewelry/tech demand | **5.0** | Low | **Neutral → Slightly Bearish** | Jewelry volumes fell 14% y/y; festivals could revive. |
| 10 | Geopolitics (broad) | **5.5** | Low–Mod | **Bullish (event-driven)** | Episodic; not the primary driver now. |
NEO IS COMING BACK FROM 262 DAYS FOR NEW INCREASENEW looks depending low time frame, interesting for day trade, which allows it same time to become a follow coin.
NEO is one of the best coins at this moment to follow for confirmations.
AUDJPY potential shorts due weaker than expected China eco data.Industrial output grew by 5.7% year-on-year in July, down from 6.8% in June, marking the slowest growth since November 2024. This fell short of the 5.9% forecast by analysts in a Reuters poll and 5.82% by Wind.
Retail sales, a key gauge of consumption, rose by 3.7% year-on-year in July, down from 4.8% in June and below the expected 4.6% (Reuters) and 4.87% (Wind). This was the slowest growth since December 2024.
The reason for this trade idea is that Australia ranks as China’s seventh-largest trading partner overall, based on data from the Australian Department of Foreign Affairs and Trade and Chinese trade reports. Australia is China’s fifth-largest source of imports (primarily commodities like iron ore, coal, and natural gas) and tenth-largest export destination. Any news emerging from China has the potential to impact the Australian dollar.

Tuesday’s triple risk: Tariffs, RBA rate cut, and U.S. inflationTraders face a busy Tuesday with developments on U.S. China trade talks, a RBA policy decision, and the latest U.S. inflation data.
U.S. China tariff deadline – Tuesday
The current truce between the U.S. and China is set to expire on 12 August, with U.S. Commerce Secretary Lutnick indicating it will likely be extended by 90 days. China may also face an additional 25% tariff on Russian oil imports, like measures already applied to India.
RBA announcement – Tuesday
The Reserve Bank of Australia is widely expected to cut rates, with a Reuters poll showing all 40 surveyed economists anticipating a 25bp reduction to 3.60%. The broader market is pricing a 98% probability of that outcome and a 2% chance of a larger 50bp cut.
U.S. CPI – Tuesday
Headline U.S. CPI for July is expected to rise 0.2% month-on-month taking the annual rate to 2.8% from 2.7%. Wells Fargo notes that the figures may show further signs of higher tariffs feeding into consumer prices.
JD Options Ahead of EarningsIf you haven`t bought JD before the recent rally:
Now analyzing the options chain and the chart patterns of JD prior to the earnings report this week,
I would consider purchasing the 32.50usd strike price Calls with
an expiration date of 2026-1-16,
for a premium of approximately $3.10.
If these options prove to be profitable prior to the earnings release, I would sell at least half of them.
Disclosure: I am part of Trade Nation's Influencer program and receive a monthly fee for using their TradingView charts in my analysis.

$CNIRYY -China CPI Data Beats Forecasts (July/2025)ECONOMICS:CNIRYY
July/2025
source: National Bureau of Statistics of China
- China’s consumer prices were flat yoy in July 2025,
surpassing expectations for a 0.1% decline and following a 0.1% rise in June.
Non-food prices picked up, supported by Beijing’s consumer goods subsidies. Meanwhile, producer prices fell 3.6%, extending declines for the 34th month and holding at the steepest drop since July 2023.
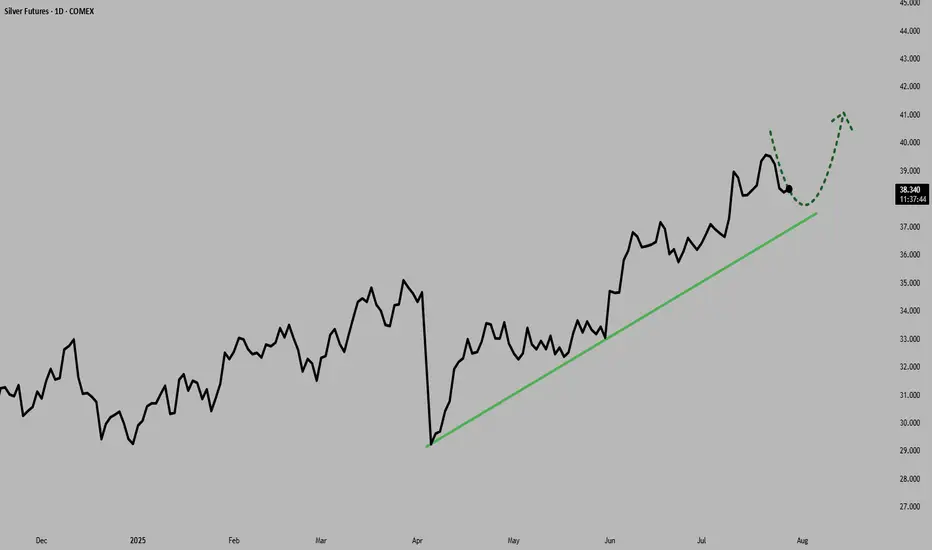
Silver Near $40: Deficits and Demand Fuel the RallySilver prices surged to multi-year highs in July 2025, driven by an extraordinary convergence of bullish factors, pushing prices above $39 per ounce, levels last seen in 2011.
Silver’s rally, supported by robust industrial demand and safe-haven inflows, aligns with traditional patterns as the U.S. dollar has weakened over 2.3% over the recent period.
Macroeconomic Drivers and the U.S. Dollar
Silver's rally is unfolding around shifting macro conditions. The Federal Reserve has kept interest rates at a restrictive 4.25-4.50% throughout 2025 due to persistently high inflation (2.7% YoY). However, expectations for more rate cuts are growing, with the CME FedWatch tool showing a 59.8% probability of a cut at the September meeting as of July 28.
Adding to the complexity, U.S. trade policies have triggered significant market volatility and raised concerns over a potential supply shock. The U.S. administration has imposed steep 30% tariffs on imports from Mexico, set to resume on August 1. This has heightened fears, as Mexico is the world’s largest silver producer and supplies over half of U.S. silver imports.
But macro drivers aren’t the full story. The real force behind silver’s rally lies in the physical market itself. A structural supply deficit, escalating industrial demand, and growing investor appetite from Asia and North America, are proving to be far more pivotal than shifting rates or a softer dollar.
Physical Market Dislocation and Industrial Demand
The year 2025 marks the fifth consecutive year of a structural deficit in the global silver market, and the imbalance between supply and demand shows no sign of easing.
With minimal new mining capacity expected to come online and lengthy lead times for project development, supply constraints are structural rather than temporary.
Since 2021, the cumulative shortfall has reached nearly 800 million ounces (25,000 tons), steadily drawing down available inventories and tightening the market.
Industrial demand remains the central pillar of silver’s bull market. Forecasts for 2025 project record consumption of roughly 700 million ounces, driven by rapid adoption in green technologies and digital infrastructure. The electrical and electronics sector, which includes solar photovoltaics (PV), consumer electronics, automotive electronics, power grids, and 5G networks, has increased its silver usage by 51% since 2016.
Solar PV alone consumed approximately 197.6 million ounces in 2024, a record largely driven by China’s 45% expansion in solar capacity. With global EV production expected to approach 20 million units in 2025, automotive silver demand alone could exceed 90 million ounces.
Together, persistent deficits, accelerating industrial consumption, and capital flowing into physically backed investment vehicles are creating a market where available silver is increasingly scarce, amplifying upside pressure on prices regardless of short-term macroeconomic shifts.
COMEX silver inventories peaked at 504.72 million ounces on May 11 but have since eased back to levels last seen on April 24, indicating a recovery in demand following the large accumulation in US inventories post-tariff shock.
Positioning and Ratios Favour Gains
With net inflows of 95 million ounces in the first half of 2025, silver ETP investment has already surpassed the total for all of last year. By June 30, global silver ETP holdings reached 1.13 billion ounces, just 7% below their highest level since the peak of 1.21 billion ounces in February 2021
Futures positioning has also surged , with long positions up 163% over six months. These factors have helped propel silver prices over 35% higher year-to-date, building on a 21% gain in 2024.
The iShares SLV ETF netted inflows of $1,467.5 million over the past 3 months.
Physical silver investment demand remains robust, with significant buying from Asian markets. India, the world’s leading silver importer, saw record purchases of physical bullion and silver-backed ETFs during the first six months of 2025.
The gold-to-silver ratio, currently in the late 80s, remains historically elevated, suggesting silver remains significantly undervalued compared to gold. This indicates substantial upside potential for silver, especially given persistent market deficits, rising industrial and investment demand, and gold rising at the same time.
Hypothetical Trade Set-up
The silver market’s bullish fundamentals appear increasingly robust. Investors may consider accumulating silver positions, viewing short-term consolidations as attractive buying opportunities amid the compelling long-term outlook.
Options open interest for the September contract shows a bullish bias with a put/call ratio of 0.82 and high call interest at the far out-of-the-money call strike of $45 per ounce.
To express a bullish view on silver, investors can deploy a long position in CME Silver futures expiring in September. A hypothetical trade setup for this view is described below.
● Entry: $38.00 per ounce
● Target 1: $40.00 per ounce
● Target 2 (extension): $42.00 per ounce (if Fed easing in September coincides with physical tightness)
● Stop Loss: $36.70 per ounce
● Profit at Target 1: $10,000
● Profit at Target 2: $20,000
● Loss at Stop: $6,500
● Reward-to-risk ratio: 1.54 (Target 1) and 3.08 (Target 2)
Alternatively, investors can exercise the same view using CME Micro Silver futures, which offer smaller notional positions and more flexibility. Each Micro contract is priced in USD per ounce and represents 1,000 ounces of silver, compared to 5,000 ounces for the standard contract.
MARKET DATA
CME Real-time Market Data helps identify trading set-ups and express market views better. If you have futures in your trading portfolio, you can check out on CME Group data plans available that suit your trading needs tradingview.com/cme .
DISCLAIMER
This case study is for educational purposes only and does not constitute investment recommendations or advice. Nor are they used to promote any specific products, or services.
Trading or investment ideas cited here are for illustration only, as an integral part of a case study to demonstrate the fundamental concepts in risk management or trading under the market scenarios being discussed. Please read the FULL DISCLAIMER the link to which is provided in our profile description.
China50 Target Locked | Long Setup via Thief Strategy🏴☠️ CHINA50 Market Robbery Blueprint 🔥 | Thief Trading Style (Swing/Day Plan)
🌍 Hey Money Makers, Chart Hackers, and Global Robbers! 💰🤑💸
Welcome to the new Heist Plan by your favorite thief in the game — this time targeting the CHINA50 Index CFD like a smooth criminal on the charts. 🎯📊
This is not your average technical analysis — it's a strategic robbery based on Thief Trading Style™, blending deep technical + fundamental analysis, market psychology, and raw trader instincts.
💼 THE SETUP — PREPARE FOR THE ROBBERY 🎯
We're looking at a bullish operation, setting up to break into the high-value vaults near a high-risk, high-reward resistance zone — beware, it's a high-voltage trap area where pro sellers and bearish robbers set their ambush. ⚡🔌
This plan includes a layered DCA-style entry, aiming for max profit with controlled risk. Chart alarms on, mindset ready. 🧠📈🔔
🟢 ENTRY: "The Robbery Begins"
📍 Zone-1 Buy: Near 0.63700 after MA pullback
📍 Zone-2 Buy: Near 0.62800 deeper pullback
🛠️ Entry Style: Limit Orders + DCA Layering
🎯 Wait for MA crossover confirmations and price reaction zones — don’t chase, trap the market.
🔻 STOP LOSS: "Plan the Escape Route"
⛔ SL for Pullback-1: 13540 (4H swing low)
⛔ SL for Pullback-2: 13350
📌 SL placement depends on your position sizing & risk management. Control the loss; live to rob another day. 🎭💼
🎯 TARGET ZONE: “Cash Out Point”
💸 First TP: 14100
🏁 Let the profit ride if momentum allows. Use a trailing SL once it moves in your favor to lock in gains.
👀 Scalpers Note:
Only play the long side. If your capital is heavy, take early moves. If you’re light, swing it with the gang. Stay on the bullish train and avoid shorting traps. Use tight trailing SL.
🔎 THE STORY BEHIND THE HEIST – WHY BULLISH?
CHINA50 shows bullish momentum driven by:
💹 Technical bounce off major support
🌏 Macroeconomic & geopolitical sentiment
📰 Volume + sentiment shift (risk-on)
📈 Cross-market index confirmation
🧠 Smart traders are preparing, not reacting. Stay ahead of the herd.
👉 For deeper insight, refer to:
✅ Macro Reports
✅ COT Data
✅ Intermarket Correlations
✅ CHINA-specific index outlooks
⚠️ RISK WARNING – TRADING EVENTS & VOLATILITY
🗓️ News releases can flip sentiment fast — we advise:
❌ Avoid new positions during high-impact events
🔁 Use trailing SLs to protect profit
🔔 Always manage position sizing and alerts wisely
❤️ SUPPORT THE CREW | BOOST THE PLAN
Love this analysis? Smash that Boost Button to power the team.
Join the Thief Squad and trade like legends — Steal Smart, Trade Sharp. 💥💪💰
Every day in the market is a new heist opportunity — if you have a plan. Stay tuned for more wild robbery blueprints.
📌 This is not financial advice. Trade at your own risk. Adjust based on your personal strategy and capital. Market conditions evolve fast — stay updated, stay alert.

China's Economic Storm: A Global Wake-Up CallChina, the world’s second-largest economy, is facing a perfect storm of demographic collapse, a housing market crash, and a strategic sell-off of US treasuries. These interconnected crises threaten not only China’s stability but also global markets, impacting forex traders, investors, and businesses worldwide. This article unpacks the unfolding challenges and their far-reaching implications, as discussed in our latest Edge Forex podcast.
A Demographic Time Bomb
China’s population is aging faster than any major economy in history, driven by a fertility rate of just 1.1–1.2 children per woman—well below the 2.1 needed to sustain a population. The legacy of the one-child policy has left a shrinking workforce and a projected 400 million people over 65 by 2050, comprising one-third of the population. This demographic cliff strains pensions and healthcare systems while youth unemployment, reported at 20% in 2023, fuels social discontent. Government subsidies to boost birth rates have failed, as high living costs and a drying job market deter young couples from starting families.
The result? A shrinking labor force, slowing GDP growth, and brewing social unrest. By 2080, China’s population could halve, leaving empty cities and businesses without workers. This isn’t just a numbers game—it’s a crisis that could derail China’s economic engine for decades.
Housing Market Collapse: A Crumbling Pillar
Once the backbone of China’s economic miracle, the housing sector is now a liability. New home prices have plummeted 23–25%, with monthly declines of 6–7%. Accounting for 25–30% of GDP, this sector’s collapse is catastrophic. The liquidation of Evergrande in 2024, with $310 billion in debt, exposed the over-leveraged nature of China’s property market. Goldman Sachs estimates $13 trillion (93 trillion RMB) in excess inventory—millions of empty condominiums in ghost towns, with malls and highways leading nowhere.
Housing represents 60–70% of Chinese household wealth, so falling prices are crushing consumer confidence and spending. Local governments, reliant on land sales, face budget crises, and an 8 trillion RMB stimulus has fallen short. This slow-motion crash, reminiscent of Japan’s 1989 property bubble but worsened by demographic decline, threatens financial stability and global economic growth.
US Treasury Sell-Off: A High-Stakes Gamble
In 2024, China slashed its US mortgage-backed securities holdings by 20%, part of a broader sell-off of US treasuries. This isn’t a choice but a necessity, driven by declining export revenues and insufficient funds to meet domestic and international obligations. The sell-off, fueled by a trade war and a sharp drop in US exports post-tariffs, forces China to liquidate treasuries to access US dollars. However, this move risks raising US interest rates, disrupting global housing markets, and escalating geopolitical tensions.
Charts show China’s treasury holdings peaking around 2005 before a sharp decline, while other economies like the Eurozone and UK increase their purchases. This shift could flood bond markets, pushing up yields and affecting forex pairs like USD/CNY. While short-term relief for China, this sell-off is a long-term gamble that could isolate it financially and signal deeper economic distress.
Global Implications for Markets and Forex
China’s export slump, treasury sell-offs, and housing crisis paint a picture of a nation losing its economic grip. For forex traders, the weakening Chinese Yuan against the US Dollar (USD/CNY) is a key focus, as economic stagnation and treasury sales pressure the currency. Higher US interest rates from these sell-offs could strengthen the USD, impacting global currency pairs and emerging markets. Investors in Chinese equities or real estate face risks from declining growth prospects, while businesses reliant on Chinese demand—think commodities or luxury goods—may see revenues shrink.
At Edge Forex, we see this as a red flag for long-term investors. Diversifying into assets less tied to China, such as Eurozone or UK markets absorbing treasury sales, could mitigate risks. The global ripple effects are undeniable: China’s slowdown could depress demand, disrupt bond markets, and create volatility across forex and equity markets.
What’s Next for Traders and Investors?
Monitor USD/CNY: Expect volatility as China’s economic woes weaken the Yuan.
Track Global Rates: Treasury sell-offs could push up US yields, impacting housing and forex markets.
Diversify Portfolios: Reduce exposure to Chinese assets and explore26% of Chinese household wealth, so falling prices erode consumer confidence.

CNY/USD Trend since 06 2007. Channel. Reversal zone.Logarithm. Time frame 1 week. At the moment, the currency is stronger than the dollar.
The main trend is a descending channel. The price is in it now.
Secondary trend — breakout of the descending trend line. Price growth to the median of the channel, and in case of its breakthrough, to the resistance. If not, then a pullback to the lower zone of the channel.
Local trend — The nearest events and news background, which can affect (not necessarily) locally (movements to the median of the channel, i.e., the middle, if it is positive) on the yuan rate. This, in less than 1 month, namely from October 22 to 24, 2024 will be held 7.16 XVI BRICS summit (short for Brazil, Russia, India, China, South Africa) in Russia in Kazan.
Line graph for visualization.

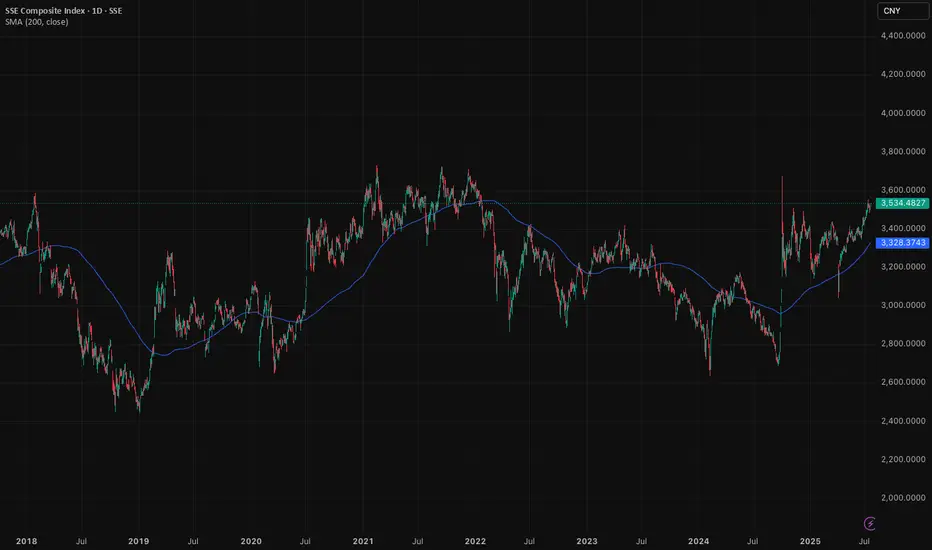
Shanghai Composite: Double bottom signals potential upsideChinese stocks are not for the faint-hearted. It's a market with a lot of volatility, swings, and roundabouts. Despite this, we've been keeping a close eye on the Shanghai Composite Index over the past few weeks and like the pattern we are seeing emerge.
As of the time of writing, the Shanghai Composite Index trades in the 3,500 range. A clear double bottom emerged in September and January last year, as indicated in the chart. We think this is a bullish pattern. When markets test the lows twice and rebound, conviction grows. The worst, it seems, is maybe behind us.
New trades should take important note and understand that Shanghai-listed stocks differ greatly from the H-shares trading in Hong Kong. The Shanghai Composite primarily includes A-shares, domestic Chinese companies driven by local sentiment and liquidity. H-shares, though still Chinese firms, list offshore in Hong Kong and often reflect global investor attitudes rather than local momentum.
Understanding your instrument is crucial. While Shanghai A-shares capture China's domestic economic pulse, H-shares in Hong Kong frequently mirror global risk appetite and geopolitical narratives. Our bullish case lies specifically with the Shanghai market. It is a bet on China's internal economic recovery, supportive policy measures, and improving investor sentiment.
China’s economic stabilisation is underway. Stimulus measures from Beijing are gaining traction. Property market stabilisation efforts (which are medium term in nature) and easing monetary policy signal confidence. Domestic investors, increasingly optimistic, are positioned to drive a sustained rally.
The Shanghai Composite Index could see upside towards the 4,000 and then 4,500-level in the coming years, if the rally continues. Our conviction rests on improving domestic fundamentals, policy tailwinds, and powerful market sentiment unique to mainland China's equity landscape.
Caution is important, given the volatility nature of the index.
The forecasts provided herein are intended for informational purposes only and should not be construed as guarantees of future performance. This is an example only to enhance a consumer's understanding of the strategy being described above and is not to be taken as Blueberry Markets providing personal advice.
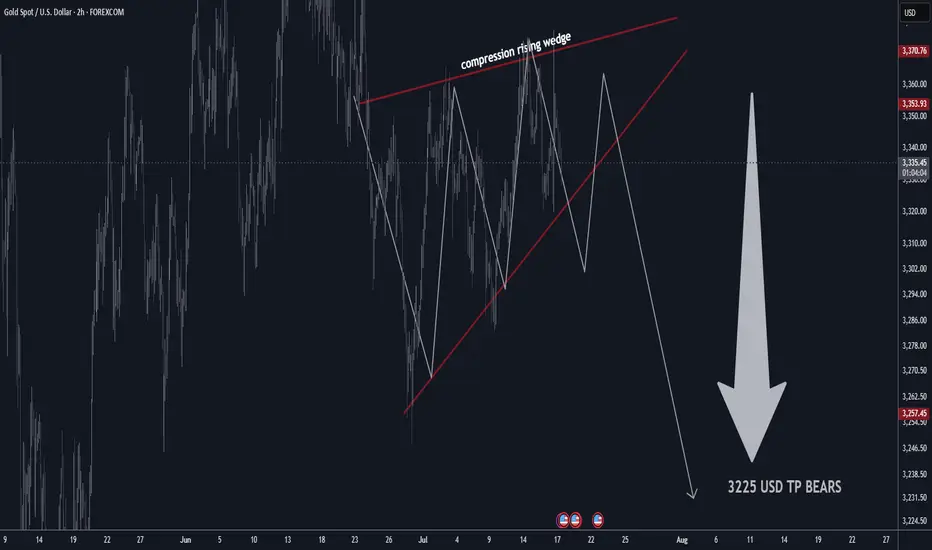
GOLD H2 Rising Wedge Expecting SellOFF TP BEARS 3225 USD📊 Gold Technical Outlook Update – H4 & 2H Chart
📰 Latest Summary Headlines
• Gold stalls near highs as technical compression signals possible breakdown
• Bearish rising wedge on 2-hour chart hints at sharp move lower
• Market volatility stays elevated amid global economic risks
• Short-term sellers targeting $3,225 if wedge pattern breaks
________________________________________
🏆 Market Overview
• Gold remains in a choppy range, struggling to clear key resistance.
• 2H Chart: Bearish rising wedge pattern identified, showing compression—expecting a potential breakdown soon.
• Overhead resistances: $3,410 / $3,460 USD will likely cap further upside.
• Major supports: $3,160 / $3,240 USD.
• If support fails, next key bear target is $3,225 USD.
• Range trading remains favored for now.
• Volatility likely to persist with no major bullish headlines on the horizon.
________________________________________
⭐️ Recommended Trade Strategy
• Bearish Setup (2H): Short sell gold at market on wedge breakdown.
o Stop loss: Above recent highs (set according to your risk tolerance and latest 2H swing high).
o Take profit: Target $3,225 USD.
• Continue to focus on selling near resistance, buying near support.
• Momentum: Watch for sharp moves as wedge resolves—be nimble!
• Always manage risk and adjust stop as price develops.
________________________________________
💡 Gold Market Highlights
• Safe-haven demand still strong due to tariffs, geopolitical tension, and U.S. fiscal concerns.
• Central banks & investors remain net buyers, but jewelry demand slides at high prices.
• Price action is dominated by institutional flows, with banks forecasting potential for gold above $4,000 next year—but short-term correction likely if wedge breaks.
• Current price: ~$3,358 per ounce. Compression suggests a larger move coming soon.
________________________________________
Summary:
Gold is at a crossroads, with a bearish wedge pattern building on the 2-hour chart. A breakdown could see a quick move to $3,225. Short sellers should act on confirmation, while bulls will look to reload at key support. Stay tactical!
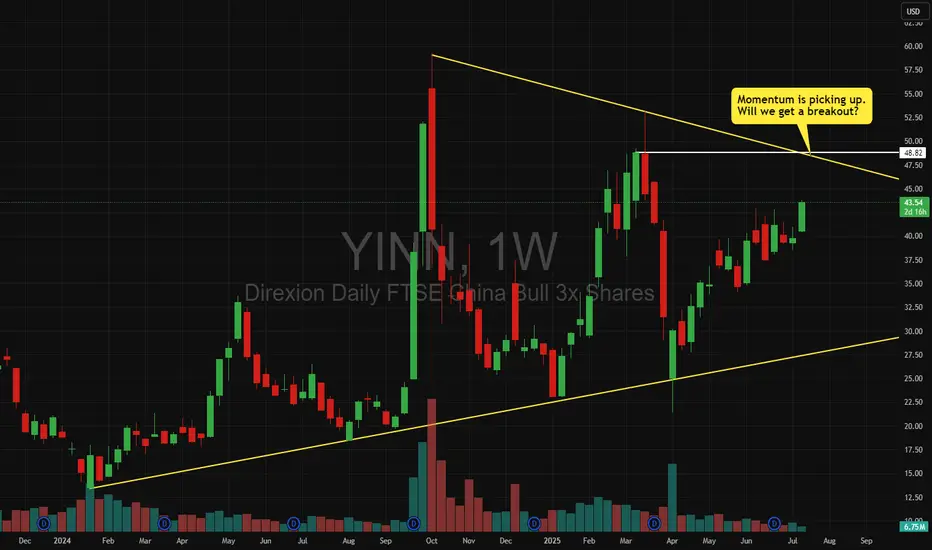
YINN - We could get a bullish breakout of the triangleMomentum seems to be picking up.
Will we a break out of the triangle?
Let's watch the $48 level.
Will China's strong growth and ongoing stimulus lift the HK50?
Despite US-China trade tensions and weak domestic demand, China’s GDP growth has surpassed its 5% target for the first half of the year. According to the National Bureau of Statistics, Q2 GDP grew 5.2% YoY, with authorities noting that stimulus measures aimed at boosting consumption had some effect. Reflecting this momentum, Morgan Stanley raised its 2024 China growth forecast from 4.2% to 4.5%, while Deutsche Bank revised its outlook to 4.7%, a 0.2 percentage point increase.
HK50 maintained its steady uptrend, marking a new 4-month high. Both EMAs widen the gap, indicating the potential continuation of bullish momentum. If HK50 breaches above the recent high at 24600, the index could gain upward momentum toward the next resistance at 24900. Conversely, if HK50 breaks below the support at 24100, the index may retreat to 23730.
