USDJPY – Supply Reaction Confirmed, Structure Is ShiftingIn the previous analysis, price was expected to react around the 157.270 – 157.758 supply zone, and that reaction played out as anticipated.
After two days, the market has now formed a CHOCH (Change of Character) on the 1H timeframe, signaling a potential shift in short-term structure.
At the moment, price is trading inside a key supply area:
156.785 – 157.000
From this zone, I expect price to resume its corrective move, and this time, approach the newly formed trendline and break it, allowing the bearish leg to extend further.
Under this scenario, the minimum downside objective stands around 156.200.
If bearish confirmation remains valid, continuation toward the 156.000 area also becomes achievable.
At this stage, the market has already delivered the required structural signal.
From here, price behavior around this supply zone and the trendline will define the next phase.
`Pouryabdi
Choch

XAUUSD Premium Zone Rejection & Weak Bullish MomentumXAUUSD | H4 – Premium Zone Rejection | Sell Bias On the H4 timeframe, Gold formed a double top, followed by a pullback and continued respect of the bullish trendline. After the second touch, price broke the bearish trendline, showing strong bullish momentum.
The bullish move extended into the premium zone, where the market printed a bearish Break of Structure (BOS) followed by a bullish Change of Character (CHOCH). Price is now trading near the All-Time High (ATH).
Clear rejection is visible from the premium zone (4465–4492), while MACD shows weakening bullish momentum, suggesting a potential reversal from this area.
Sell Entry: 4460–4468
Stop Loss (Short-term): 4515
Stop Loss (Long-term): 4590
Take Profit Targets:
4305,4100,4065
According to my analysis, the market may move downside.
What’s your view SELL or BUY?
Comment below

Buy Side Liquidity Sweep & Bearish ContinuationGBPUSD H1
Consolidation Bullish BOS Order Block push Week High (Buy-Side Liquidity sweep).
After premium rejection, price shows distribution and a bearish shift (CHoCH).
Expectation: Sell-Side Liquidity (SSL) hunt, followed by HTF SLL toward 1.33000.

BTCUSD.P — Wick Above High ≠ Bullish Break of Structure📌 BTCUSD.P — Wick Above High ≠ Bullish Break of Structure
Timeframe: 15m
Market: BTC Perpetual (Bybit)
🧠 Key Observation
Price did not break structure bullishly here.
Although BTC wicked above the prior high, there was no full-bodied close above the previous high’s wick. That distinction matters.
A wick alone shows reach.
Structure requires acceptance.
🔍 What This Means
The prior high was tested and liquidity was taken
Buyers failed to secure a close above resistance
Price immediately stalled rather than expanding
This behavior is consistent with a liquidity sweep, not a confirmed bullish shift in market structure.
⚠️ Why Early Longs Are Dangerous Here
Entering long on the first touch or wick break:
Assumes continuation before confirmation
Exposes the trade to a sweep-and-reverse scenario
Treats intent as fact
In this context, an early long can easily become exit liquidity.
✅ What a Real Bullish Break Would Require
For this to qualify as a valid Bullish BoS:
A decisive candle body close above the previous high’s wick
Follow-through or acceptance above the level
No immediate reclaim back below resistance
Until then, structure remains unbroken.
🧭 Execution Guidance
Patience > prediction
Let the market prove acceptance
If price reclaims the level with strength, bias can flip
If price rejects, the sweep thesis gains validity
Structure is not about being early.
It’s about being right after confirmation.
🧾 Final Thought
Wicks hunt liquidity.
Bodies establish control.
Knowing the difference keeps you solvent.
❗ Disclaimer
Educational purposes only.
Not financial advice.

ETH H1 Liquidity Magnet at 2,886 BPR Mid-Line Reaction Framework📝 Description
ETH on H1 remains in a corrective / range-bound structure. A high-quality liquidity pool sits at 2,886, perfectly aligned with the BPR mid-line, making it the most logical draw-on-price for any fresh move. Markets typically seek liquidity before initiating a new leg, so a rotation into this zone is the base expectation.
________________________________________
📈 Analysis (Scenario-Based | Non-Signal)
Primary Liquidity Scenario:
• Price is expected to rotate toward 2,886 to tap resting liquidity at the BPR mid-line
Bullish Reaction Scenario:
• A sweep of the prior low at 2,886 with acceptance can open upside toward 3,000 and 3,060
Failure Scenario:
• Failure to hold 2,886 shifts the draw toward 2,840 and 2,775
________________________________________
🎯 ICT & SMC Notes
• Strong liquidity concentration at 2,886
• Liquidity required before expansion
• Sweep + hold favors mean reversion higher
• Acceptance below favors continuation lower
________________________________________
🧩 Summary
This is a liquidity-mapping framework, not a trade signal. ETH is likely drawn toward 2,886 first. A clean sweep and defense there opens upside toward 3,000 and 3,060. Failure to reclaim that zone increases probability of continuation into 2,840 and 2,775. The reaction at 2,886 defines the next leg.
________________________________________
⚠️ Risk Disclosure
Trading involves substantial risk and may result in capital loss. This analysis is for educational purposes only and does not constitute financial advice. Always apply proper risk management, predefined stop-loss levels, and disciplined position sizing aligned with your trading plan.

Gold Continues to Search for New HighsHello, smart and prosperous friends — what’s your view on OANDA:XAUUSD ?
Today, gold continues to maintain its bullish momentum and is currently trading around USD 4,305, marking its highest level since October 21. The main driver remains expectations that the Federal Reserve will continue cutting interest rates, which puts pressure on the U.S. dollar and supports the precious metal.
In the near term, market attention is focused on the U.S. Non-Farm Payrolls (NFP) report, along with retail sales and PMI data scheduled for release today. These key indicators could directly influence monetary policy expectations and gold price volatility.
From a technical perspective, the bullish structure remains clearly intact. Strong demand zones below are holding firmly, while recent pullbacks appear to be purely technical in nature.
Notably, the USD 4,350–4,360 area is showing signs of a weak high, suggesting there may still be room for price to sweep liquidity to the upside. As long as gold holds above its structural support, the preferred scenario remains buying on pullbacks, rather than selling against the prevailing trend.
What’s your take on gold prices today? Share your thoughts 👇.

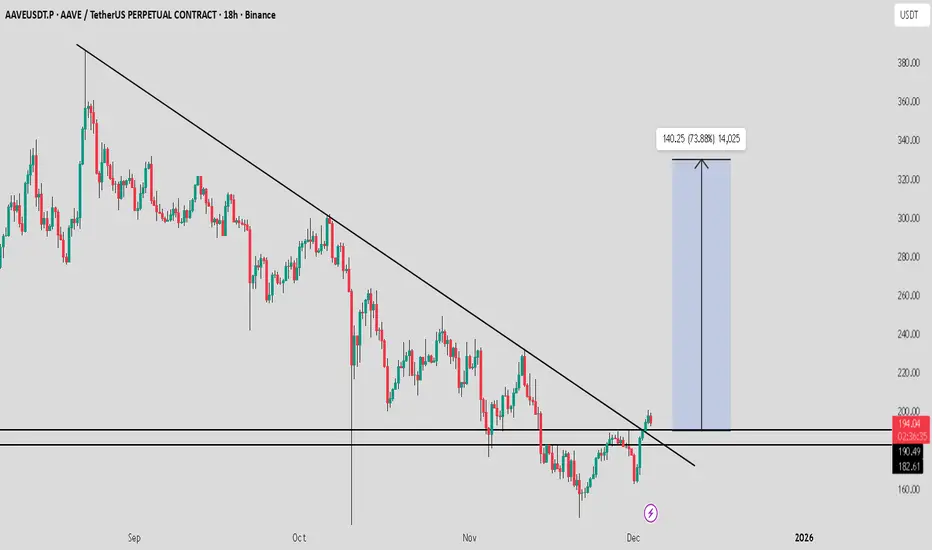
AAVE Holding Strong — Watching for Breakout Reaction Toward $250AAVE / USDT is holding strong above the marked horizontal levels. If price reacts with clear strength from this zone, it could offer a solid opportunity for a move towards $250–$320. Wait for clean confirmation before entering and manage risk wisely.
GBPUSD Retracement Idea for a new Lower HighHi Traders!
Since my last idea GU reached my short target around 1.30000. I'm now looking for price to retrace to a previous bearish BOS area around 1.32500-1.33000. If price can create a new lower high in that area we could possibly see more bearish movement. In addition, if DXY can hold around 99.000-99.500, and continue reversing to the upside I'd have a new swing target for GU at the next Daily OB around 1.29000-1.28500.
1st alert set just below 1.32500 in case price doesn't make it to my target.
*DISCLAIMER: I am not a financial advisor. The ideas and trades I take on my page are for educational and entertainment purposes only. I'm just showing you guys how I trade. Remember, trading of any kind involves risk. Your investments are solely your responsibility and not mine.*

GBP/USD – 4H Technical OutlookMarket Bias:
Range (buyers holding support, sellers defending resistance)
Key Levels:
• Resistance: Major 4H zone where sellers are consistently active
• Support: Strong 4H demand + order block recently respected
• Market Structure: Price has already formed a higher high, signaling bullish intentions
Reasoning:
Price is currently trapped between a strong resistance above and a strong support/order block below.
Buyers successfully defended the support, creating a higher high — a sign of bullish strength.
However, sellers are still aggressively positioned at the resistance zone, creating a tug-of-war scenario.
Trade Idea:
Look for bullish continuation only if support continues to hold and price rejects the zone with strength.
Potential Entry:
• At/near the 4H support or after a clean bullish rejection candle
Stop Loss:
• Below the order block / support structure

Structure trainingHello friends
Well, you see that a spike has been made by the sellers and a bearish structure has formed.
So, be careful that after each spike, the price needs to take a break, so it either suffers or pullbacks, spikes again, and continues.
Now the question is, how do we know when our downtrend is over?
You need to be careful and wait for the weakness of sellers and the strength of buyers, the important signs of which I will tell you.
The first sign is the last spike, which requires our bottom to be broken by sharp sellers and the price to be reversed by sharp buyers. Here it is important that we set a higher ceiling and break this spike formed by sellers, which is also called CHOCH in a correction, which means the same change in structure.
Our second sign is the lower lows, which is also very important and of great importance because it shows the advantage of buyers and helps a lot.
And in the price pullback we can enter the trade with risk and capital management.
Our stop loss is placed below the last low or the last spike that you said and the target is double that R/R=2
*The win rate of this strategy is also 60*
*Trade safely with us*

Gold (XAU/USD) M30 Smart Money Setup – Price Action Analysis📊 Current Structure:
On the M30 timeframe, CHOCH (Change of Character) has formed around 4186, confirming a possible bearish shift in market structure. The previous low stands at 4004, which acts as a major liquidity zone and final bearish target.
🧠 Smart Money Concept Overview
After the CHOCH at 4186, Gold is expected to retrace to premium zones before continuing its bearish move. The market has created two Fair Value Gaps (FVGs) — potential supply areas where price may react.
⚙️ Key Zones
1️⃣ 1st FVG (4231 – 4246) → Minor retracement zone 🟠
2️⃣ 2nd FVG (4302 – 4322) → Strong supply zone 🔴
📍 Stop Loss (SL): 4346
🎯 Target (TP): 4001
🧭 Trading Plan
Wait for price to tap into any FVG zone (4231–4322).
Confirm bearish reaction using candlestick rejection or CHOCH on lower TFs (M5–M15).
Enter short positions aiming for the 4001 target.
Risk management: keep SL tight above 4346.
📉 Conclusion
Gold currently shows strong bearish pressure after CHOCH confirmation. Smart money traders will be looking for short entries from FVG zones toward the 4001 liquidity target. Manage your trade wisely and follow structure confirmation before entry. 🧩
💡 Disclaimer: This analysis is for educational purposes only. Always do your own research before trading. 📚

EURGBP | POSSIBLE BEARISH INTENT Price never tagged me in on the buy but is reacting very well from the 3HR OB
so now we wait to confirm that change then we can look to join in sells
Watch your charts !!

GBPUSD Bullish or Bearish?Hi Traders!
When analyzing this chart, price made a move to the downside making a low at 1.34000, came up to test 1.36000 to then revisit a daily OB at 1.32000 creating a bearish BOS. However, price didn't close below the previous daily OB low, and pushed back up to the resistance level at 1.36000. Price is now sitting in a range.
If a long presents itself, I would like to see a daily CHOCH happen, price closed above 1.36000 with strength (not just a wick), follow through with bullish confirmation, and 1.36000 retest/new support. Therefore, IMO, this move can still be viewed as a retracement within a bearish structure. For now, I'm waiting for price to show me a solid direction.
Good Luck to all!
*DISCLAIMER: I am not a financial advisor. The ideas and trades I take on my page are for educational and entertainment purposes only. I'm just showing you guys how I trade. Remember, trading of any kind involves risk. Your investments are solely your responsibility and not mine.*

Is the Retracement Over?Hi Traders!
GJ dipped in the 50% fib this past week, and bounced off the previous weekly OB again at 198.500. The retracement might be over, and I'm looking to enter a long swing trade. However, I'd like to see it bounce off the 4HR OB sitting at 199.500/.600 and make a return to the 4HR CHOCH around 199.000/.200 to determine my entry. If so, based on the Daily, I'd be swinging this trade to around 202 and 203. That'd also hit around a Weekly bearish OB.
*DISCLAIMER: I am not a financial advisor. The ideas and trades I take on my page are for educational and entertainment purposes only. I'm just showing you guys how I trade. Remember, trading of any kind involves risk. Your investments are solely your responsibility and not mine.*

BTC.D , Bitcoin Dominance Ready to RiseAfter a descending wedge pattern, Bitcoin Dominance has shown the first signs of an upward move. A CHoCH (Change of Character) has formed on the 4-hour timeframe, signaling a potential trend reversal.
We are now awaiting a retest of the broken resistance level before continuation of the bullish trend. However, the price might skip the retest and proceed directly higher.
Stay tuned for confirmation and manage your positions accordingly.

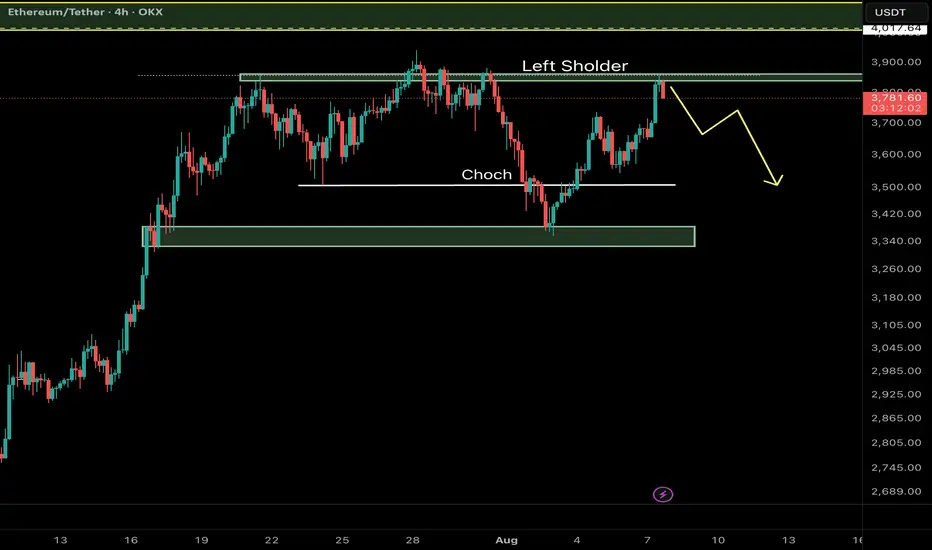
Ethereum (ETH/USDT) – Key Reversal Zone RetestAfter a major CHoCH (Change of Character) on the 4H timeframe, Ethereum has shown a strong bullish move from a high-probability demand zone and is now retesting a critical resistance area aligned with the Left Shoulder of a classic RTM pattern.
⸻
🔍 Key Technical Elements:
• CHoCH confirms the shift from a distribution phase to accumulation.
• Strong reaction from a demand zone near $3,340–$3,380.
• Price is now testing the Left Shoulder, which often acts as a reaction zone before continuation.
⸻
📌 Potential Scenarios:
🔼 Bullish Case (Primary):
If ETH breaks and closes above $3,870, a move toward the next liquidity pool around $4,010–$4,050 is likely.
🔽 Bearish Case (Alternative):
Failure to hold above the current resistance may lead to a pullback toward the $3,340–$3,380 demand zone for another accumulation attempt.
⸻
💡 Educational Note:
In RTM methodology, retests of the Left Shoulder after CHoCH are considered one of the most efficient entry zones — especially when confluence with liquidity voids or imbalance exists.
Follow for more Smart Money & RTM insights.
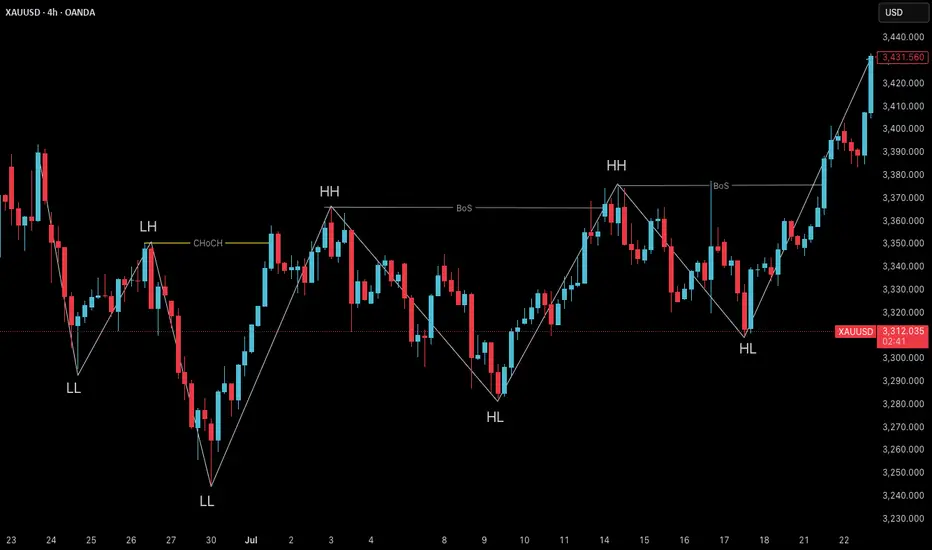
XAUUSD Smart Money Technical Analysis – Bullish Potential XAUUSD Smart Money Technical Analysis – Bullish Potential from Strong Support
Gold (XAUUSD) is currently trading around $3,291.780, showing a potential bullish reversal setup from the strong support zone after a clear liquidity sweep and market structure shifts.
🔍 Key Technical Highlights:
✅ Strong Support Zone (Demand)
Price is reacting from a major demand zone (Strong Low) between $3,275 – $3,225, a level that previously triggered bullish rallies.
Multiple Breaks of Structure (BOS) and CHoCH indicate previous bullish control and a possible re-accumulation phase.
✅ CHoCH Near Support
A recent Change of Character (CHoCH) around the support area shows the first signs of smart money accumulation.
Liquidity below recent lows has been swept, triggering possible bullish intent.
✅ Bullish FVG (Fair Value Gap)
A clear Bullish FVG remains unmitigated around the mid-range, offering target confluence at $3,349.560.
Price may aim to rebalance inefficiency and fill the FVG as part of the bullish move.
✅ Resistance Zone Above
The resistance area near $3,325 – $3,350 acts as a short-term target for long positions.
Further resistance lies at the Buy-Side Liquidity & Weak High zone around $3,450 if momentum sustains.
🧠 Smart Money Concept Interpretation:
Liquidity Grab: Price dipped into strong demand to collect sell-side liquidity before potential reversal.
CHoCH + BOS Alignment: Indicates the market may now transition into a bullish phase.
FVG as Magnet: Price is drawn toward unfilled value zones—ideal for bullish target projection.
🎯 Trade Idea (Educational Purposes Only):
Bias: Bullish
Entry: Around current zone ($3,290)
Target: $3,349.560 (FVG zone)
Invalidation/SL: Below strong low (~$3,225)

Trend Exhaustion Detected – Bearish Structure AheadUS100 (NASDAQ) 30-minute chart as of July 26, 2025, with technical insights based on the visible elements.
🔍 1. Trend Analysis
Primary Trend: Uptrend (bullish structure)
The price has been respecting a rising parallel channel, marked by:
Ascending support (lower boundary)
Ascending resistance (upper boundary)
Market structure shows:
Higher Highs (HH)
Higher Lows (HL)
✅ This indicates continuation of bullish momentum until structure breaks.
📐 2. Market Structure Elements
Structure Type Label on Chart Price Zone (approx.)
Break of Structure (BOS) BOS (center-left) ~22,950
Higher Low (HL) HL (2x) ~22,700 (1st), ~23,050 (2nd)
Higher High (HH) HH (2x) ~23,150 and ~23,300
Resistance Labelled ~23,300–23,320
Demand Zones Labelled ~22,450–22,700
🔁 Break of Structure (BOS)
The BOS occurred after a prior swing low was broken, followed by a new higher high, confirming a bullish shift.
🧱 3. Support / Resistance Analysis
🔼 Resistance Zone
The price is testing strong resistance around 23,300–23,320
Multiple rejections in this area
Trendline resistance also aligns here
A rejection arrow is drawn, indicating potential bearish reaction
🔽 Support Zone (Immediate)
23,180–23,220: highlighted green box is a local support block
If broken, likely to revisit 23,000–23,050, or even down to 22,900 range
🟩 4. Demand Zones
Zone 1:
22,450–22,600: Strong bullish reaction historically — likely to act as a key demand if a deeper pullback occurs
Zone 2:
22,850–22,950: Validated with prior accumulation & BOS event
🧠 5. Key Observations
Price is at a critical inflection zone:
Testing a resistance zone
At the upper trendline of an ascending channel
A bearish reaction is projected (black arrow)
Possibly targeting the green support zone around 23,180–23,220
If that fails, demand at ~23,000 will likely be tested
Ichimoku Cloud:
Currently price is above the cloud → still bullish
Cloud is thin → potential weakness or upcoming consolidation
⚠️ 6. Trading Bias & Setup Ideas
✅ Bullish Bias (if price holds above ~23,180)
Long entries can be considered on bullish reaction from support
Target: retest of 23,300–23,350 or even breakout continuation
❌ Bearish Bias (if breakdown below support)
Short entry valid below 23,180 with:
TP1: 23,050
TP2: 22,900
A breakdown from the ascending channel would signal trend exhaustion
🔚 Conclusion
Current Price: 23,298.4
Trend: Bullish, but at resistance
Next move: Watch for reaction at resistance and support box below
Bias: Neutral-to-bullish unless the structure breaks below ~23,180

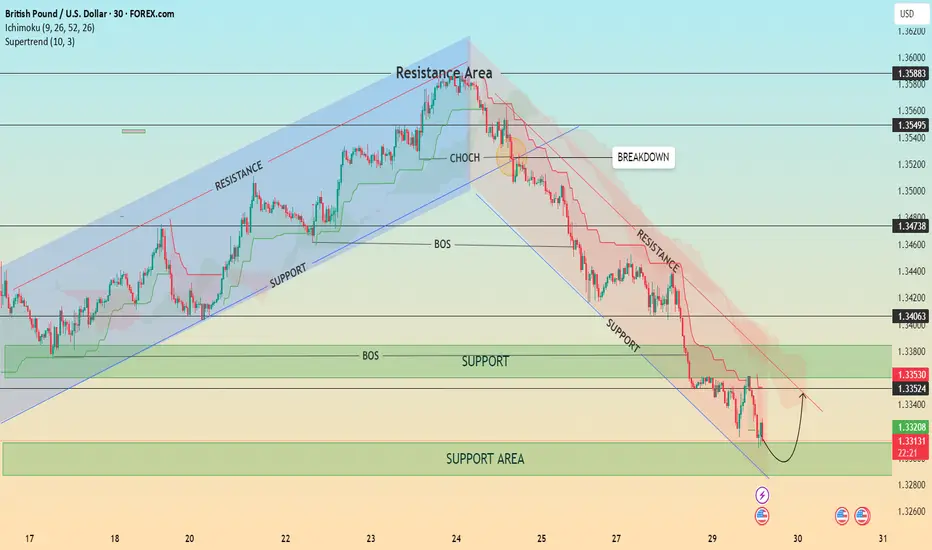
GBP/USD – Bearish Structure with Possible Short-Term Pullback📊 GBP/USD – Bearish Structure with Possible Short-Term Pullback
Timeframe: 30-Minute | Date: July 29, 2025
Price action recently broke down from a well-respected ascending channel, confirming a shift in market structure with a Change of Character (CHOCH) followed by a Break of Structure (BOS). Since then, GBP/USD has been respecting a descending trend channel, forming consistent lower highs and lower lows.
🔍 Current Setup:
Price is testing a major support area around 1.3300–1.3320.
A minor pullback is expected as indicated by the bullish wick rejections.
However, the overall bias remains bearish unless we break and hold above the 1.3353–1.3406 resistance zone and the descending trendline.
The Ichimoku Cloud and Supertrend both show bearish momentum.
📈 Potential Scenario:
Price may bounce from the support area and retest the upper boundary of the descending channel before resuming the bearish trend.
⚠️ Key Levels to Watch:
Resistance: 1.33530 / 1.34063 / 1.34738
Support: 1.33200 / 1.33000
💡 Structure Notes:
CHOCH = Trend Reversal Signal
BOS = Confirmation of Downtrend
Cloud = Dynamic Resistance
Gold 29 July – H4 Demand Holds, M15 Structure ShiftsGold (XAUUSD) Analysis – 29 July
The Mirror is Forming at 3310: Structure + Reaction in Focus
The market has successfully held the H4 demand zone, particularly near the critical level around 3310. This level is not just another number on the chart — it’s an inflection point. A possible first higher low or swing low, from which the next directional leg in gold could emerge.
Yesterday’s price action swept liquidity beneath this zone and then showed a strong bullish reaction. This isn’t just a bounce. It’s a behavioral shift — one that hints at absorption of selling pressure and the re-entry of aggressive buyers.
🔍 Structure Alignment: H4 + M15
On the H4 timeframe, price has stabilized within the demand zone.
Zooming into M15, we now see internal price action beginning to shift:
• First, a Change of Character (ChoCH) — the earliest clue that momentum is starting to turn.
• Then, a Break of Structure (BoS) to the upside — signaling potential bullish intent.
This multi-timeframe alignment — H4 support holding + M15 structure shifting — builds a strong case for a potential reversal and continuation of the uptrend.
📍 What Next?
The next step is to mark a refined M15 Point of Interest (POI) — a zone where price may pull back before making its next move upward.
We don’t chase price. We let it come to us.
✅ Look for Lower Timeframe Confirmation
Once price returns to your POI, it’s time to observe.
You’re not looking for obvious signals. You’re watching for subtle behavior —
a sharp reaction, a psychological flush, or a precise candle footprint that reveals intent.
The deeper signals aren’t always visible to the untrained eye — but they’re there for those who’ve studied the mirror.
( For those who know what to look for — this is where the sniper entry reveals itself. )
🎯 Summary
• Bias: Bullish — structure and reaction support long setups
• Plan: Wait for price to retest the M15 POI
• Execution: Only enter on confirmed lower timeframe intent and confluence
• Target: 120 pips (fixed, as per system)
• Stop Loss: 40 pips (always 1:3 R:R minimum)
📚 This is the kind of structure-based clarity we teach in The Chart is the Mirror .
Let the chart speak.
Let the structure guide you — not your emotion.
📘 Shared by @ChartIsMirror

ChoCH: The Quiet Shift Most Traders Ignore“Most traders chase price. Few notice when price quietly turns around.”
Before a trend ends, before a breakout fails, before a setup forms —
There’s often a silent clue: Change of Character (ChoCH) .
What is ChoCH?
Change of Character marks the first structural sign that the market may be reversing — not continuing.
It’s a break in the internal rhythm of price, often happening after a liquidity sweep or inside a key zone.
In simpler terms:
BoS = Continuation
ChoCH = Potential Reversal
Most traders treat ChoCH like a green light to enter... but that’s a mistake.
ChoCH alone doesn’t mean a trend is ready to reverse.
It only tells you the current trend has paused or cracked — not ended.
What matters more is:
– Where the ChoCH happens
– Why it happens
– What came before it
This is where context matters.
How I Use ChoCH in My Trading Framework:
My approach is built around multi-timeframe structure:
✅ H4 – Bias
✅ M15 – Setup Alignment
✅ M1 – Sniper Entry
So when I see a ChoCH on M15 , I ask:
Does this align with my H4 bias ?
Has price entered a key zone or swept liquidity before the shift?
If yes — I start watching closely.
If no — it’s likely just noise.
ChoCH without narrative is just confusion.
BoS vs ChoCH – Know the Difference:
• BoS (Break of Structure) confirms trend continuation
• ChoCH (Change of Character) hints at a trend shift
• They look similar on a chart — but their implications are opposite
Mistake to avoid: Entering just because ChoCH appeared
Better approach: Let it warn you , not trap you
🪞 Final Thought:
ChoCH is not an entry. It’s an invitation.
A quiet shift the market offers only to those still enough to see it.
Some notice it.
Fewer understand it.
Even fewer know what to do after.
That’s the difference between recognizing a change… and trading it with conviction.
💬 If this spoke to you, share your thoughts below.
There’s more beneath the surface — tell me what direction you'd like to explore next.
Some of the most powerful methods I use aren’t shared openly — but those who’ve seen them know why.
You’ll know where to look if it’s meant for you.
📘 Shared by @ChartIsMirror
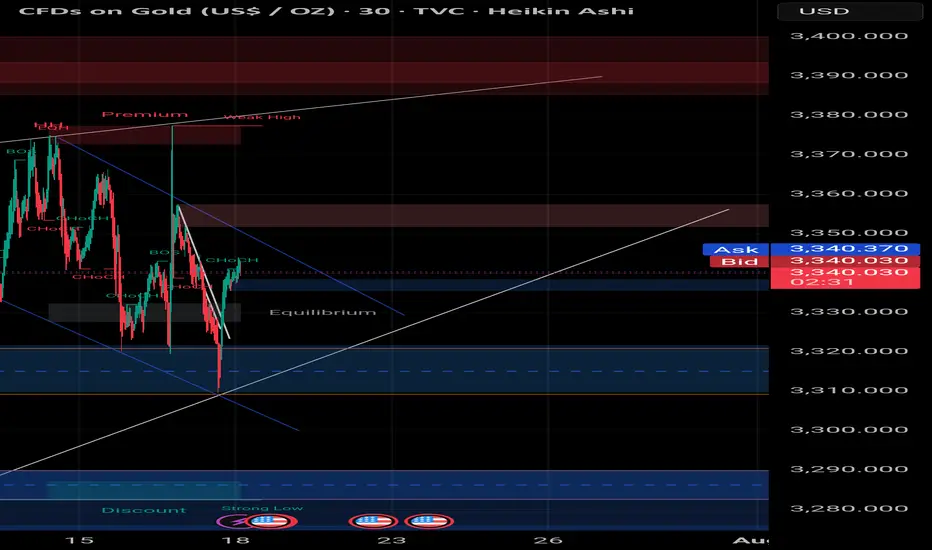
Smart Money Sell Setup on Gold (15-Min TF)# Smart Money Sell Setup on Gold (15-Min TF)
### 🔍 Market Context:
Gold has recently formed a strong bullish retracement after a sharp impulsive bearish move. Now, price has returned to a critical zone — the **Equilibrium level (EQ)** — which also aligns with a **valid supply zone** and **bearish trendline resistance**.
This zone is often considered the "decision point" where Smart Money evaluates whether to continue upward or resume the previous bearish trend.
---
## 📉 Strategy: Sell Limit Based on Structure + Liquidity
### ✅ Entry Zone:
**3341.500 – 3343.000**
(At the EQ zone + premium pricing area)
### 🛑 Stop Loss:
**Above 3345.000**
(Just beyond the last liquidity wick and top of supply)
### 🎯 Take Profit Targets:
- **TP1:** 3338.000 → First demand zone
- **TP2:** 3332.500 → Liquidity sweep target under previous lows
### 📐 Risk to Reward Ratio:
**1:3 or higher**, depending on execution precision.
---
## 🔎 Confluences Supporting the Setup:
| Factor | Confirmation |
|--------|--------------|
| EQ Zone (50% of previous move) | ✅ |
| Supply Zone | ✅ |
| Bearish Trendline Resistance | ✅ |
| Liquidity above EQ | ✅ |
| CHoCH + BOS (Market Structure Shift) | ✅ |
---
## 🧠 Why This Setup Works:
This is a classic **"Premium Price Rejection"** in a bearish environment, combining:
- Institutional logic (EQ level)
- Structural resistance (previous BOS)
- Liquidity traps above
---
## 🧵 Summary:
- **Sell Limit:** 3341.5 – 3343
- **SL:** 3345
- **TP1:** 3338
- **TP2:** 3332.5
- **RR:** 1:3+
- **Style:** Smart Money / Liquidity + Structure Based
---
🔔 **Disclaimer:** This is not financial advice. Always do your own analysis and manage risk accordingly.
#gold #XAUUSD #smartmoney #tradingview #liquidity #supplydemand #priceaction #forex #structure
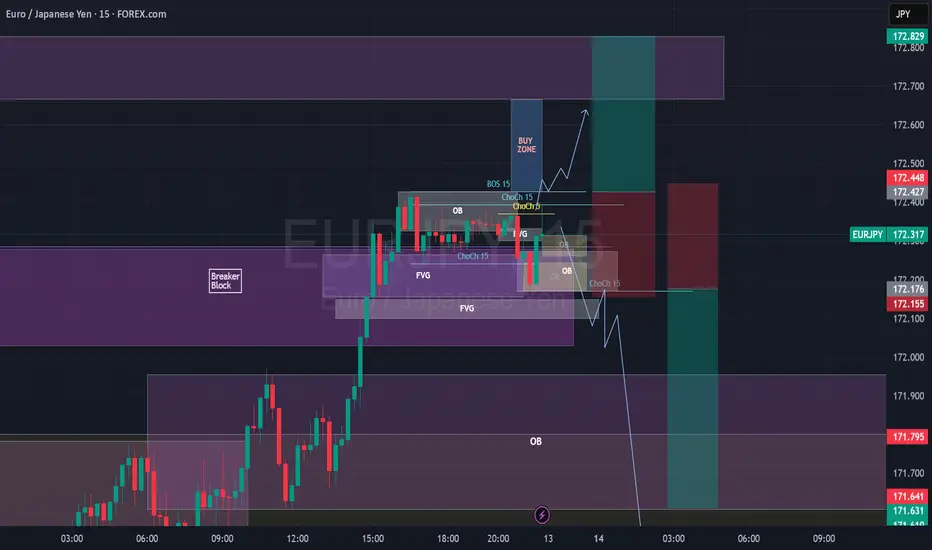
EURJPY Break of Structure, Retest and Fly5m - Monthly timeframes Bullish.
Price body candle closed and retested a 1H BB on 1H Timeframe.
Also retesting a 5M Bullish OB.
I want to wait for price to body candle close above the 15m BoS, create 3m/5m ChoCh, retest and look for Buys towards 172.665 (at the 1H OB or potentially 172.829, top of the 1H OB. SL under the 15m ChoCh.