CL - 4 Hour UTL / DX Crude Oil has been an RT Sell on every contact with the Upper Trend Line within
a large grind up from the 62s.
200+ BPS in the DX has provided further cover for the Energy Complex to extend beyond
the Inflation / Safety Trade.
___________________________________________________________________________
Build after build has had little to no impact upon Price.
Oil remains in a large trading range:
76.4% 114.76
61.8% 94.07
50% 77.35
38.2% 60.63
Price is now approaching the Top of the Resistance Range at the .618
as the 77's found support on the 2nd Test and Break.
____________________________________________________________________________
CL remains in overbought territory @ 77.56 Daily RSI
$ Flow continues to Chop, we will see if the push to our PO @ 94.
Cl!
WTI - CL - Above Probable Range
Consensus is $100 WTI - everyone is talking about it, maybe it happens.
From a technical standpoint - its overdone. Note the green arrows.
This week comments Nancy Pelosi sent crude screaming higher.
Obviously geopolitical issues will supersede technicals when it comes to oil prices.
That said I expect these comments to fizzle away - now that all shorts have been obliterated. WTI up over $3 on Friday alone at its peak.
US Dollar was down this week which also pushed oil higher - personally looking for DXY to move up as well, which will also support lower oil prices in USD.
Only the Euro rallied, both the Canadian Dollar and British Pound were lower.
Daily chart shows oil was divergent on this latest rally - and looked like $88 was likely the top, and it looked weak, with all the shorts in place, they thrust oil higher.
Looking for oil to pullback to about $83

Could Oil be giving us an early warning sign?This is the monthly chart of CL futures.
Will history repeat itself? Back in April of 2000 CL set off a monthly bearish spike alert and around that same timeperiod NQ & ES made there last ATH's until Sept 2016 & April 2013 respectively. The long term non-horizontal monthly trend lines (blue lines) also look eerily similar. The blue lines run along the monthly candle "bodies" after making ATH's and you can see they both break out on the 3rd hit of the blue line. I know, I know...this time is different but is it? Only time will tell if this is really "a clue". All I know is that I'm going to be on high alert to see if the ES can break out on the monthly from its Jan 2022 ATH at 4,808. Remember, most market tops before a longer term bearish trend takes over could take 3-6 months of consolidation before breaking to the downside so there is no reason to short the market at this point as the market is still overall bullish and has not given us any signs of slowing.
Another possible similarity...NQ's high in March of 2000 was 4,884, ES is currently at 4,808. NQ didn't make it to 5,000 until Jan 2017. Will the market give us the same sort of rejection to this number this time around?
This analysis is purely visual with the help of spike alerts created by @norok

CL - 4 hour / Blue Skies to 94sRegular Unleaded is up $0.30 in a week here.
Prem now over $4.
A large jump in short order as RBOB continues to
Price in Inflation.
______________________________________________
I'm sure this won't have any impact on the Indicies...

Crude oil targets the level of 89Ladies and gentlemen, as you can see in the graph
Crude oil targets the level of 89

CL - The Rude Dude's Nude Sellers to 94 POIf you are selling Crude Oil...
Look out above.
It has relentlessly wrecked sellers each and every day for Weeks.
_______________________________________________________
77 FWHB caught sellers off guard when it exceeded and it's been
off the races ever since.
It did exceed our PO @ 88.23, hopefully, a Pullback.

OIL likely to continue upwardsOIL just broke an important level , it is very likely to continue up towards the 99$-102$ area .

Crude Oil -Whom Do You TrustThe operators whipsawed the Back Gold and managed to create
another Fake Break @ Highs.
CL always pulls this stunt.
Now it's up to the Specs to pony up.
_________________________________________________________
API & EIA have not been supportive of the Price.
OPEC is now Silent.
__________________________________________________________
China has a 5-year SPR locked up along with foodstuffs.
__________________________________________________________
US Oligarchs can't wait to gobble up Companies on the Cheap.
The Rockies exited Oil for a reason.
___________________________________________________________
Can they stage the move back into the Channel and run to new highs
or is it lower lows... I never trust these pricks.

WTI Crude Daily Chart: Thoughts on trading and a setup...WTI Crude Daily Chart: Thoughts on trading and a trade set up illustration:
This post was written on January 18-19th but in order to avoid anyone viewing it as a trade recommendation I have withheld publication until today (1-21). It is only meant to illustrate how I think about trades and setups. The placing of entry and stop orders is complex. You need to develop your own plan, consistent with your risk management.
Most price change is noise. As an analyst your job is to identify those junctures where signal content is greater than noise content. Once those points are identified, you need a plan. TA is easy. Trading is way harder, particularly if you haven't systemized your plan.
Importantly, to be successful you need to do your own work. You need to understand how supply and demand shapes a market pattern and then find and isolate trading setups based on that knowledge. You do this by looking at, and more importantly thinking about, thousands of charts. Simple right? The point I'm trying to make is that you shouldn't expect to be successful by mimicking trades offered by some internet jackass like me. You have to do work. Hard work. Put in your time. Become a chart dog. Otherwise it’s a hobby, not a career. Hopefully these commentaries help you find a starting place.
WTI may be setting up one of my favorite technical trading setups, the failed breakout. I thought it might offer a good opportunity to walk through how I think about my trades. After all, what is the point of doing chart analysis if you don't have a plan to trade the analysis.
1. Today (1-19-2022) crude oil (CL) set a modest new high above $85.41 bb pivot that first appeared as resistance in October 2021.
2. Analysts making the fundamental case for $100.00bbl oil seem to be everywhere in the media today.
3. They may be right, sometimes the fundamental guys can be very good. But even in the cases where they get it right, their timing can be off dramatically.
4. In many cases the analyst or portfolio manager also makes the case for an energy overweight or a position in XLE. I would note that since breaking out above its October pivot, XLE has diverged significantly from the price of oil. XLE is up over 10% from its October high and nearly 30% from its December low. I have to ask myself why is XLE so much stronger than oil and how is this divergence most likely to be solved.
5. As a market moves into the zone around a prior high or low, there are really only two possible outcomes. The market either breaks out or it doesn't.
a. While there are only two possible outcomes, there are many variations in how the outcomes evolve.
b. To my mind, professional trading isn't about guessing the future so much as having a trading plan to take advantage of the setups.
The setup: Support and resistance confluences represent junctures where the signaling content is high.
1. CL is testing an important overhead pivot/resistance, in this case the $85.41 bbl high from late October.
2. Price is pressed against the top of the channel/rising triangle that defined the rally from late December.
3. Price is also pressing against the top of the moving average channel.
4. The triple resistance confluence should be difficult for the market to overcome.
5. The Relative Strength Index (momentum) is overbought. Note that this is the same degree of overbought that produced the June and October 2021 highs and has reliably produced important highs in the past.
6. Volume has been somewhat lighter on this move compared to the initial rally to $85.14 (suggesting less demand).
How do I think about set ups and trading?
1. The setup points above suggest that the market is more likely to fail/correct than to break out. In a case like this I am far more interested in finding a way to be short once a confirmed sign of failure materializes.
2. My favorite pattern in this situation is the upthrust or failed breakout.
a. Price moves above the resistance, triggering stop loss orders and attracting breakout traders.
b. After taking stops and attracting new weak handed longs, the market falls back below the prior pivot, forcing weak handed longs to exit.
c. This pattern is always better if it occurs within a few hours of the breakout (which CL has failed to do so far 01-20-2022).
3. If the market fails I like to have a sell order waiting back inside the range. If that sell order is triggered, I immediately place a stop loss order back above the first physical barrier. Trades should only be taken if the upside risk to the protective stop is reasonable.
a. I usually keep it simple. For instance I will often use a trade back below the low of the hour, day or week (depending upon the perspective I'm trading) leading to the failed breakout. Triggers can be set up using bars, volatility, TL breaks and dozens of other tactics.
b. This is the part where doing your homework and finding a tactic that is consistent with your temperament and risk management context becomes important.
4. Conversely if the market does the unexpected and breaks out, I begin looking for a consolidation pattern, for instance a bull flag or pennant pattern above which I can add a buy stop.
I believe that successful trading entails waiting for the high percentage and then having a trading plan to take advantage of it. A platform like TradingView makes it possible to look through hundreds or even thousands of charts to find precisely the trading setups you like the most.
Good Trading:
Stewart Taylor, CMT
Chartered Market Technician
Shared content and posted charts are intended to be used for informational and educational purposes only. The CMT Association does not offer, and this information shall not be understood or construed as, financial advice or investment recommendations. The information provided is not a substitute for advice from an investment professional. The CMT Association does not accept liability for any financial loss or damage our audience may incur.

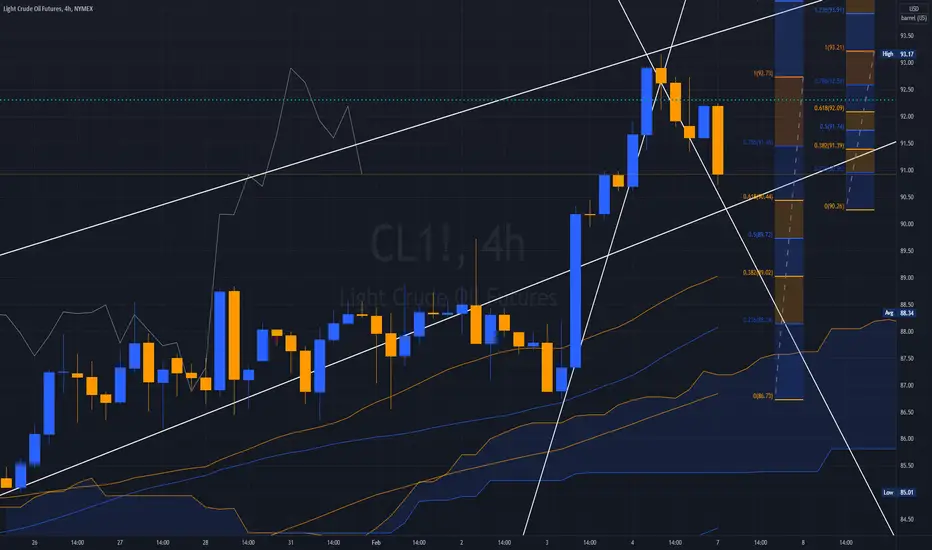
CL - 4 hour / We warned yesterday - do not Trust the Operators.
They Dinked the Chasers again.
Time and again, Crude Oil dips into Highs prior to a
large reversal.
Oil touts were out in force all week with $100, $125,
$150 and $300 Oil Targets.
Never is this a Goo Sign.
______________________________________________
Oil Touts are the "Tom Lees" of Equities.
86.42 was beat by 68 Ticks @ 87.10 and the Reversal began
in earnest.
It is grossly overbought.
The same "Investing" Group I've watched chase highs was up
to the usual Buy the Highs fluffing only far louder this go
around.
CL is now front running it's .382.
Energy began a downtrend with the Indices.
Now OIL Will lead.
The transports and Baltic Dry Index Ratio I provided analysis
for the Iimplied Ratio... worked once again.
The YEN Strenght Trade will also weigh on Crude OIl.
Risk-off as the Global Economy folds up its Tent.

CL - Crude Oil / EIA 11 AM EST TodayThe Divergences are quite large within the Overall Structure.
API was weak yesterday for all the $100 - $200 Price Targets
issued from Media Bullhorns.
Squeeze after squeeze has been the Modality for Operators.
_____________________________________________________
A very large Bull Flag at present seems to be encouraging the
Chasers as Specs remain extremely elevated.
Going to break hard one way or other.
Don't trust the Operators...
CL - Daily / 86.42 PO AchievedAPI and EIA Ahead the next 2 Days.
Both will be suspect, as they should be.
The CL Curve is interesting and deserves a review.
__________________________________________
Overconfidence
Hindsight
Regret Avoidance
All part of the Crude Oil Trade at present.
How it shakes out will be extremely telling for Oil.
___________________________________________
China claims to have 5 years of Strategic Reserves
and is now threatening to release them.
OPEC is claiming Peak Oil again, to provide the
counterweight.
____________________________________________
With important Data directly ahead, something is
going to give.
CL - Daily / 86.42 Pivot / API TomorrowEIA Thursday - last week's report was negative for CL.
No matter, with JPM calling for first $125 Crude
then $100 Crude revied later... Its clear the Operators
are having their way with Black Gold.
it is approaching an Overbought condition, but that is
becoming meaningless quickly as it can continue to
expand for some time.
The prior HIghs near this level tool 43 days to resolve,
sounds like a great many sleepless nights.
________________________________________________
The Symmetry breaks @ 86.42.
Extensions indicate 94.43 / 104/11 / 114/32
________________________________________________
GAS PRICES IN CALIFORNIA HAVE NOT RISEN IN 2 MONTHS
WHILE CRUSE HAS MOVED UP 23%.
Makes perfect sense...

Crude Oil - Baltic Dry Index RatioThe Chart is extreme Price Ratio behavior within
the WTIC to BDI Ratio.
Extreme is relative to TIME, as the ROC is quite robust.
And yet it remains at a mere fraction of its prior high @ 1.232.
______________________________________________________
Price is going to make a very large move in Crude Oil @ minimum
$10 and perhaps far more.
Recently we have seen this Ratio indicate the Sell at an extreme.
_______________________________________________________
The UAE Droeb attack news on a Holiday did very little to move
Price.
However, events such as attacks upon Oil Fields tend towards moving
Price up $10 in hours as it did last time.
________________________________________________________
There is an opportunity for those with a strong stomach.

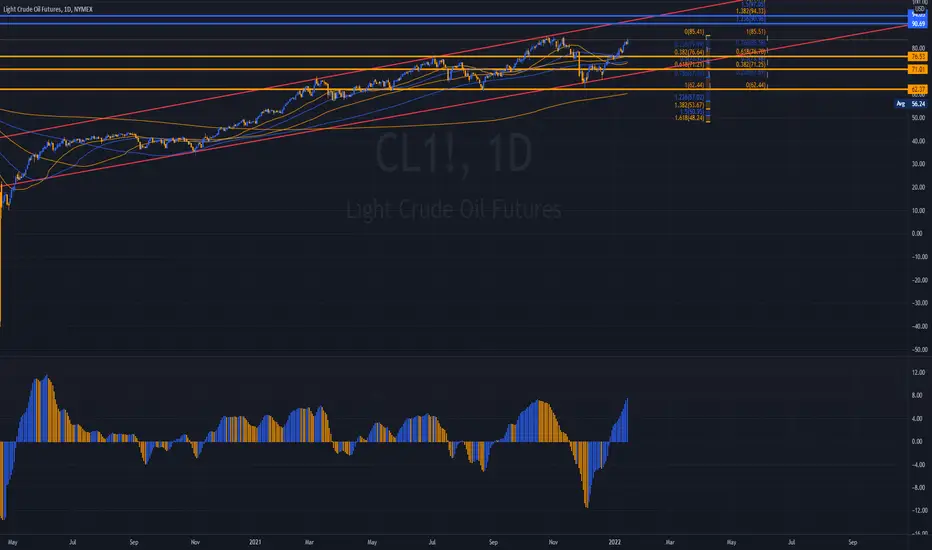
CL - Weekly / Pivotal Momentum ApproachingCrude Oil is extremely interesting at present.
$84 is the Level we are watching closely, not the Highs @ 85.41
as they will be important later this week.
This is a No Man's Land Trade at this Time.
_________________________________________________________
We anticipate a significant change of $10 on either side of $84.
To complicate matters is the Extension to $104 and then $112 should
CL holds the $84s for another two weeks.
There are a number of Indicators that will follow on to indicate the
potential outcomes.
The Baltic Dry Index to Crude Oil Ratio is an important one with a
prior leading Indications of Corrections and how they manifest themselves.
___________________________________________________________
Of late JOM has been out forecasting the $100 to $1125 Level this year.
Higher forecasts border on $200.
Retail is very much all in for Higher.
We hold NO Positions presently - instead of choosing to watch which way
this will Break, $74 OR $94.
Weekly Cloud Momentum Support is @ $74.
Open interest for March is biased to the Calls, with a widespread. Institutions
are not frankly engaged, as the Green Agenda is keeping them away from
"Dirty" Investments, or so it is claimed.
$ is their driving factor, regardless of Public expression(S).

CL - The Reversal is Setting UpSmall Specs aka Retailers are getting out over their Skis once again.
@ 90% Over their Skis.
The reversal will be an amazing event, it should occur prior to the
FOMC, but can grind higher for now.
We will be Sellers with tight stops overhead.
the Baltic Dry Index is collapsing, Oil historically follows.
Buy the Dip in Oil won't end well.
CL - 4 hourCrude Oil is at a pivotal juncture now with NG up 13%
yesterday.
Energy either breaks up and over the highs or we see
a sharp decline once overbought, we're not there yet
as these are very important levels.
It reinforces the Fed's need to act.
_______________________________________________
OVX is indicating some type of pullback shortly.
Volumes on Weekly TF have been extremely heavy.

CL - 4 hour / Gap FilledCrude Oil will provide the Leading Indication for a Reversal into the
3/5 for the Indices.
The DX has been wandering in the Desert @ 96.
All eyes have been on the Breakup and out to 98, it has
yet to materialize and with Rates pulling back, we will see
quite clearly where the Operators have designs on Price.
____________________________________________________________
EIA has shown Crude Draws with odd movements in RBOB / RB.
Energy has been a Pillar of the safety Trade since December
into January.
We see the potential for a reversal setting up nearer term.
Perhaps it will be the Instrument that provides leadership.
It's either down to 61 or up to 88 and then potentially 104.
Tik Tok.

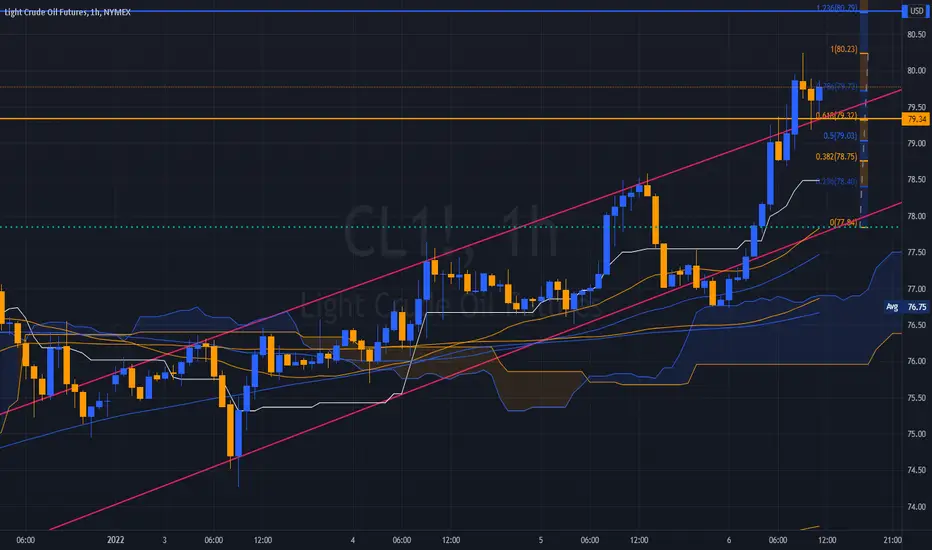
CL - 15 Minute MicroCrude Oil has an expanded range from 78.36 to 80.48.
Sellers have been roundly pushed back as CL would simply
collect the energy and grind higher.
API Today and EIA T0morrow will provide direction, the
Gap remains overhead and should be filled.
Rates have had a mild impact on CL, as has the DX.
___________________________________________________
We currently hold no positions and are awaiting the next break of 80
or support to trade to consider a Position.
The Weekly and Monthly ranges are quite large and have us squarely
on the sidelines while the Indices are providing greater Velocity
Intra-Day.
Should TNX backtest the breakout, we will be closely watching the
reaction within Energy.
NG came up nicely off its 3.50/3.70 range to move back over $4.
RBOB remains in a larger Range and is becoming a leader in the
Energy Complex into March as reformulations begin to gain momentum.

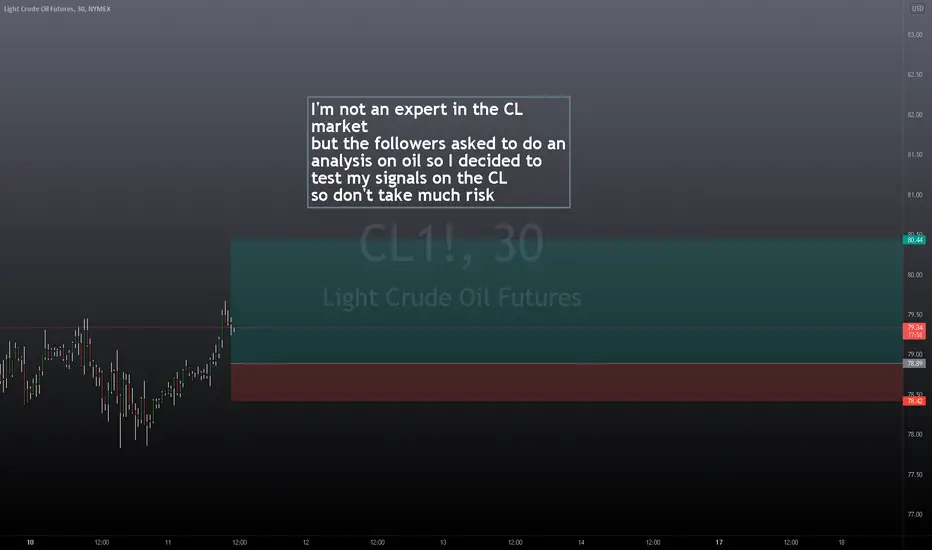
CL is bullishI'm not an expert in the CL market
but the followers asked to do an analysis on oil so I decided to test my signals on the CL
so don't take much risk
USO, 10 Jan. Is the Oil price about to crash?Oil has completed a 5-wave move on 25 Oct. Oscillators and geometry suggest a decline.
Geometry:
Price got rejected at the lower boundary of the channel. The red trend line is a second resistance, connecting the previous low and the gap.
Elliott:
We can count an ABC (in green), which makes up corrective wave (b), in blue. If correct, we can expect a wave C to the downside.
Oscillators:
The RSI shows a strong bearish divergence. The MFI points downwards. Stochastic is overbought and due to retrace.
Correlation:
USO is -.74 inversely correlated with TLT, at support, and .71 with XLE, at resistance.
How to trade it:
The idea is to build short exposure between 57 and 60. The red and blue trend lines give us two excellent risk-reward ratios. If price continues towards 60 it is likely to form an expanding flat correction. The idea is invalidated if USO establishes support above 56.

CL - Crude Oil persists in Grinding Up SellersOur Price Objectives complete the Gap FIll.
This has been a one-way Trade - Higher.
Sellers have been rejected on every Pullback only
to see Price move slowly, methodically... higher.
API / EIA / RIGS / OPEC has backstopped Crude Oil.
____________________________________________
FAding the Trend has been a ticket to larger losses
as Sellers on the Tape continues to double down
against the Trend on this move higher.
Adding Fuel to the fire that is energy at present.
It will be interesting to see IF this can run to 104.
We are very much in doubt of this, but anything is frankly
possible should Price grind to new highs above the 88.21 Level.

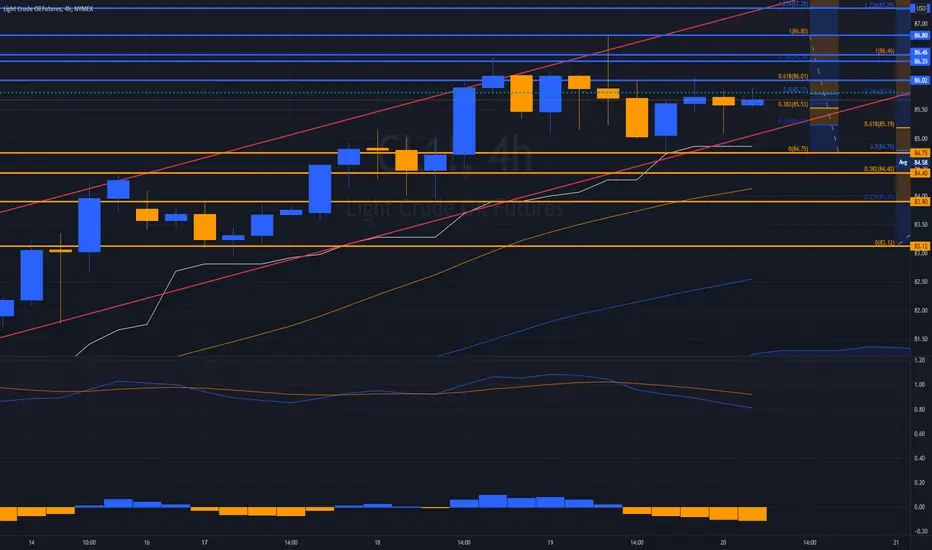
CL - Into the Gap Fill81.12 to 83.32 are not open for the Fill and Overthrow.
There is plenty of Oil regardless of API / EIA Non0-sense.
Hookahs are having a party at Virtual Davos this Year.
Bless them, them as the Sultan is worth $2.1 Trillion, makes
Gates, Buffet, Besos, and Elon look like Pikers.
_____________________________________________________
NQ will be in trade on NPK for Spring Argo-Biz and reformulations.
CL usually peaks this time of YEar with Nasty January / February effect
now in trade due to December effect push forward.
All in all it's broken the Channel we indicated would be important for the
toss over, mission accomplished.
It's been giving SELLERs Hell on a pitchfork, why then keep coming back
is beyond me, but we will gladly pick their pockets,