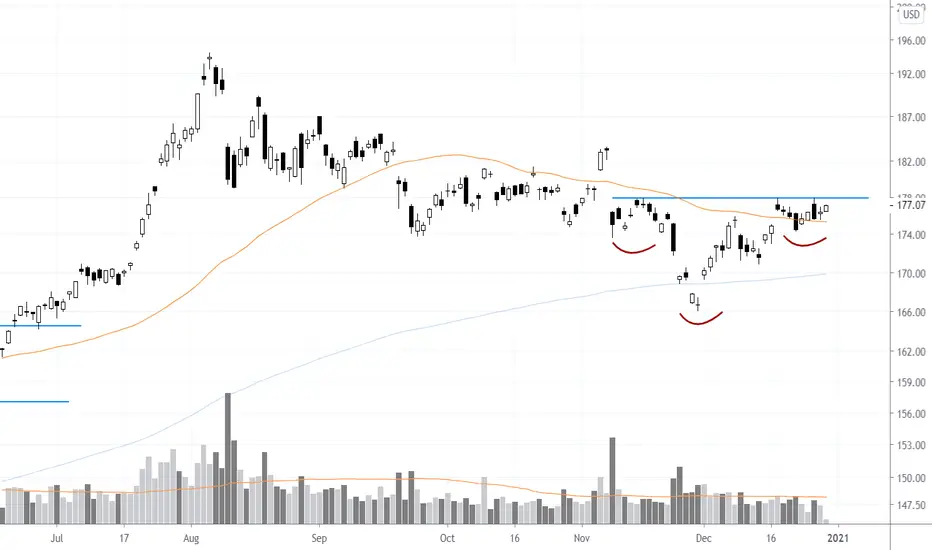
$AM Setup with Weekly and Daily PatternsAntero Midstream shows a weekly 13 months head and shoulders bottom pattern and a daily continuation head and shoulders pattern. The weekly chart is on the left of my post and the daily on the right.
The stock broke out of the multi month weekly head and shoulders on December closing above pattern neckline (blue line). The stock since then has formed a continuation head and shoulders pattern with the head testing the weekly neckline support. It is an interesting chart setup and one that I will be watching closely. A break over the daily neckline (green line) could send the stock into a strong 2021 uptrend.
Antero Midstream Corp (AM)- HOLDING CO PROVIDES NATURAL GAS GATHERING, COMPRESSION, PROCESSING, FRACTIONATION/INTEGRATED WATER SERVICES.
Classicalcharting

ADA/BTC - Possible H&S BottomI'd feel a lot better about going long if it breaks 0.00001
I am just going to sit on the sidelines until then.
Thanks

DXY - Diamond ReversalMonthly candles
Here's a long term picture of the DXY. It think its headed towards $80.
I'm short
Buy Bitcoin
Thanks


Google - Head and Shoulders?Google might be forming a Head and Shoulders top after a failed Cup and Handle. If the H&S plays out, I expect the gaps bellow to get filled.
Thanks

$HI #Breakout SetupIn November of this the stock broke out of a massive 1+year head on shoulder pattern (on the weekly time frame). The stock has been digesting that rally for a month moving sideways right below the $40 level. The head and shoulders bottom chart pattern price target is up around $53. The current sideway breakout setup could be the launching pad to that level.

Possible #HeadandShoulders Bottom Forming $GC_FNeckline around that $178 level. I am long $AUY from last week (but no fire works yet).

GDXJ - Huge Bull FlagHuge bull flag on daily chart. I went long today.
Price Target 1 - $77
Price Target 2 - $100

LINK/BTC - Is The Parabolic Run Over?LINK/BTC put in a major top pattern earlier this fall. It looks like the price is going to continue to drop further. The next support is at 0.0052. If it breaks that support, LINK's run is most likely over.

Cresco Labs - Inverse H&SCresco is ready to launch higher. It already broke out of the Inverse Head and Shoulders and it is currently flagging.
Price Target 1 - $13.30 but it will likely go higher
Thanks

NOIA/USDT - Inverse Head and ShouldersTextbook Inverse head and shoulders pattern. Headed to new highs.

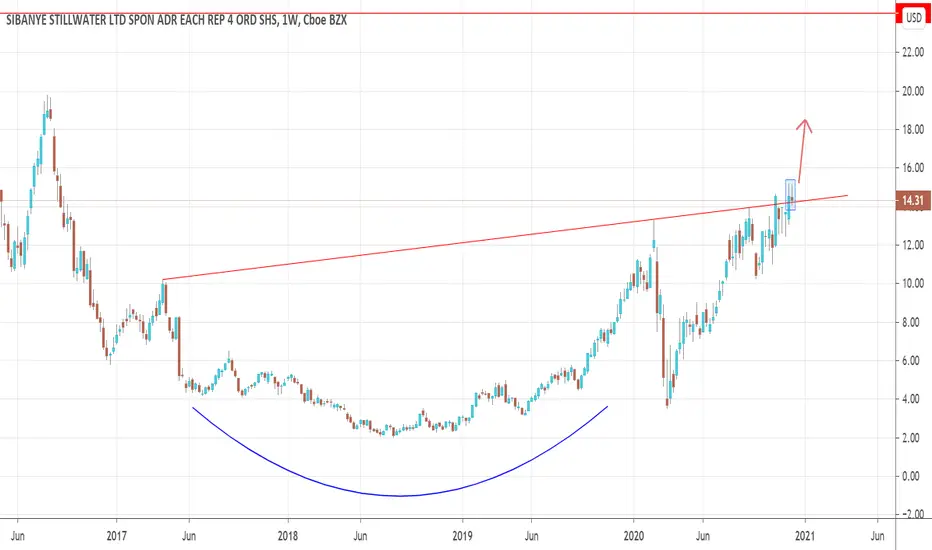
SBSW - Breakout or Another Fakeout?I like the long term setup here. Had a long position here a couple months ago but I got stopped out. I think it's ready to go this time but Ill be keeping a tight stop loss.
Price Target - $24
GNUS - Inverse H&SPretty straight forward set up. Inverse Head and Shoulders. I think it goes above 2 bucks.
Thanks

SOLO - Inverse Cup and HandleLooks like an Inverse Cup and Handle. I don't have a position yet but this might be a good opportunity to short.

Bitcoin - Sideways Movement + Altcoin rallyIt looks like Bitcoin has strong support at 17,100. I expect this to hold but I think the price is going to move sideways for a little while (Similar to the price action from May - July) . We might see a Cup and Handle breakout on the longer term chart.
Now might be a good time to start loading up on altcoins.
Thanks

Netflix - Rectangle PatternNetflix has been stuck in the $460-$570 range since July. I am expecting it to retest $570 then possibly break higher.
I do not have a position yet.

Bull Flag - WTI CrudeOil is currently flagging just above the August highs. This signals a continuation in the upward trend.
Price Target - $50

Ethereum - Inverted Head and ShouldersInverted Head and Shoulders on daily chart.
Price Target - $830

XRP/BTC - Bull PennantBull pennant on daily chart. I have no position yet. I am waiting for a confirmation candle.
If it breaks bullish my price target is 0.00006

Google - Cup and HandleTextbook Cup and Handle pattern. I don't have a position here but I really like the setup.
Price Target - $2148

Gap Up to New HighsI'm a bit skeptical of the recent stock market rally, but It looks like there is still room for it to run.
The SPX broke out of a massive bull pennant on 11/9 and it has been range bound since then. Today (12/1) it gapped up to new highs.
Price target - $3900

$GRVY breakout setup with conflicting signalsAnnotated on the chart. Was it not for the heavy volume selling few days back, this would be a chart I would have a great interest in. When the pattern is giving mixed signals, i normally pass on the trade. I currently have 11 long positions on with all well in the green except 1. As such, I'll be passing on this setup but will keep it on my watch list to see how it plays out. I think a few more small body candles right below pattern resistance before the breakout takes place could give the setup higher probability of success.
