DeGRAM | GOLD try to fix under the $5100📊 Technical Analysis
● XAU/USD is consolidating below a well-defined resistance area near 5,090–5,110 after a strong impulsive rally, showing repeated upper-wick rejections and loss of upside momentum.
● Price remains above the rising support line, but the latest structure suggests a corrective pullback toward dynamic support around 5,050–5,020 if the resistance zone holds.
💡 Fundamental Analysis
● Stable US yields and cautious risk sentiment reduce short-term demand for safe havens, increasing the probability of a technical correction in gold.
✨ Summary
● Gold is capped by strong resistance.
● A short-term pullback toward 5,050–5,020 is favored while below 5,110.
-------------------
Share your opinion in the comments and support the idea with a like. Thanks for your support!
Commodities

BTC vs. Gold similar sigularityThe daily bars from gold in the 1970s are similar to the weekly btc chart 2025.
Let´s see whats happpend after the actual gold run dropped and the money is turning back in digital gold btc.
Amazing times ahead.

GBP/USD | Retesting the Bearish OB (READ THE CAPTION)As you can see in the Daily chart of GBPUSD, It went up as high as 1.37134 and reached the Bearish OB, after which it dropped to just below the High of the NWOG, now being traded at 1.36780. I expect GBPUSD to retest the bearish OB.
For the time being, the targets are: 1.36960, 1.37040 and 1.37120.

Crude Oil Mini (MCX) – Back-to-Back 5 Winning Trades using EPAI 🔥 Crude Oil Mini (MCX) – Back-to-Back 5 Winning Trades using EPAI Indicator 🔥
Consistency beats prediction. 📈
EPAI Indicator delivered 5 consecutive winning trades in Crude Oil Mini, respecting trend, MA structure, and disciplined exits.
📊 Trade Highlights:
EPAI Trade-1: Sell @ 5580 → Exit at MA 5505
EPAI Trade-2: Buy @ 5370 → Exit at MA 5410
EPAI Trade-3: Sell @ 5530 → Exit at MA 5570
EPAI Trade-4: Sell @ 5580 → Exit at MA 5550
EPAI Trade-5: Sell @ 5640 → Exit at MA 5560
✅ Clear entries
✅ Rule-based MA exits
✅ Trend-aligned execution
✅ No overtrading, no emotions
This is what process-driven trading looks like.
EPAI focuses on structure + momentum + dynamic exits, helping traders stay on the right side of the market.
📩 For EPAI strategy & indicator details, DM me.
#CrudeOil #MCX #IntradayTrading #PriceAction #AlgoTrading #TradingView #WinningTrades #RiskManagement #EPAI #Consistency

Generational Wealth | Precious Metals Super Cycle | Palladium Strategy: Impulse Correction
Direction: Bullish
Moving Average: Blue above Red
Fib Retracement: 38.2 reached
MACD > 0
Support : Finding additional confluence, as the weekly bounces off a massive support structure.
Alongside this, we can see that a reverse pattern is becoming clear with additional support illustrated by the support level in the form of the rectangular red box.
1st Target = 1678
2nd Target = 1836
3rd Target = 2039
Lots: 0.1 (Plan to pyramid into this one)
INSIGHTS: Precious metals continue to show strength with a weakening dollar. Pay attention to the DBC commodity Index which is indicating strength across the commodity complex. Alongside this, the DXY is sitting at an interesting level. Lets see whether will bounce at this level off a multiyear trend or whether the dollar will give way to lower lows in the coming months.

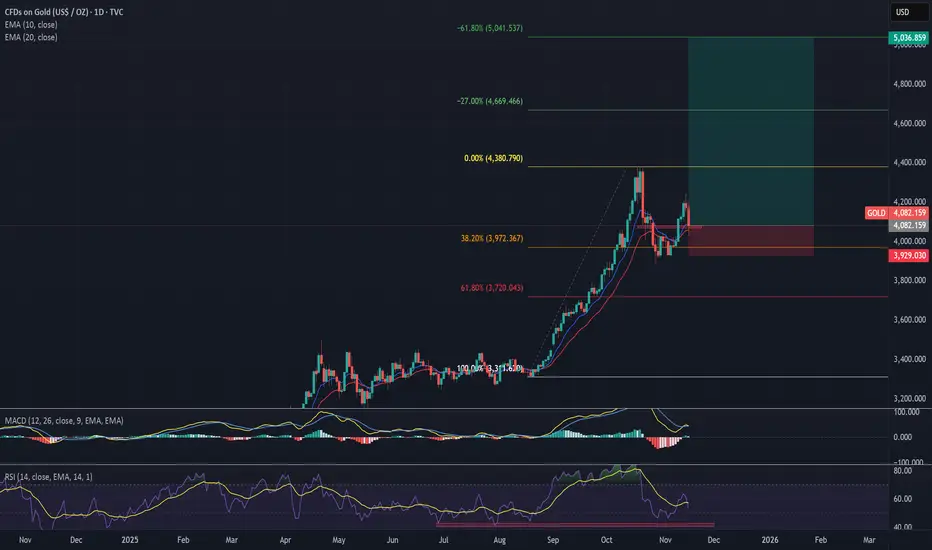
Generational Wealth | Precious Metals Super Cycle | GoldStrategy: Impulse Correction
Direction: Bullish
Moving Average: Blue above Red
Fib Retracement: 38.2 reached
MACD > 0
Support: After a massive sell-off across the board, we will look to see if gold can hold support by bouncing off the moving averages. Lets see if it can find bullish strength and regain the move experienced on Friday. If it moves lower, we could see it going back to 4000, before a potential reversal.
1st Target = 4380
2nd Target = 4669
3rd Target = 5041
Lots: 0.1 (Plan to pyramid into this one)
INSIGHTS: Precious metals continue to show strength with a weakening dollar. Pay attention to the DBC commodity Index which is indicating strength across the commodity complex. Alongside this, the DXY is sitting at an interesting level. Lets see whether will bounce at this level off a multiyear trend or whether the dollar will give way to lower lows in the coming months.
GOLD approaching Buying ClimaxGold is trading 35% above the 50 Week MA and approaching a buying Climax.
RSI is elevated and unsustainable, even more so on the monthly timeframe.
Max Upside Risk 5200$
First Level Down is the 4800$ Area
Max Downside is the upcoming 50 Week MA.

XAG/USD: Assessing Distribution Phase and Potential Trendline BrSilver (XAG/USD) ki halia price action 15-minute timeframe par aik mazzboot "Ascending Channel" ke andar trade karne ke baad ab aik critical junction par khari hai. Price ne channel ki oopri satah (resistance) se mazzboot rejection li hai, jo ke market mein buyers ki thakawat (exhaustion) ko zahir karti hai. Hum ab aik "Distribution Phase" dekh rahe hain jahan sellers control dobara haasil karne ki koshish mein hain.
Key Technical Observations:
Channel Exhaustion: Price action ne channel ki upper boundary ko multiple times test kiya hai lekin wahan hold karne mein nakam rahi hai. Ye aik classic sign hai ke market ab ooper jane ke liye mazeed liquidity dhoond rahi hai.
Structure Shift: Black path se wazeh hota hai ke hum aik "Lower High" formation ki tawaqqo kar rahe hain. Agar price channel ki lower trendline ko decisively break karti hai, to ye market structure ka bullish se bearish mein tabdeeli (Change of Character) ka signal hoga.
Liquidity Targets: Niche ki taraf hamara pehla target 106.000 ka level hai, jo aik intermediate base hai. Agar bearish momentum barkaraar rehta hai, to price mazeed niche 102.500 ke major support area tak gir sakti hai taaki purani liquidity ko clear kiya ja sakay.
Risk Parameters: Ye bearish view tab tak valid hai jab tak Silver 112.500 ke halia peak ke niche trade kar raha hai. Is level se ooper ki closing is setup ko invalidate kar degi aur trend continuation ka ishara degi.

XAUUSD: false breakout setup🛠 Technical Analysis: On the 4-hour timeframe, XAUUSD remains in a strong uptrend, but the price is currently squeezing below a clearly defined resistance band in the 5080-5100 region. A probable breakout above this zone could potentially form a "false breakout," trapping buyers before a corrective move begins. The key trigger is the rising trendline support: a confirmed break below it would confirm a bearish correction scenario. The price is still above the 50/100/200 SMA, but a loss of the trendline + SMA50 area will likely accelerate the downward momentum. The next important demand zone is near 4900. A sustained hold above the resistance zone (and especially above the 5184 area) would invalidate the sell signal and maintain the bullish trend.
———————————————
❗️ Trade Parameters (SELL)
———————————————
➡️ Entry Point: Sell on a confirmed false breakout at 5,080–5,100 followed by a break below the rising trend support (approx. 5,050–5,070)
🎯 Take Profit: Support near 4,900
🔴 Stop Loss: 5,184
⚠️ Disclaimer: This is a potential trade idea based on current analysis; market conditions and price direction are subject to change based on news factors and volatility.

Silver (XAG/USD): Bearish Reversal Potential at Parallel ChannelSilver filwaqt 15-minute timeframe par aik mazzboot ascending channel ke andar trade kar raha hai, lekin price action ab exhaustion (thakawat) ke signs dikha raha hai. Market ne channel ki upper boundary ko touch kiya hai jo ke aik major resistance zone hai, aur yahan se aik bearish reversal ka imkan nazar aa raha hai.
Technical Analysis & Strategy:
Channel Resistance: Price ne channel ki oopri satah (upper rail) par resistance li hai. Ye area buyers ke liye thora mushkil sabit ho raha hai kyunke yahan supply mazzboot hai.
Projected Bearish Path: Black arrows se wazeh hota hai ke market aik "Lower High" structure banane ki koshish kar rahi hai. Agar price channel ki midline ko break karti hai, to ye niche ki taraf aik barri move ka signal hoga.
Key Targets:
TP 1: 106.000 (Internal support level)
TP 2: 102.500 (Major structural demand zone)
Risk Management: Setup tab tak valid hai jab tak price halia swing high yaani 112.500 ke niche rehti hai. Is level ke ooper closing bullish trend ko dubara activate kar degi.
Market Sentiment: Filwaqt sellers control gain karne ki koshish kar rahe hain. Trendline ka breakdown is setup ki confirmation ke liye zaroori hai.

EUR/USD | Going higher? (READ THE CAPTION)As you can see in the 2H chart of EURUSD, it reached a high of 1.19072 before dropping into the NWOG Zone, just below the high of the NWOG, being traded at 1.18630. It went inside the Jan 26th's NWOG zone, but managed to bounce back up.
For the time being, the targets are: 1.18710, 1.18890, 1.19070.

DeGRAM | GOLD is testing the $5110📊 Technical Analysis
● XAU/USD remains inside a rising channel but shows exhaustion after a strong impulsive leg into the 5,110 resistance, where price failed to hold above the upper boundary.
● The highlighted gap near the channel midline and a bearish rejection signal increased pullback risk toward the rising support zone at 4,970–4,950.
💡 Fundamental Analysis
● Sustained USD strength and elevated US bond yields reduce demand for non-yielding assets, supporting a short-term corrective move in gold.
✨ Summary
● Price is overstretched at channel resistance.
● A corrective decline toward 4,970–4,950 is favored while below 5,110.
-------------------
Share your opinion in the comments and support the idea with a like. Thanks for your support!

GOLD: Bearish Continuation & Short Trade
GOLD
- Classic bearish pattern
- Our team expects retracement
SUGGESTED TRADE:
Swing Trade
Sell GOLD
Entry - 5076.5
Stop - 5090.6
Take - 5052.9
Our Risk - 1%
Start protection of your profits from lower levels
Disclosure: I am part of Trade Nation's Influencer program and receive a monthly fee for using their TradingView charts in my analysis.
❤️ Please, support our work with like & comment! ❤️

GOLD | Breaks $5,100 as Shutdown & Geopolitical Risks RiseGOLD | Breaks Above $5,100 as Shutdown & Geopolitical Risks Fuel Rally
Gold surged above $5,100 per ounce, extending its historic rally after decisively breaking the $5,000 psychological level. The move comes as markets react to rising U.S. government shutdown fears, persistent geopolitical tensions, and expectations that the Federal Reserve may be approaching the later stage of its restrictive cycle.
With risk sentiment fragile and real yields under pressure, gold continues to attract strong safe-haven demand, keeping volatility elevated despite overextended conditions.
Technical Outlook
After the sharp upside move, price is expected to consolidate within the 5097–5077 zone before the next directional break.
A confirmed 15min or 1H close below 5077 would signal a deeper corrective move toward 5052, with further downside risk toward the 5000 psychological level.
However, price stability above 5052, and especially a hold above 5097, would keep the bullish structure intact and support a continuation toward 5140 and 5168.
Key Levels
• Pivot Zone: 5077 – 5097
• Support: 5052 – 5000
• Resistance: 5140 – 5168

USD/JPY | Up or down? (READ THE CAPTION)As you can see in the 4H chart of USDPJY, this pair has been gradually dropping for quite a while, going down from 159.45 all the way to 153.17! It is currently being traded at 153.58, just below the low of the Bullish OB.
I expect USDJPY to struggle with the Bullish OB for a while before making its next move.
Bullish Targets: 154.00, 154.45, 154.88 and 155.30
Bearish Targets: 153.20, 153.00, 152,80 and 152.60.

GOLD: Strong! Buy The Dips!In this Weekly Market Forecast, we will analyze Gold (XAUUSD) for the week of Jan. 26 - 30th.
Gold closed last week bullish, surging to ATHs. No reason to look for shorts. Waiting for dip buying opportunities is the best bet.
Look for the +FVGs on the LTFs to be tested for support. Those may be the opportunities to get in buy entries.
Enjoy!
May profits be upon you.
Leave any questions or comments in the comment section.
I appreciate any feedback from my viewers!
Like and/or subscribe if you want more accurate analysis.
Thank you so much!
Disclaimer:
I do not provide personal investment advice and I am not a qualified licensed investment advisor.
All information found here, including any ideas, opinions, views, predictions, forecasts, commentaries, suggestions, expressed or implied herein, are for informational, entertainment or educational purposes only and should not be construed as personal investment advice. While the information provided is believed to be accurate, it may include errors or inaccuracies.
I will not and cannot be held liable for any actions you take as a result of anything you read here.
Conduct your own due diligence, or consult a licensed financial advisor or broker before making any and all investment decisions. Any investments, trades, speculations, or decisions made on the basis of any information found on this channel, expressed or implied herein, are committed at your own risk, financial or otherwise.

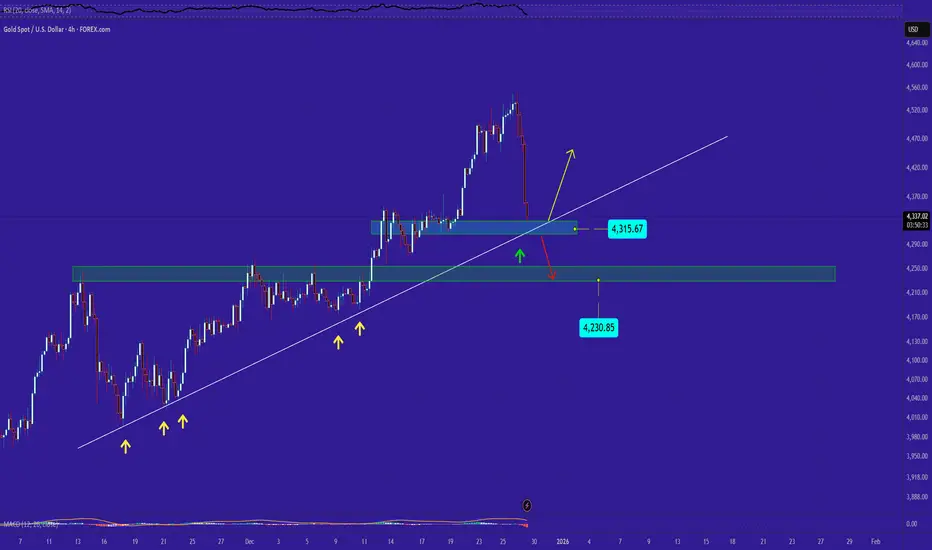
GOLD's SituationFor this drop, we can consider two support levels: one dynamic and one static. I’m hoping the dynamic support line can stop the decline. If not, and the dynamic support is broken, the price may fall down to around 4230.

XAUUSD 1H (OANDA): Bull TrendXAUUSD 1H (OANDA): Bull Trend, But Price Is Trapped Under a Weak High – Expect a Sweep or a Deeper Rotation
Gold remains in a strong 1H uptrend overall, but the latest price action is flashing a key short-term warning: the market is consolidating under a marked weak high after a sharp push up. On your chart, the top box shows repeated reactions, multiple CHoCH prints inside the range, and a clear liquidity structure (equal highs/equal lows) that often precedes either:
a liquidity sweep above the weak high to trap breakout buyers, then a selloff, or
a clean breakout with acceptance that continues the bullish trend.
This is a classic “decision zone” where you should trade the edges, not the middle.
Market Structure and Price Behavior
Macro bias (1H): still bullish (the staircase advance with BOS legs is intact).
Current phase: distribution-like consolidation near the highs.
Key observation: the market is “advertising” the weak high. Weak highs are frequently swept before the real move happens.
If price fails to hold the current top-range support, the next move is likely a rotation into the nearest demand bands marked on the chart.
Key Resistance and Support Levels (From the Chart)
Resistance
5,090–5,105: current supply lid / top-range pressure area.
Weak High zone: the marked weak high above the range (primary liquidity target).
5,120: next major upside magnet if a breakout is accepted.
Support
5,060–5,040: immediate pullback support (reaction zone after the sell spike).
5,000–4,980: psychological + structural support (key intraday defense).
4,920–4,900: first highlighted demand band (strong reaction zone if breakdown confirms).
4,820–4,800: second demand band (deeper pullback target).
4,660–4,620: broader base support (trend would weaken significantly if price returns here).
Fibonacci Roadmap (Best Dip-Buy Zones)
Anchor Fibonacci from the latest impulse swing low (around the last major push before the top consolidation) to the recent high:
0.382 typically aligns near the first pullback pocket (often around the 5,040–5,000 region here).
0.5 aligns with the next demand band (commonly around 4,920–4,900).
0.618 often overlaps deeper demand (around 4,820–4,800).
This creates a clean hierarchy:
Hold above 5,000 = shallow correction, trend continuation remains favored.
Lose 5,000 = rotation risk increases toward 4,920 and potentially 4,820.
EMA and RSI Filters (Quick Confirmation Rules)
EMA (use EMA20 and EMA50 on 1H)
Bullish continuation: price holds above EMA20 and EMA20 stays above EMA50.
Distribution warning: repeated 1H closes below EMA20 while trapped under resistance often leads to a flush.
RSI (14)
Bull control: RSI holds above 50 during consolidation.
Breakout strength: RSI pushes above 60 with a 1H close above resistance.
Breakdown risk: RSI slips below 45 while price loses the range floor.
Trading Plan (Clear Entry, SL, TP)
Scenario 1: Buy Breakout Only With Acceptance (Continuation Setup)
Trigger
1H candle closes above the range top (above the current supply lid) and the next candle does not instantly reject.
Entry
Buy on a retest of the broken level (range top becomes support).
Stop loss
SL below the retest swing low (or below the range top if you want a tighter invalidation).
Take profit
TP1: retest of the weak high zone
TP2: extension toward 5,120 if momentum remains strong (trail with EMA20)
Best practice
Avoid buying a single wick above the range. Acceptance matters more than the spike.
Scenario 2: Liquidity Sweep Above Weak High Then Sell (High-Probability Reversal Pattern)
Trigger
Price spikes above the weak high but closes back inside the range with a strong rejection candle.
Entry
Sell after the rejection close, ideally on a lower-timeframe pullback toward the sweep zone.
Stop loss
SL above the sweep high.
Take profit
TP1: 5,060–5,040
TP2: 5,000–4,980
TP3: 4,920–4,900 if 5,000 breaks with confirmation
This aligns closely with the projected path drawn on your chart.
Scenario 3: Sell Breakdown of Range Support (Rotation Into Demand)
Trigger
1H close below the range floor (the lower boundary of the top box) and retest fails.
Entry
Sell the retest rejection.
Stop loss
SL back inside the range.
Take profit
TP1: 5,000–4,980
TP2: 4,920–4,900 demand band
TP3: 4,820–4,800 if selling pressure expands
Scenario 4: Buy the Dip at Demand (Safer Trend-Continuation Approach)
Trigger
Price reaches a marked demand band and prints rejection (strong lower wick, engulfing, or impulsive reclaim).
Entry zones
First buy zone: 5,000–4,980
Second buy zone: 4,920–4,900
Deep buy zone: 4,820–4,800
Stop loss
Place SL below the demand band low (avoid placing it too tight; gold often hunts stops around round numbers).
Take profit
TP1: back to 5,040–5,060
TP2: range top / weak high zone
Execution Notes (Avoid the Chop)
Do not trade the middle of the range. The range is designed to trap both sides.
The best decisions happen at:
the range top / weak high (sweep or breakout)
the range floor (breakdown confirmation)
the demand bands (structured dip buys)
Summary
XAUUSD 1H is still bullish structurally, but the current consolidation under a weak high increases the probability of a liquidity sweep and a rotation lower before continuation. The highest-quality setups are:
buy only after breakout acceptance,
sell a confirmed weak-high sweep,
or wait to buy the dip at 5,000–4,980 and the demand bands at 4,920–4,900 / 4,820–4,800.

Gold 30-Min — Volume Buy Reversal Triggered⚡Base : Hanzo Trading Alpha Algorithm
The algorithm calculates volatility displacement vs liquidity recovery, identifying where probability meets imbalance.
It trades only where precision, volume, and manipulation intersect —only logic.
Technical Reasons
/ Direction — LONG / Reversal 5080 Area
☄️Bullish momentum confirmed through strong candle body.
☄️Structure shifted with higher-low near key demand base.
☄️Volume expanding confirms order-flow alignment upward.
☄️Buyers reclaimed imbalance with sustained clean break.
☄️Algorithm detects rising momentum under low liquidity.
⚙️ Hanzo Alpha Trading Protocol
The Alpha Candle defines the day’s real control zone — the first battle of momentum.
From this origin, the Volume Window reveals where the next precision strike begins.
⚙️ Hanzo Volume Window / Map
Window tracked from 10:30 — mapping true market behavior.
POC alignment exposes institutional bias and breakout potential zones.
⚙️ Hanzo Delta Window / Pulse
Delta window monitors real buying vs. selling power behind each move.
Tracks volume aggression to expose who controls the candle — buyers or sellers.
When Delta aligns with Volume Map, momentum becomes undeniable.

Riding the XAUUSD Gold MONSTER Trade | What’s Next?In this video, we continue managing our XAUUSD Gold MONSTER trade 🥇💪. We’ve been seeing consistent success with every position we’ve opened recently 📈, and we break down our potential next move. Price is printing clear higher highs and higher lows on the 30-minute chart ⏱️📊, and we’re looking to capitalize on the next swing high and retracement.

Fundamental Note: DXY(USD) 26 Jan 2026DXY starts the week hovering near the 97 handle and around four-month lows as investors reassess the dollar’s “safe-haven” role amid rising policy/geopolitical uncertainty and increased FX-hedging by foreign holders of US assets. The key event is the Fed’s Jan 28 FOMC meeting, where rates are widely expected to be kept unchanged and the market will trade off Powell’s tone rather than new projections. Beyond the policy statement, the Fed-independence narrative is a real macro risk premium now, with political pressure and legal/probe headlines potentially impacting USD confidence and rate expectations simultaneously. US Treasuries are the second big driver: this week’s heavy auction slate (2Y/5Y/7Y) can swing front-end yields and the curve, which usually feeds directly into DXY momentum. However, if investors demand higher term premium because of Fed credibility/fiscal-policy concerns, long yields can rise without a “clean” USD bid (a classic setup for choppy, headline-driven DXY). Geopolitics remains two-sided: Greenland-linked US–EU tariff threats and Middle East/Iran risk can spark haven demand, but recent bouts have also pushed flows into gold and other havens while the dollar softened.
Bottom line: DXY is set for a volatility week where Fed communication + Treasury yields + geopolitical headlines decide whether the dollar bounces or stays “sold on rallies.”
🟢 Bullish factors:
1. Fed holds rates and sounds less dovish than market pricing → yields/USD rebound.
2. Firm US data (e.g., durable goods) supporting growth/real yields.
3. Risk-off spikes can still generate short-term USD demand via liquidity preference.
🔴 Bearish factors:
1. Any dovish tilt from Powell (or clearer “cuts by mid-2026” guidance) pressures DXY.
2. Fed-independence/policy uncertainty → more FX hedging / “Sell America” diversification flows.
3. FX-intervention talk around USDJPY can weigh on broad USD sentiment.
🎯 Expected targets: Base-case range trading 98.0–100.0 into/through the FOMC; a hawkish-hold + firmer yields scenario can lift DXY toward 99.8–100.6 , while dovish messaging or renewed Fed-independence headlines risk a slide toward 97.5–96.8 .

Silver Buy Trading Opportunity SpottedH1 - Strong bullish move
Currently it looks like a pullback is happening.
Until the two support zones hold I expect bullish continuation.
👉 If you enjoy this analysis, please Like, Follow, and Support the profile! Your engagement motivates us to share more quality setups.
